


 |
市場調查報告書
商品編碼
2123285
擴增實境(XR):市場佔有率分析、產業趨勢與統計數據、成長預測(2026-2031)Extended Reality (XR) - Market Share Analysis, Industry Trends & Statistics, Growth Forecasts (2026 - 2031) |
||||||

※ 本網頁內容可能與最新版本有所差異。詳細情況請與我們聯繫。
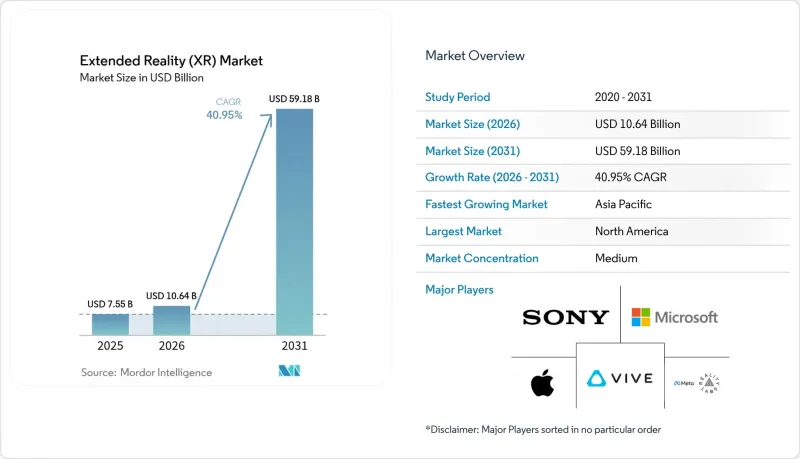
預計到 2026 年,擴增實境(XR) 市場價值將達到 106.4 億美元,高於 2025 年的 75.5 億美元,預計到 2031 年將達到 591.8 億美元。
預計從 2026 年到 2031 年,其複合年成長率將達到 40.95%。
本報告按混合實境方式(硬體、軟體、服務)、裝置類型(頭戴式顯示器(有線、獨立式)、抬頭顯示器等)、技術(虛擬實境 (VR)、擴增實境(AR)、混合實境 (MR))和最終用戶產業(遊戲和娛樂、醫療保健和生命科學等)進行細分。市場預測以價值(美元)表示。
全球擴增實境(XR)市場趨勢與洞察
擴大 5G 覆蓋範圍和邊緣運算的協同效應。
愛立信、AT&T、Dreamscape 和高通的試點計畫表明,低於 20 毫秒的延遲使得多人 VR 協作無需使用有線背包式電腦。中國鋼鐵公司利用 5G 技術打造的虛擬工廠參觀體驗,整合了來自 85 個生產節點的即時數據,展現了 5G 在重工業領域的價值。 DHL 的智慧眼鏡試點計畫則展示了即時揀貨指導帶來的物流優勢。隨著運算能力向網路邊緣轉移,設備重量得以減輕,從而提升了用戶輪班期間的舒適度。因此,營運商正在用戶 50 公里範圍內部署微型資料中心,以維持身臨其境型網路的吞吐量。
XR技術與數位孿生和工業4.0框架融合的進展
和碩的「PEGAVERSE」基於NVIDIA Omniverse平台建構了五個虛擬工廠,利用這些工廠進行遠距離診斷和場景測試,從而減少停機時間和差旅時間。BASF的AR工廠規劃將感測器數據與身臨其境型視覺化相結合,簡化了危險區域的識別。西門子和SONY推出了售價4750美元的「SRH-S1」工程頭戴式顯示器,實現了像素級設計協作。 OpenUSD對齊技術允許將來自不同CAD、PLM和物聯網系統的資料整合到單一空間層。這使得平台供應商能夠透過訂閱式視覺化服務而非一次性授權費來獲利。
高解析度光學元件和處理器的初始成本很高
鎵和鍺的供不應求導致光學元件價格上漲高達25%。 Meta公司的Reality Labs自2020年以來累計虧損600億美元,而其在2024年第四季僅售出價值11億美元的XR硬體,凸顯了盈利方面的挑戰。缺乏資金或明確投資報酬率的中小型企業對進入市場猶豫不決。 XR的雲端渲染技術可實現更輕的設備,但其帶來的延遲限制了其應用範圍,使其只能在5G網路覆蓋區域使用。
細分市場分析
儘管硬體在2024年佔總營收的53.2%,但服務部門預計將以42.5%的複合年成長率(CAGR)實現最快成長。將設備、軟體和託管支援結合的訂閱套餐將資本支出(CAPEX)轉化為營運支出(OPEX),這種模式更受財務部門青睞。這種轉變為供應商提供了可預測且永續的收入,並降低了客戶的進入門檻。 Meta的平台策略轉型清晰地體現了這一趨勢,該公司正在探索企業訂閱模式,並將其與硬體現代化相結合。
由於其對內容的特殊要求,託管式培訓和模擬服務價格不菲。光是Vertex Solutions就已在全球範圍內交付了超過500套軍用級模擬器,彰顯了其在該領域的專業實力。這些合約通常為期多年,使供應商能夠獲得更高的終身價值。因此,硬體製造商不再直接競爭,而是選擇與整合商合作,這反映出以服務主導的擴增實境(XR)市場日趨成熟。
儘管頭戴式顯示器 (HMD) 在 2024 年仍佔銷售額的 42.7%,但目前成長的主要驅動力正轉向空間和全像顯示器,預計複合年成長率將達到 43.1%。共用顯示牆克服了個人頭戴式顯示器在衛生和舒適度方面的局限性,並支援協作式技術評審和客戶演示。三星的「Project Moohan」就是一個典型的例子,它是一款針對工業應用最佳化的下一代獨立設備。
此外,無需配戴眼鏡的解決方案正在湧現,Distance Technologies公司已籌集1,000萬歐元(約1,173萬美元),旨在將車輛車窗改造為動態混合實境畫布。雖然智慧型手機連接的手持設備在現場維護領域仍然很常見,但抬頭顯示器正在飛機和汽車駕駛座中佔據一席之地。從長遠來看,像XPANCEO的原型機這樣的智慧隱形眼鏡可能會將擴增實境(XR)市場推向「隱形穿戴裝置」的領域。
區域分析
在北美,由於醫療、航太和國防領域的採購持續成長,XR技術的部署量也不斷增加。 Infinite Reality公司完成了新資金籌措,並以4.5億美元收購了Landvault公司,這進一步增強了投資者對空間運算平台的樂觀情緒。國防創新部門(DIU)已向空軍基地部署了225套身臨其境型訓練系統,進一步鞏固了XR技術在企業中的應用。隨著模擬器的逼真度逐漸接近實際駕駛座的標準,航空領域對替代認證的監管支援也推動了設備訂單的成長。
亞太地區正經歷最快的成長。光是在中國,2024年就推出了超過100個VR計畫。在韓國,三星正利用其覆蓋全國幾乎全境的5G網路,為「Project Moohan」的發布做準備。在印度,一家與Meta和HCLTech合作的公私合營培養箱正在培育基層應用開發。龐大的製造地為持續的價值驗證(PoV)試點計畫提供了支持,亞太地區在硬體大規模生產經濟中扮演著至關重要的角色。歐洲正將自身打造成為負責任創新的中心。 Distance Technologies獲得的1000萬歐元(1,173萬美元)種子輪資金籌措顯示了市場對汽車級混合實境(MR)顯示器的巨大需求。BASF、西門子和SONY正在合作開發符合嚴格CE安全標準的頭戴式設備。歐盟的隱私法規正在重塑資料處理架構,促使全球供應商建構符合GDPR的分析模組。
其他好處:
- Excel格式的市場預測(ME)表
- 3個月的分析師支持
目錄
第1章:引言
- 研究假設和市場定義
- 調查範圍
第2章:調查方法
第3章執行摘要
第4章 市場狀況
- 市場概覽
- 市場促進因素
- 擴大 5G 覆蓋範圍和邊緣運算的協同效應。
- XR技術與數位孿生和工業4.0框架的融合正在逐步推進。
- 企業對身臨其境型遠距培訓的需求日益成長
- 將空間感測器整合到消費級智慧型手機中
- 政府為與元宇宙相關的土地提供資金
- 採用開放的XR標準可以減少廠商鎖定。
- 市場限制因素
- 高傳真光學元件和處理器的初始成本很高
- 使用者暈動症和人體工學限制
- 眼動追蹤與手部偵測分析中的資料隱私挑戰
- 內容創作工具的生態系支離破碎
- 供應鏈分析
- 監理情勢
- 技術展望
- 波特五力模型
- 對影響市場的宏觀經濟因素進行評估
第5章 市場規模與成長預測
- 報價
- 硬體
- 軟體
- 服務
- 依設備類型
- 頭戴式顯示器(有線和獨立式)
- 抬頭顯示器
- 手持和移動設備
- 其他
- 透過技術
- 虛擬實境(VR)
- 擴增實境(AR)
- 混合實境(MR)
- 按最終用戶行業分類
- 遊戲與娛樂
- 醫療保健和生命科學
- 工業和製造業
- 零售與電子商務
- 教育和培訓
- 航太/國防
- 建築、工程及施工
- 其他
- 按地區
- 北美洲
- 美國
- 加拿大
- 墨西哥
- 南美洲
- 巴西
- 阿根廷
- 其他南美國家
- 歐洲
- 英國
- 德國
- 法國
- 義大利
- 西班牙
- 其他歐洲國家
- 亞太地區
- 中國
- 日本
- 韓國
- 印度
- 澳洲
- 其他亞太國家
- 中東和非洲
- 中東
- 沙烏地阿拉伯
- 阿拉伯聯合大公國
- 土耳其
- 其他中東國家
- 非洲
- 南非
- 奈及利亞
- 埃及
- 其他非洲國家
- 中東
- 北美洲
第6章 競爭情勢
- 市場集中度
- 策略趨勢
- 市佔率分析
- 公司簡介
- Meta Platforms Inc.(Reality Labs)
- Sony Group Corp.
- Microsoft Corp.
- Apple Inc.
- HTC Corp.(Vive)
- Qualcomm Technologies Inc.
- Samsung Electronics Co. Ltd.
- Alphabet Inc.(Google XR)
- Pico Interactive Inc.(ByteDance)
- Varjo Technologies Oy
- Magic Leap Inc.
- Nvidia Corp.
- Unity Technologies Inc.
- Vuzix Corp.
- Lenovo Group Ltd.
- Snap Inc.
- Niantic Inc.
- Ultraleap Ltd.
- HP Inc.
- Immersion Corp.
第7章 市場機會與未來展望
According to Mordor Intelligence, extended reality market size in 2026 is estimated at USD 10.64 billion, growing from 2025 value of USD 7.55 billion with 2031 projections showing USD 59.18 billion, growing at 40.95% CAGR over 2026-2031.
This report is Segmented by Offering (Hardware, Software, Services), Device Type (Head-Mounted Displays (Tethered, Stand-Alone), Head-Up Displays and More), Technology (Virtual Reality (VR), Augmented Reality (AR), Mixed Reality (MR)), End User Industry (Gaming and Entertainment Healthcare and Life Sciences, and More). The Market Forecasts are Provided in Terms of Value (USD).
Global Extended Reality (XR) Market Trends and Insights
Expanding 5G Coverage and Edge Computing Synergy
Sub-20 ms latency now enables multi-user VR collaboration without tethered backpack PCs, as trials by Ericsson, AT&T, Dreamscape, and Qualcomm have shown. China Steel Corporation's 5G-enabled virtual factory tours integrate live data from 85 production nodes, proving value for heavy industry. DHL smart-glasses pilots illustrate logistics gains from real-time pick guidance. Device weight drops as compute moves to the network edge, boosting shift-length comfort. Telcos therefore place micro-data-centers within 50 km of users to sustain immersive throughput.
Increased Integration of XR into Digital Twin and Industry 4.0 Frameworks
Pegatron's PEGAVERSE builds five virtual factories on NVIDIA Omniverse for remote diagnostics and scenario testing, lowering downtime and travel. BASF's AR-enabled plant planning links sensor data with immersive visualization to streamline hazard identification. Siemens and Sony priced the SRH-S1 engineering headset at USD 4,750 to deliver pixel-accurate design collaboration. OpenUSD alignment lets disparate CAD, PLM, and IoT feeds merge into a single spatial layer. Platform vendors thus monetize subscription-based visualization rather than one-off license fees.
High Upfront Costs of High-Fidelity Optics and Processors
Gallium and germanium shortages have inflated optics prices by up to 25%. Meta's Reality Labs has accumulated USD 60 billion losses since 2020 while selling USD 1.1 billion in Q4 2024 XR hardware, underscoring profitability challenges. Smaller firms hesitate without capital or clear ROI. Cloud-rendered XR lightens devices yet introduces latency trade-offs that limit usage to well-served 5G zones.
Other drivers and restraints analyzed in the detailed report include:
- Rising Enterprise Demand for Immersive Remote Training
- Mass-Market Smartphone Integration of Spatial Sensors
- User Motion-Sickness and Ergonomic Limitations
For complete list of drivers and restraints, kindly check the Table Of Contents.
Segment Analysis
Hardware controlled 53.2% of revenue in 2024, yet Services is set to grow fastest at 42.5% CAGR. Subscription bundles that combine devices, software, and managed support convert capex into opex, a structure favored by finance departments. The shift drives predictable recurring income for suppliers and lowers barrier-to-entry for customers. Meta's platform pivot illustrates this movement, exploring enterprise-grade subscriptions alongside hardware refreshes.
Managed training and simulation services command premium rates thanks to specialized content needs. Vertex Solutions alone shipped more than 500 military-grade simulators worldwide, highlighting vertical expertise. As these contracts often span multi-year periods, vendors capture higher lifetime value. Hardware makers therefore partner with integrators rather than compete head-on, reflecting a maturing services-led Extended Reality market.
Head-Mounted Displays captured 42.7% revenue in 2024 but growth now shifts to Spatial and Holographic Displays, which head toward a 43.1% CAGR. Shared viewing walls overcome hygiene and comfort limits found in personal headsets, supporting collaborative engineering reviews and customer demonstrations. Samsung's Project Moohan exemplifies next-generation standalone units optimized for industrial deployment.
Glasses-free solutions also emerge, with Distance Technologies raising EUR 10 million (USD 11.73 million) to transform vehicle windows into dynamic mixed-reality canvases. Smartphone-tethered handheld devices remain common in field maintenance, while head-up displays secure niche positions in aviation and automotive cockpits. Longer term, smart contact lenses such as XPANCEO's prototype could push the Extended Reality market into invisible wearables.
Complete Report Scope:
- By Offering
- Hardware
- Software
- Services
- By Device Type
- Head-Mounted Displays (Tethered, Stand-alone)
- Head-Up Displays
- Handheld and Mobile Devices
- Others
- By Technology
- Virtual Reality (VR)
- Augmented Reality (AR)
- Mixed Reality (MR)
- By End-user Industry
- Gaming and Entertainment
- Healthcare and Life Sciences
- Industrial and Manufacturing
- Retail and E-commerce
- Education and Training
- Aerospace and Defense
- Architecture, Engineering and Construction
- Others
- By Geography
- North America
- United States
- Canada
- Mexico
- South America
- Brazil
- Argentina
- Rest of South America
- Europe
- United Kingdom
- Germany
- France
- Italy
- Spain
- Rest of Europe
- Asia-Pacific
- China
- Japan
- South Korea
- India
- Australia
- Rest of Asia-Pacific
- Middle East and Africa
- Middle East
- Saudi Arabia
- United Arab Emirates
- Turkey
- Rest of Middle East
- Africa
- South Africa
- Nigeria
- Egypt
- Rest of Africa
- Middle East
- North America
Geography Analysis
North America's installed base expands through steady healthcare, aerospace, and defense procurement. Infinite Reality closed USD 350 million in new capital and bought Landvault for USD 450 million, underscoring investor optimism in spatial computing platforms. The US Defense Innovation Unit fielded 225 immersive trainers across Air Force sites, further entrenching enterprise XR usage. Regulatory support for alternative certification in aviation spurs equipment orders as simulator fidelity approaches physical cockpit standards.
Asia-Pacific scales fastest. China alone launched more than 100 VR projects in 2024. South Korea readies Samsung's Project Moohan release, leveraging the country's near-universal 5G coverage. India's public-private incubator with Meta and HCLTech cultivates grassroots application developers. Wide manufacturing bases feed continuous proof-of-value pilots, making APAC pivotal to hardware volume economics. Europe positions itself as the responsible innovation hub. Distance Technologies' EUR 10 million (USD 11.73 million) seed illustrates appetite for automotive-grade mixed-reality surfaces. BASF, Siemens, and Sony collaborate on engineering headsets that comply with strict CE safety norms. The EU's privacy regime shapes data-handling architectures, influencing global vendors to build GDPR-ready analytics modules.
- Meta Platforms Inc. (Reality Labs)
- Sony Group Corp.
- Microsoft Corp.
- Apple Inc.
- HTC Corp. (Vive)
- Qualcomm Technologies Inc.
- Samsung Electronics Co. Ltd.
- Alphabet Inc. (Google XR)
- Pico Interactive Inc. (ByteDance)
- Varjo Technologies Oy
- Magic Leap Inc.
- Nvidia Corp.
- Unity Technologies Inc.
- Vuzix Corp.
- Lenovo Group Ltd.
- Snap Inc.
- Niantic Inc.
- Ultraleap Ltd.
- HP Inc.
- Immersion Corp.
Additional Benefits:
- The market estimate (ME) sheet in Excel format
- 3 months of analyst support
TABLE OF CONTENTS
1 INTRODUCTION
- 1.1 Study Assumptions and Market Definition
- 1.2 Scope of the Study
2 RESEARCH METHODOLOGY
3 EXECUTIVE SUMMARY
4 MARKET LANDSCAPE
- 4.1 Market Overview
- 4.2 Market Drivers
- 4.2.1 Expanding 5G coverage and edge computing synergy
- 4.2.2 Increased integration of XR into digital twin and Industry 4.0 frameworks
- 4.2.3 Rising enterprise demand for immersive remote-training
- 4.2.4 Mass-market smartphone integration of spatial sensors
- 4.2.5 Government funding for metaverse-related Rand
- 4.2.6 Adoption of open XR standards lowering vendor lock-in
- 4.3 Market Restraints
- 4.3.1 High upfront costs of high-fidelity optics and processors
- 4.3.2 User motion-sickness and ergonomic limitations
- 4.3.3 Data-privacy gaps in eye- and hand-tracking analytics
- 4.3.4 Fragmented content-authoring tool ecosystem
- 4.4 Supply-Chain Analysis
- 4.5 Regulatory Landscape
- 4.6 Technological Outlook
- 4.7 Porter's Five Forces
- 4.7.1 Bargaining Power of Suppliers
- 4.7.2 Bargaining Power of Consumers
- 4.7.3 Threat of New Entrants
- 4.7.4 Threat of Substitutes
- 4.7.5 Intensity of Competitive Rivalry
- 4.8 Assesment of Macroeconomic Factors on the market
5 MARKET SIZE AND GROWTH FORECASTS (VALUE)
- 5.1 By Offering
- 5.1.1 Hardware
- 5.1.2 Software
- 5.1.3 Services
- 5.2 By Device Type
- 5.2.1 Head-Mounted Displays (Tethered, Stand-alone)
- 5.2.2 Head-Up Displays
- 5.2.3 Handheld and Mobile Devices
- 5.2.4 Others
- 5.3 By Technology
- 5.3.1 Virtual Reality (VR)
- 5.3.2 Augmented Reality (AR)
- 5.3.3 Mixed Reality (MR)
- 5.4 By End-user Industry
- 5.4.1 Gaming and Entertainment
- 5.4.2 Healthcare and Life Sciences
- 5.4.3 Industrial and Manufacturing
- 5.4.4 Retail and E-commerce
- 5.4.5 Education and Training
- 5.4.6 Aerospace and Defense
- 5.4.7 Architecture, Engineering and Construction
- 5.4.8 Others
- 5.5 By Geography
- 5.5.1 North America
- 5.5.1.1 United States
- 5.5.1.2 Canada
- 5.5.1.3 Mexico
- 5.5.2 South America
- 5.5.2.1 Brazil
- 5.5.2.2 Argentina
- 5.5.2.3 Rest of South America
- 5.5.3 Europe
- 5.5.3.1 United Kingdom
- 5.5.3.2 Germany
- 5.5.3.3 France
- 5.5.3.4 Italy
- 5.5.3.5 Spain
- 5.5.3.6 Rest of Europe
- 5.5.4 Asia-Pacific
- 5.5.4.1 China
- 5.5.4.2 Japan
- 5.5.4.3 South Korea
- 5.5.4.4 India
- 5.5.4.5 Australia
- 5.5.4.6 Rest of Asia-Pacific
- 5.5.5 Middle East and Africa
- 5.5.5.1 Middle East
- 5.5.5.1.1 Saudi Arabia
- 5.5.5.1.2 United Arab Emirates
- 5.5.5.1.3 Turkey
- 5.5.5.1.4 Rest of Middle East
- 5.5.5.2 Africa
- 5.5.5.2.1 South Africa
- 5.5.5.2.2 Nigeria
- 5.5.5.2.3 Egypt
- 5.5.5.2.4 Rest of Africa
- 5.5.5.1 Middle East
- 5.5.1 North America
6 COMPETITIVE LANDSCAPE
- 6.1 Market Concentration
- 6.2 Strategic Moves
- 6.3 Market Share Analysis
- 6.4 Company Profiles (includes Global level Overview, Market level overview, Core Segments, Financials as available, Strategic Information, Market Rank/Share for key companies, Products and Services, and Recent Developments)
- 6.4.1 Meta Platforms Inc. (Reality Labs)
- 6.4.2 Sony Group Corp.
- 6.4.3 Microsoft Corp.
- 6.4.4 Apple Inc.
- 6.4.5 HTC Corp. (Vive)
- 6.4.6 Qualcomm Technologies Inc.
- 6.4.7 Samsung Electronics Co. Ltd.
- 6.4.8 Alphabet Inc. (Google XR)
- 6.4.9 Pico Interactive Inc. (ByteDance)
- 6.4.10 Varjo Technologies Oy
- 6.4.11 Magic Leap Inc.
- 6.4.12 Nvidia Corp.
- 6.4.13 Unity Technologies Inc.
- 6.4.14 Vuzix Corp.
- 6.4.15 Lenovo Group Ltd.
- 6.4.16 Snap Inc.
- 6.4.17 Niantic Inc.
- 6.4.18 Ultraleap Ltd.
- 6.4.19 HP Inc.
- 6.4.20 Immersion Corp.
7 MARKET OPPORTUNITIES AND FUTURE OUTLOOK
- 7.1 White-space and Unmet-Need Assessment

 延展實境(XR) 市場研究服務延展實境(XR)技術研究服務
 教育領域虛擬實境 (VR) 和擴增實境(AR) 市場預測(至 2034 年)—按技術、組件、部署模式、設備類型、應用、最終用戶和地區分類的全球分析
 全球擴增實境(XR硬體)市場—市場展望
 擴增實境(XR)顯示市場-2026-2032年全球市場預測延展實境(XR)市場-2026-2032年全球市場預測
 延展實境市場-全球產業規模、佔有率、趨勢、機會和預測:按組件、類型、產品模式、最終用戶、應用、地區和競爭格局分類,2021-2031年
 2026年全球擴增實境(XR)內容低程式碼建構器市場報告XR(延展實境)硬體的演進
 醫療保健領域擴增實境(XR)市場規模、佔有率和成長分析:按技術類型、組件、應用、最終用戶、銷售管道和地區分類-2026年至2033年產業預測