


 |
市場調查報告書
商品編碼
2122928
基油:市場佔有率分析、產業趨勢與統計、成長預測(2026-2031)Base Oil - Market Share Analysis, Industry Trends & Statistics, Growth Forecasts (2026 - 2031) |
||||||

※ 本網頁內容可能與最新版本有所差異。詳細情況請與我們聯繫。
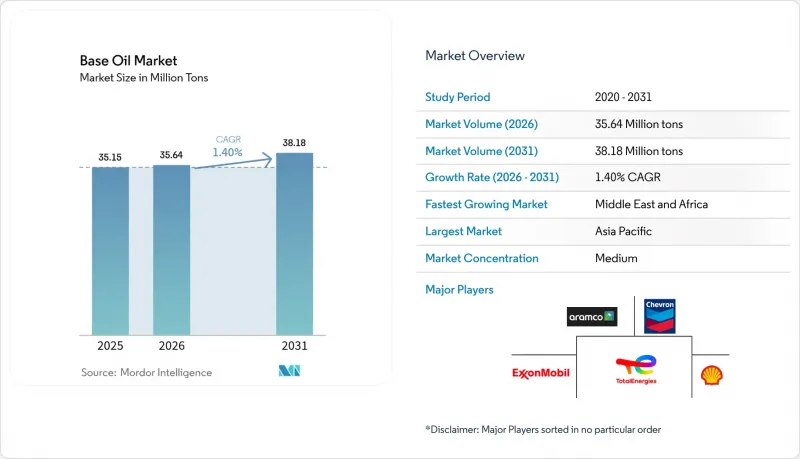
根據 Mordor Intelligence 預測,基礎油市場規模將從 2025 年的 3,515 萬噸成長到 2026 年的 3,564 萬噸,到 2031 年將達到 3,818 萬噸,2026 年至 2031 年的複合年成長率為 1.40%。
本報告按基礎油類型(I類、II類、III類、IV類及其他)、應用領域(引擎油、變速箱油和齒輪油、金屬加工液、液壓油、潤滑脂及其他應用)和地區(亞太地區、北美地區、歐洲地區、南美地區以及中東和非洲地區)進行細分。市場預測以銷售量(百萬噸)為單位。
全球基礎油市場趨勢與洞察
亞太地區生產基地的快速工業化
亞太地區製造業的快速成長支撐了基油市場需求的顯著成長。預計到2024年,中國原油日煉量將達到1,480萬桶,將帶動金屬加工液和液壓油的強勁需求。不斷擴展的綜合煉油廠和石化聯合體網路提高了營運柔軟性,使生產商能夠將生產轉向盈利最高的基油日產量將達到200萬桶,併計劃在其生物煉油廠於2028年運作後,加快進軍下游特種化學品領域的步伐。這些投資將鞏固該地區在基油市場的主導地位,並加速現有I類基礎油產能的更新換代。
更嚴格的歐7和國七排放氣體標準將提振對III/IV類柴油的需求。
歐盟7排放標準的實施強制要求輕型車輛的所有汽油引擎配備柴油顆粒過濾器(DPF),從而增加了對超低揮發性III類基礎油的需求。同時,中國的「中國VII」框架進一步推動了對低SAPS潤滑油的需求。此外,2022年至2026年間獲批的44個煉油工程預計將加強本地供應鏈。將於2025年3月31日生效的ILSAC GF-7標準要求燃油效率提高10%,並鼓勵調和商使用高品質基礎油[ORONITE.COM]。這導致資本集中在加氫裂解和加氫異構化設備,加速了基礎油市場的優質化。
布蘭特原油和杜拜原油之間價格差異的劇烈波動給利潤率帶來了壓力。
2024年,布蘭特原油與杜拜原油的價差一度轉為負值,顯示中硫原油供應供不應求,而中硫原油是生產VGO(真空減壓瓦斯油)的基礎油。科威特、阿曼和奈及利亞新煉油廠的運作提高了全球煉油產能,擠壓了利潤空間,一些營運商,例如利安德巴塞爾休士頓公司,被迫在2025年初退出煉油業務。這種緊張的局面迫使基礎油市場的獨立營運商降低運轉率或關閉老舊設備。
細分市場分析
第二類基礎油憑藉其優異的性能和成本平衡以及完善的分銷網路,保持了主導地位,預計到2025年將佔據42.20%的基礎油市場佔有率。殼牌在韋瑟林(Wessering)改造30萬噸基礎油,凸顯了對加氫裂解產品的持續信心。儘管第三類基礎油的絕對規模較小,但預計到2031年,其複合年成長率將達到4.05%,這主要得益於歐7排放標準以及電動車冷卻液法規對超低揮發性和高氧化穩定性的要求。因此,預計在預測期內,第三類基礎油的市場規模成長速度將超過其他任何等級的基礎油。
第一類基礎油在某些需要溶解性的橡膠和金屬加工液領域仍有需求,但由於經濟狀況惡化,生產基地持續關閉。第五類基礎油憑藉其多樣化的化學成分,包括用於生物潤滑劑的仲多元醇酯,為創新路徑提供了補充。整體而言,基礎油市場正朝著更高API等級的方向發展,以滿足更嚴格的OEM規格和永續性目標。
區域分析
預計到2025年,亞太地區將佔全球供應量的46.30%。這主要得益於中國原油日加工量創歷史新高,達到1,480萬桶,以及印度計畫於2025年前完成的19萬至22萬千升原油加工能力擴建工程。基礎油市場正受益於垂直一體化的綜合設施,這些設施可以根據利潤情況在燃料、化學產品和基礎油之間靈活切換生產。日本和韓國正在為電子產品的溫度控管提供精密合成技術,而東南亞國家則在擴大產能以滿足區域工業需求。
預計到2031年,中東和非洲地區的複合年成長率將達到3.33%,成為全球成長最快的地區。阿布達比國家石油公司(ADNOC)投資35億美元的「盧瓦伊斯原油靈活化計畫」將能夠加工高硫重質原油,最佳化II類和III類原油的生產。在歐洲,該地區正面臨利潤率下降和脫碳的挑戰,例如道達爾能源計畫在2026年前將格蘭普伊油田改造為非原油加工平台。
北美正投資於特種石油煉製裝置(PAO)和第三類項目,頁岩油的經濟可行性為其提供了支撐。雪佛龍帕薩迪納煉油廠的升級改造將使其加工能力提升至每日12.5萬桶,並提高噴射機燃料生產的柔軟性。在南美,由於巴西石化產業的整合,預計會有適度的成長,但宏觀經濟波動阻礙了大規模投資。整體而言,區域趨勢反映出產能正逐步向原油供應充足、需求強勁的地區擴散,而傳統中心則透過專業轉型進行調整。
其他好處:
- Excel格式的市場預測(ME)表
- 3個月的分析師支持
目錄
第1章:引言
- 研究假設和市場定義
- 調查範圍
第2章:調查方法
第3章執行摘要
第4章 市場狀況
- 市場概覽
- 市場促進因素
- 亞太地區生產基地的快速工業化
- 更嚴格的歐7和國七排放氣體標準正在推動對III/IV類車輛的需求。
- 電動汽車溫度控管系統對高性能潤滑劑的需求日益成長。
- 資料中心浸沒式冷卻劑的擴展(新型合成基礎油)
- 基於循環經濟要求的閉合迴路再淨化項目的經濟可行性。
- 市場限制因素
- 第一集團的產能正迅速替換。
- 布蘭特原油和杜拜原油價格差的波動給利潤率帶來了壓力。
- 歐盟(ECHA)即將把聚環氧乙烷(PAO)歸類為微塑膠。
- 價值鏈分析
- 波特五力模型
第5章 市場規模與成長預測
- 依基礎油類型
- 第一組
- 第二組
- 第三組
- 第四組
- 其他
- 透過使用
- 機油
- 變速箱油和齒輪油
- 金屬加工用潤滑液
- 油壓
- 潤滑脂
- 其他用途
- 按地區
- 亞太地區
- 中國
- 印度
- 日本
- 韓國
- 馬來西亞
- 印尼
- 越南
- 泰國
- 其他亞太國家
- 北美洲
- 美國
- 加拿大
- 墨西哥
- 歐洲
- 德國
- 英國
- 法國
- 義大利
- 西班牙
- 北歐國家
- 土耳其
- 俄羅斯
- 其他歐洲國家
- 南美洲
- 巴西
- 阿根廷
- 哥倫比亞
- 其他南美國家
- 中東和非洲
- 沙烏地阿拉伯
- 阿拉伯聯合大公國
- 卡達
- 埃及
- 南非
- 奈及利亞
- 其他中東和非洲國家
- 亞太地區
第6章 競爭情勢
- 市場集中度
- 策略趨勢
- 市佔率和排名分析
- 公司簡介
- ADNOC
- Chevron Corporation
- China Petrochemical Corporation(SINOPEC)
- CNOOC Limited
- Exxon Mobil Corporation
- Formosa Petrochemical Corporation
- Gazprom Neft PJSC
- GS Caltex Corporation
- Hindustan Petroleum Corporation Limited
- Indian Oil Corporation Ltd
- LUKOIL
- Nynas AB
- Petrobras
- PetroChina
- PETRONAS Lubricants International
- Philips 66 Company
- Repsol
- Saudi Arabian Oil Co.
- Sepahan Oil Company
- Shandong Qingyuan Group Co. Ltd.
- Shell plc
- SK Innovation Co. Ltd.
- TotalEnergies
第7章 市場機會與未來展望
According to Mordor Intelligence, the base oil market size is expected to grow from 35.15 million tons in 2025 to 35.64 million tons in 2026 and is forecast to reach 38.18 million tons by 2031 at 1.40% CAGR over 2026-2031.
This report is Segmented by Base-Stock Type (Group I, Group II, Group III, Group IV, and Others), Application (Engine Oils, Transmission and Gear Oils, Metalworking Fluids, Hydraulic Fluids, Greases, and Other Applications), and Geography ( Asia-Pacific, North America, Europe, South America, and Middle-East and Africa). The Market Forecasts are Provided in Terms of Volume (Million Tons).
Global Base Oil Market Trends and Insights
Rapid Industrialization Across APAC Production Clusters
Asia-Pacific's manufacturing boom underpins a significant share of incremental base oil market demand. China processed 14.8 million barrels per day of crude in 2024, creating robust pull for metal-working and hydraulic fluids. An expanding network of integrated refinery-petrochemical complexes increases operational flexibility, enabling producers to shift yields toward the most profitable base-stock grades. PETRONAS projects 2 million barrels of oil-equivalent output per day in its 2025-2027 outlook, with a downstream push into specialty chemicals supported by a biorefinery startup in 2028. These investments solidify the region's pre-eminence in the base oil market and accelerate the displacement of legacy Group I capacity.
Stricter Euro 7 and China VII Emission Norms Boosting Group III/IV Demand
The adoption of Euro 7 standards obliges automakers to fit particulate-filter systems across all light-duty gasoline engines, upping demand for ultra-low-volatility Group III stocks. China's parallel China VII framework intensifies the requirement for low-SAPS lubricants, while forty-four refining projects approved between 2022-2026 are poised to reinforce local supply. ILSAC GF-7, effective 31 March 2025, calls for a 10% fuel-economy gain, nudging blenders toward higher-quality base oils [ORONITE.COM]. Hydrocracking and hydro-isomerization units thus attract capital, accelerating the premiumization of the base oil market.
Volatile Brent-Dubai Crude Differentials Squeezing Margins
The Brent-Dubai spread turned negative at times in 2024, signaling scarce medium-sour barrels crucial for VGO-based base-oil feed. New Kuwait, Oman, and Nigeria refineries lifted global capacity, depressing margins and driving some operators, such as LyondellBasell Houston, to exit refining by early 2025. The crunch pressures independent players in the base oil market to trim runs or shutter older assets.
Other drivers and restraints analyzed in the detailed report include:
- Rising Demand for High-Performance Lubricants in EV Thermal-Management Systems
- Expansion of Data-Center Immersion-Cooling Fluids
- Impending Micro-Plastic Classification of PAOs in the EU
For complete list of drivers and restraints, kindly check the Table Of Contents.
Segment Analysis
Group II maintained leadership with 42.20% of the base oil market share in 2025, owing to its balanced performance-cost equation and established distribution networks. Shell's 300,000-ton conversion at Wesseling underscores sustained confidence in hydrocracked stocks. Group III, though smaller on an absolute basis, advances at a 4.05% CAGR to 2031, buoyed by Euro 7 and EV-cooling mandates that call for ultra-low volatility and high oxidation resistance. The base oil market size for Group III is thus poised to expand faster than any other grade during the forecast horizon.
Group I endures in select rubber-processing and metal-working fluids requiring solvency, yet closures continue as economics deteriorate. Group V's diverse chemistries, including secondary polyol esters for bio-lubricants, round out innovation pathways. Altogether, the base oil market is migrating toward higher API groups to meet stricter OEM specifications and sustainability goals.
Complete Report Scope:
- By Base-Stock Type
- Group I
- Group II
- Group III
- Group IV
- Others
- By Application
- Engine Oils
- Transmission and Gear Oils
- Metalworking Fluids
- Hydraulic Fluids
- Greases
- Other Applications
- By Geography
- Asia-Pacific
- China
- India
- Japan
- South Korea
- Malaysia
- Indonesia
- Vietnam
- Thailand
- Rest of Asia-Pacific
- North America
- United States
- Canada
- Mexico
- Europe
- Germany
- United Kingdom
- France
- Italy
- Spain
- Nordic Countries
- Turkey
- Russia
- Rest of Europe
- South America
- Brazil
- Argentina
- Colombia
- Rest of South America
- Middle-East and Africa
- Saudi Arabia
- United Arab Emirates
- Qatar
- Egypt
- South Africa
- Nigeria
- Rest of Middle-East and Africa
- Asia-Pacific
Geography Analysis
Asia-Pacific generated 46.30% of 2025 volume, underpinned by China's record 14.8 million barrels-per-day crude runs and India's INR 1.9-2.2 lakh crore expansion program slated for completion by 2025. The base oil market benefits from vertically integrated complexes able to toggle between fuels, chemicals, and base stocks as margins dictate. Japan and South Korea supply precision synthetic technology for electronics thermal management, while Southeast Asian nations add capacity to serve regional industrial demand.
The Middle East and Africa posts a 3.33% CAGR to 2031, the fastest globally. ADNOC's USD 3.5 billion Ruwais Crude Flexibility Project enables processing heavier sour crudes, optimizing Group II and III output. Europe contends with margin compression and decarbonization pivots such as TotalEnergies' Grandpuits conversion into a zero-crude platform by 2026.
North America, bolstered by shale-oil economics, invests in specialty PAO and Group III projects; Chevron's Pasadena upgrade lifts throughput to 125,000 barrels per day while raising jet-fuel flexibility. South America enjoys moderate upside from Brazil's petrochemical integration, although macro volatility dampens large-scale investments. Collectively, geographic dynamics reflect a gradual diffusion of capacity into crude-advantaged and demand-rich locales while traditional centers adapt through specialization.
- ADNOC
- Chevron Corporation
- China Petrochemical Corporation (SINOPEC)
- CNOOC Limited
- Exxon Mobil Corporation
- Formosa Petrochemical Corporation
- Gazprom Neft PJSC
- GS Caltex Corporation
- Hindustan Petroleum Corporation Limited
- Indian Oil Corporation Ltd
- LUKOIL
- Nynas AB
- Petrobras
- PetroChina
- PETRONAS Lubricants International
- Philips 66 Company
- Repsol
- Saudi Arabian Oil Co.
- Sepahan Oil Company
- Shandong Qingyuan Group Co. Ltd.
- Shell plc
- SK Innovation Co. Ltd.
- TotalEnergies
Additional Benefits:
- The market estimate (ME) sheet in Excel format
- 3 months of analyst support
TABLE OF CONTENTS
1 Introduction
- 1.1 Study Assumptions and Market Definition
- 1.2 Scope of the Study
2 Research Methodology
3 Executive Summary
4 Market Landscape
- 4.1 Market Overview
- 4.2 Market Drivers
- 4.2.1 Rapid industrialisation across APAC production clusters
- 4.2.2 Stricter Euro 7 and China VII emission norms boosting Group III/IV demand
- 4.2.3 Rising demand for high-performance lubricants in EV thermal-management systems
- 4.2.4 Expansion of data-centre immersion-cooling fluids (novel synthetic base-stocks)
- 4.2.5 Closed-loop re-refining economics under circular-economy mandates
- 4.3 Market Restraints
- 4.3.1 Rapid substitution away from Group I capacities
- 4.3.2 Volatile Brent-Dubai crude differentials squeezing margins
- 4.3.3 Impending micro-plastic classification of PAOs in the EU (ECHA)
- 4.4 Value Chain Analysis
- 4.5 Porter's Five Forces
- 4.5.1 Bargaining Power of Suppliers
- 4.5.2 Bargaining Power of Buyers
- 4.5.3 Threat of New Entrants
- 4.5.4 Threat of Substitutes
- 4.5.5 Degree of Competition
5 Market Size and Growth Forecasts (Volume)
- 5.1 By Base-Stock Type
- 5.1.1 Group I
- 5.1.2 Group II
- 5.1.3 Group III
- 5.1.4 Group IV
- 5.1.5 Others
- 5.2 By Application
- 5.2.1 Engine Oils
- 5.2.2 Transmission and Gear Oils
- 5.2.3 Metalworking Fluids
- 5.2.4 Hydraulic Fluids
- 5.2.5 Greases
- 5.2.6 Other Applications
- 5.3 By Geography
- 5.3.1 Asia-Pacific
- 5.3.1.1 China
- 5.3.1.2 India
- 5.3.1.3 Japan
- 5.3.1.4 South Korea
- 5.3.1.5 Malaysia
- 5.3.1.6 Indonesia
- 5.3.1.7 Vietnam
- 5.3.1.8 Thailand
- 5.3.1.9 Rest of Asia-Pacific
- 5.3.2 North America
- 5.3.2.1 United States
- 5.3.2.2 Canada
- 5.3.2.3 Mexico
- 5.3.3 Europe
- 5.3.3.1 Germany
- 5.3.3.2 United Kingdom
- 5.3.3.3 France
- 5.3.3.4 Italy
- 5.3.3.5 Spain
- 5.3.3.6 Nordic Countries
- 5.3.3.7 Turkey
- 5.3.3.8 Russia
- 5.3.3.9 Rest of Europe
- 5.3.4 South America
- 5.3.4.1 Brazil
- 5.3.4.2 Argentina
- 5.3.4.3 Colombia
- 5.3.4.4 Rest of South America
- 5.3.5 Middle-East and Africa
- 5.3.5.1 Saudi Arabia
- 5.3.5.2 United Arab Emirates
- 5.3.5.3 Qatar
- 5.3.5.4 Egypt
- 5.3.5.5 South Africa
- 5.3.5.6 Nigeria
- 5.3.5.7 Rest of Middle-East and Africa
- 5.3.1 Asia-Pacific
6 Competitive Landscape
- 6.1 Market Concentration
- 6.2 Strategic Moves
- 6.3 Market Share (%)/Ranking Analysis
- 6.4 Company Profiles (includes Global level Overview, Market level overview, Core Segments, Financials as available, Strategic Information, Market Rank/Share for key companies, Products and Services, and Recent Developments)
- 6.4.1 ADNOC
- 6.4.2 Chevron Corporation
- 6.4.3 China Petrochemical Corporation (SINOPEC)
- 6.4.4 CNOOC Limited
- 6.4.5 Exxon Mobil Corporation
- 6.4.6 Formosa Petrochemical Corporation
- 6.4.7 Gazprom Neft PJSC
- 6.4.8 GS Caltex Corporation
- 6.4.9 Hindustan Petroleum Corporation Limited
- 6.4.10 Indian Oil Corporation Ltd
- 6.4.11 LUKOIL
- 6.4.12 Nynas AB
- 6.4.13 Petrobras
- 6.4.14 PetroChina
- 6.4.15 PETRONAS Lubricants International
- 6.4.16 Philips 66 Company
- 6.4.17 Repsol
- 6.4.18 Saudi Arabian Oil Co.
- 6.4.19 Sepahan Oil Company
- 6.4.20 Shandong Qingyuan Group Co. Ltd.
- 6.4.21 Shell plc
- 6.4.22 SK Innovation Co. Ltd.
- 6.4.23 TotalEnergies
7 Market Opportunities and Future Outlook
- 7.1 White-space and Unmet-Need Assessment
- 7.2 Renewable/Bio-based PAO commercial scale-up
- 7.3 Integrated re-refining and virgin-base-oil hubs

 亞太地區基油:市場佔有率分析、產業趨勢與統計及成長預測(2026-2031)
 基油市場:2026-2032年全球市場預測(依產品等級、基油類型、應用類型、終端用戶產業及銷售管道)
 切削液市場規模、佔有率和成長分析:按流體技術化學分類、加工應用、終端用戶產業和地區分類-2026-2033年產業預測
 高性能工業潤滑油市場預測至2034年-按產品類型、基礎油、劑型、通路、應用、最終用戶和地區分類的全球分析再生基礎油:市場佔有率分析、產業趨勢與統計、成長預測(2026-2031)
 基礎油市場規模、佔有率、成長及全球產業分析:按類型、應用和地區的洞察,2026-2034年的預測
 基油市場分析及預測(至2035年):類型、產品、應用、技術、最終用戶、形態、材質類型、製程、設備
 基礎油市場報告:按類型、組別、應用和地區分類(2026-2034年)
 2026年全球基油市場報告
 全球基礎油市場按類別、應用和地區分類-預測(至2030年)