


 |
市場調查報告書
商品編碼
2122739
5G基礎設施:市場佔有率分析、產業趨勢與統計、成長預測(2026-2031年)5G Infrastructure - Market Share Analysis, Industry Trends & Statistics, Growth Forecasts (2026 - 2031) |
||||||

※ 本網頁內容可能與最新版本有所差異。詳細情況請與我們聯繫。
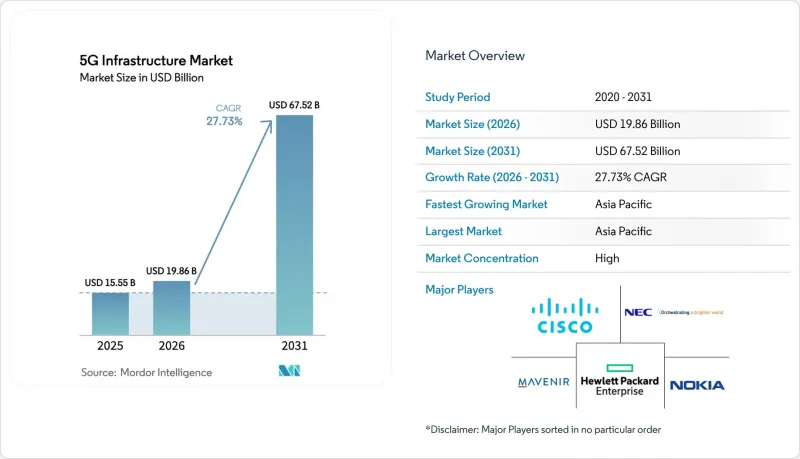
據 Mordor Intelligence 稱,5G 基礎設施市場預計到 2026 年價值將達到 198.6 億美元,高於 2025 年的 155.5 億美元,預計到 2031 年將達到 675.2 億美元。
預計從 2026 年到 2031 年,其複合年成長率將達到 27.73%。
本報告依通訊基礎設施(5G 無線接取網路、5G 核心網路、傳輸/XHaul [前傳、中傳、回程傳輸] 等)、頻段(低頻段、中頻段等)、網路架構(非獨立組網 [NSA] 等)、核心網路技術(軟體定義網路 [SDN] 等)、使用者產業(家用電子電器等)和地區進行分類。
全球5G基礎設施市場趨勢與洞察
M2M 和物聯網設備密度增加
獨立組網的5G網路允許每個行動通訊基地台處理多達5萬台連網設備,這對於工業4.0生產線和大規模感測器網路至關重要。現代汽車的RedCap工廠網路證明,即使使用功能有限的設備,也能在不影響網路覆蓋的前提下降低電力消耗。邊緣運算將運算資源部署在更靠近機器的位置,使其延遲保持在機器人和預測性維護方案所需的毫秒範圍內。汽車、醫療和重工業領域的專用網路展示凸顯了高設備密度環境(而非面向消費者的行動電話)帶來的更高收益潛力。這一因素支撐著整個預測期內對小型基地台和邊緣資料中心的持續投資。
行動數據消耗激增
隨著雲端遊戲、擴增實境(XR)影片和人工智慧驅動的串流媒體對穩定的多Gigabit連線提出更高要求,行動月流量持續創下新高。英國電信業者 Three UK 在預計到 2024 年底尖峰流量將超過 2 Tbit/s 後,已將其骨幹網路吞吐量提升至 9 Tbit/s。在中國,監管機構預測到 2030 年國內流量將成長四倍,營運商正轉向能夠在全天持續高負載下保持效率的容量架構。醫療領域的試點項目,例如即時遠端超音波演示,凸顯了上行鏈路容量對於關鍵任務影像傳輸的重要性。此外,印度和美國固定無線存取 (FWA) 的普及正在將流量從智慧型手機轉移到用戶端裝置 (CPE),迫使營運商重新設計回程傳輸,以適應「家庭優先」的影片觀看習慣。
高密度無線接取網路和高初始成本的光纖回程傳輸
小型基地台的成本在每個站點1萬至5萬美元之間,大型基地台的支出高達20萬美元,因此部署高密度5G網路需要大量資金,尤其是在毫米波至關重要的地區。光纖回程傳輸可能佔工程預算的30%,而郊區走廊缺乏鑽井空間導致溝槽挖掘進度延誤。 2023年,全球通訊業支出(CAPEX)自2017年以來首次下降,促使財務長們對加速部署持謹慎態度。網路共用協定可以降低高達40%的成本,但會削弱每個合作夥伴提供差異化高階服務的能力。每個業者超過10億美元的頻率許可費進一步加劇了資產負債表的壓力。
細分市場分析
隨著營運商部署高密度大型基地台和小型基地台網路,預計到2025年,無線接取網路(RAN)設備將佔據5G基礎設施市場最大的佔有率,收入佔比高達36.30%。儘管RAN的重要性將在這一輪硬體部署浪潮中得以維持,但核心網的成長速度將超過其他層,複合年成長率(CAGR)將達到31.10%,因為未來的獲利將依賴軟體定義控制。隨著獨立組網(SA)系統的部署需要引入能夠虛擬化用戶平面和控制平面功能的雙模封包核心網路,預計核心網平台的5G基礎設施市場規模將迅速擴張。沃達豐西班牙和英國Three的案例表明,雲端原生核心網路使營運商能夠開放用於邊緣運算、安全和按需品質(QoD)產品的API。
在本十年後半段,電信業者將把整合核心網路視為實現專用網路切片、低延遲工業服務和即時分析的驅動力。隨著覆蓋目標的實現,無線接取網路(RAN)的投資將會減少,但由於生命週期更新和功能新增,核心網路的支出將持續成長。隨著分散式單元需要將線速流量傳輸到資料中心核心網,傳輸和擴展傳輸(xHaul)的預算也將增加。因此,5G基礎設施市場將出現光纖通訊和路由供應商競相成為戰略合作夥伴而非戰術性合作夥伴的局面。
預計到2025年,頻寬將佔據5G基礎設施市場佔有率的45.20%。這是因為頻寬兼具遠距離傳播和數百兆赫茲頻寬,能夠支援大規模MIMO陣列。從芝加哥到柏林,電信業者都在採用3.5 GHz頻段的無線設備來覆蓋郊區環形區域,同時避免在基地台建設方面過度投資。同時,毫米波(mmWave)透過為支援固定無線存取(FWA)的家庭和活動場所提供服務,展現出最高的複合年成長率(CAGR),達到32.15%。預計這一趨勢將推動5G基礎設施市場的快速成長,尤其是在美國、日本和韓國,毫米波無線設備、中繼器以及用於高級波束成形的半導體設備的需求將顯著成長。
儘管低於 1 GHz 的低頻寬對於廣域物聯網覆蓋仍然至關重要,但它們難以達到Gigabit級通訊速度目標,只能發揮輔助作用而非主導作用。毫米波部署面臨視距限制和樹木訊號衰減等挑戰,但高增益天線和人工智慧驅動的波束控制技術正在逐步彌補這些不足。監管機構致力於在同一輪許可中分配中頻寬和高頻寬頻率,這使得營運商更容易根據不同的服務層級客製化頻段組合。
區域分析
到2025年,亞太地區將佔據5G基礎設施市場佔有率的23.80%。這主要得益於中國440萬個基地台的建設以及印度計劃在2027年前連接3000萬固定無線接入(FWA)用戶。隨著韓國持續推進5G網路覆蓋率達到97%,以及日本不斷提升郊區網路密度,預計該地區將以31.40%的複合年成長率成長。印尼、越南和菲律賓的農村地區計畫將採用基地台共用模式,而澳洲則正在推廣結合衛星和5G技術的混合備份系統,用於偏遠地區的採礦作業。
在北美,市場已趨於成熟,覆蓋超過80%的人口,在經歷了2023年的下滑之後,2025年投資再次回升。愛立信2024年第四季區域業務年增54%,顯示獨立核心網、邊緣網和企業級合約再次成為預算的主要驅動力。美國電信業者正將固定無線接入(FWA)和光纖捆綁銷售,以覆蓋服務不足的郊區;而在加拿大,新的中頻段頻率正在分配,以加快原住民社區的網路連接。
歐洲在獨立網路普及方面落後於其他國家,但監管協調的目標是到2030年帶來1,640億歐元的經濟效益。德國96%的覆蓋率清晰地展現了其政策一致性的成效,而英國則由於供應商禁令導致設備更換延遲,亟需提升網路效能。在拉丁美洲,已有29家電信業者推出商用服務並進入商業營運階段。隨著頻率使用費的下降以及雲端服務供應商對中立託管基地台的資金支持,預計到2030年,該地區的連線數將達到4.25億。
其他好處:
- Excel格式的市場預測(ME)表
- 3個月的分析師支持
目錄
第1章:引言
- 研究假設和市場定義
- 調查範圍
第2章:調查方法
第3章執行摘要
第4章 市場狀況
- 市場概覽
- 市場促進因素
- M2M和物聯網設備的普及率不斷提高。
- 行動數據使用量激增
- 政府主導的頻段競標正在加速中頻段的發展。
- 電信業者正將資本投資轉向雲端原生開放式無線存取網架構。
- 棕地工業區對專用5G的需求日益成長
- 在本地市場中,固定無線存取(FWA)可取代光纖。
- 市場限制因素
- 高密度無線接取網路和高初始部署成本是光纖回程傳輸的缺點。
- 網路切片貨幣化標準化進程的延遲
- 國家安全法規對中國供應商的限制
- 毫米波技術引進過程中熟練勞動力短缺的問題
- 價值鏈分析
- 監理情勢
- 技術展望
- 投資和資金籌措趨勢
- 波特五力分析
第5章 市場規模與成長預測
- 透過通訊基礎設施
- 5G無線接取網路(RAN)
- 運輸/跨貨運(前線、中線、回程傳輸)
- 核心網路(雲端原生 5GC)
- 按頻段
- 低頻寬(低於 1 GHz)
- 中頻段(1–6 GHz)
- 高頻段/毫米波(24 GHz 以上)
- 透過網路架構
- 非獨立式(NSA)
- 獨立版 (SA)
- 按類型分類的核心網路技術
- 軟體定義網路 (SDN)
- 網路功能虛擬化(NFV)
- 多接入邊緣運算(MEC)
- 網路切片
- 按最終用戶行業分類
- 家用電子產品
- 汽車與出行
- 工業製造
- 醫療保健和生命科學
- 能源公用事業
- 公共安全與國防
- 智慧城市和基礎設施
- 其他行業(零售業、媒體業、農業)
- 按地區
- 北美洲
- 美國
- 加拿大
- 南美洲
- 巴西
- 阿根廷
- 其他南美國家
- 歐洲
- 德國
- 英國
- 法國
- 義大利
- 西班牙
- 俄羅斯
- 其他歐洲國家
- 亞太地區
- 中國
- 日本
- 韓國
- 印度
- 澳洲
- 其他亞太國家
- 中東和非洲
- 中東
- 沙烏地阿拉伯
- 阿拉伯聯合大公國
- 土耳其
- 其他中東國家
- 非洲
- 南非
- 奈及利亞
- 其他非洲國家
- 中東
- 北美洲
第6章 競爭情勢
- 市場集中度
- 策略趨勢
- 市佔率分析
- 公司簡介
- Airspan Networks Inc.
- AT&T Inc.
- Casa Systems Inc.
- Cisco Systems Inc.
- CommScope Holding Company Inc.
- Corning Inc.
- Dell Technologies Inc.
- Telefonaktiebolaget LM Ericsson
- Fujitsu Limited
- Hewlett Packard Enterprise Development LP
- Huawei Technologies Co. Ltd.
- Intel Corporation
- Juniper Networks Inc.
- Mavenir Systems Inc.
- NEC Corporation
- Nokia Corporation
- Oracle Corporation
- Parallel Wireless Inc.
- Qualcomm Technologies Inc.
- Qucell Networks Co. Ltd.
- Rakuten Symphony Inc.
- Ribbon Communications Inc.
- Samsung Electronics Co. Ltd.
- Verizon Communications Inc.
- ZTE Corporation
第7章 市場機會與未來展望
According to Mordor Intelligence, 5G infrastructure market size in 2026 is estimated at USD 19.86 billion, growing from 2025 value of USD 15.55 billion with 2031 projections showing USD 67.52 billion, growing at 27.73% CAGR over 2026-2031.
This report is Segmented by Communication Infrastructure (5G Radio Access Networks, 5G Core Networks, Transport / XHaul [Front, Mid, Back-Haul], and More), Spectrum Band (Low-Band, Mid-Band, and More), Network Architecture (Non-Standalone [NSA] and More), Core Network Technology (Software-Defined Networking [SDN] and More), End-User Vertical (Consumer Electronics, and More), and Geography.
Global 5G Infrastructure Market Trends and Insights
Increasing Machine-to-Machine and IoT Device Density
Standalone 5G allows each cell site to handle as many as 50,000 connected devices, a prerequisite for Industry 4.0 production lines and massive sensor grids. Hyundai Motor's RedCap-enabled factory network proved that reduced-capability devices can lower power budgets without losing coverage. Edge computing is moving compute resources closer to machines, keeping latency within millisecond windows that robotics and predictive-maintenance schemes require. Private-network proofs in automotive, healthcare, and heavy industry validate the revenue upside that comes from device-dense environments rather than consumer handsets. This driver underpins sustained spending on small cells and edge data centers over the forecast window.
Surge in Mobile Data Consumption
Monthly mobile traffic continues to set new highs as cloud gaming, extended-reality video, and AI-enhanced streaming demand consistent multi-gigabit links. Three UK boosted backbone throughput to 9 Tbit/s after end-2024 peaks surpassed 2 Tbit/s. In China, regulators expect national traffic to quadruple by 2030, moving operators toward capacity architectures that remain efficient under day-long loads. Healthcare pilots, such as real-time tele-ultrasound demonstrations, underline the value of uplink capacity for mission-critical imagery. FWA uptake in India and the United States is also redirecting traffic from smartphones to CPE units, pushing carriers to redesign backhaul for home-first video habits.
High Upfront RAN Densification and Fiber Back-Haul Costs
Small-cell bills from USD 10,000 to USD 50,000 and macro-cell outlays that reach USD 200,000 per site make dense 5G footprints capital heavy, especially where mmWave is mandated. Fiber back-haul can add 30% to project budgets, and scarce digs in suburban corridors slow trenching schedules. Global telecom CAPEX dipped in 2023, the first drop since 2017, making CFOs cautious about accelerated rollouts. Network-sharing deals deliver up to 40% savings but reduce each partner's ability to market premium differentiation. Spectrum licence fees above USD 1 billion per operator further compress balance sheet headroom.
Other drivers and restraints analyzed in the detailed report include:
- Government Spectrum Auctions Accelerating Mid-Band Rollouts
- Telco Capex Pivot to Cloud-Native Open RAN Architectures
- Delayed Standardisation for Network-Slicing Monetisation
For complete list of drivers and restraints, kindly check the Table Of Contents.
Segment Analysis
RAN equipment generated the largest slice of the 5G infrastructure market, delivering 36.30% revenue in 2025 as carriers rolled out dense macro and small-cell grids. That initial hardware wave will keep RAN important, yet core networks outpace other layers with a 31.10% CAGR because software-defined control decides future monetisation. The 5G infrastructure market size for core platforms is set to increase sharply as standalone rollouts mandate dual-mode packet cores that virtualise user plane and control plane functions. Vodafone Spain and Three UK highlight how cloud-native cores let operators expose APIs for edge, security and quality-on-demand products
In the second half of the decade, operators view the converged core as the engine for private-network slices, low-latency industrial services, and real-time analytics. RAN spend will taper as coverage milestones are met, whereas lifecycle refresh and feature add-ons keep core invoices growing. Transport and xHaul budgets also rise because distributed units must feed line-rate traffic into data-centre cores. Consequently, the 5G infrastructure market will witness supplier jockeying where optical and routing vendors position themselves as strategic rather than tactical partners.
Mid-band commanded 45.20% of 5G infrastructure market share in 2025 because it blends propagation reach with multi-hundred-MHz bandwidth that supports massive MIMO arrays. Operators from Chicago to Berlin use 3.5 GHz radios to cover suburban rings without overspending on cells. mmWave, however, shows the fastest 32.15% CAGR by serving FWA households and event venues. This trajectory means the 5G infrastructure market size linked to mmWave radios, repeaters and advanced beamforming silicon will climb quickly, especially in the United States, Japan and South Korea.
Low-band below 1 GHz stays vital for wide-area IoT coverage but struggles with gigabit targets, keeping it a supplement, not a star. mmWave deployment faces line-of-sight and foliage loss, yet high-gain antennas and AI-aided beam steering are closing some gaps. Regulators that bundle mid-band and high-band blocks in the same licence round help carriers align the spectrum mix with differentiated service tiers.
Complete Report Scope:
- By Communication Infrastructure
- 5G Radio Access Network (RAN)
- Transport / xHaul (Front-, Mid-, Back-haul)
- Core Network (Cloud-native 5GC)
- By Spectrum Band
- Low-Band (less than 1 GHz)
- Mid-Band (1-6 GHz)
- High-Band / mmWave (above 24 GHz)
- By Network Architecture
- Non-Standalone (NSA)
- Standalone (SA)
- By Core Network Technology
- Software-Defined Networking (SDN)
- Network Function Virtualization (NFV)
- Multi-access Edge Computing (MEC)
- Network Slicing
- By End-user Vertical
- Consumer Electronics
- Automotive and Mobility
- Industrial Manufacturing
- Healthcare and Life Sciences
- Energy and Utilities
- Public Safety and Defense
- Smart Cities and Infrastructure
- Other Verticals (Retail, Media, Agriculture)
- By Geography
- North America
- United States
- Canada
- South America
- Brazil
- Argentina
- Rest of South America
- Europe
- Germany
- United Kingdom
- France
- Italy
- Spain
- Russia
- Rest of Europe
- APAC
- China
- Japan
- South Korea
- India
- Australia
- Rest of APAC
- Middle East and Africa
- Middle East
- Saudi Arabia
- United Arab Emirates
- Turkey
- Rest of Middle East
- Africa
- South Africa
- Nigeria
- Rest of Africa
- Middle East
- North America
Geography Analysis
Asia Pacific held 23.80% of 5G infrastructure market share in 2025, driven by China's 4.4 million base stations and India's race to connect 30 million FWA subscribers by 2027. The region will expand at a 31.40% CAGR as South Korea sustains 97% population coverage and Japan adds suburban densification. Rural programmes in Indonesia, Vietnam, and the Philippines will lean on shared-tower models, while Australia advances with hybrid satellite-5G back-ups for remote mining operations.
North America shows coverage maturity above 80% of people yet reinvigorated spending in 2025 after a 2023 dip. Ericsson logged 54% year-over-year regional growth in Q4 2024, signalling that standalone cores, edge zones, and large enterprise deals are moving budgets again. US carriers bundle FWA with fibre to capture underserved suburbs, and Canada allocates fresh mid-band spectrum to accelerate indigenous-community connectivity.
Europe trails on standalone penetration but targets a EUR 164 billion economic boost by 2030 from harmonised regulation. Germany's 96% coverage illustrates what cohesive awards achieve, whereas the United Kingdom must rebuild performance after vendor bans slowed equipment swaps. Latin America steps into commercial phase with 29 operators live; regional connections should reach 425 million by 2030 as spectrum fees fall and cloud players finance neutral-host towers.
- Airspan Networks Inc.
- AT&T Inc.
- Casa Systems Inc.
- Cisco Systems Inc.
- CommScope Holding Company Inc.
- Corning Inc.
- Dell Technologies Inc.
- Telefonaktiebolaget LM Ericsson
- Fujitsu Limited
- Hewlett Packard Enterprise Development LP
- Huawei Technologies Co. Ltd.
- Intel Corporation
- Juniper Networks Inc.
- Mavenir Systems Inc.
- NEC Corporation
- Nokia Corporation
- Oracle Corporation
- Parallel Wireless Inc.
- Qualcomm Technologies Inc.
- Qucell Networks Co. Ltd.
- Rakuten Symphony Inc.
- Ribbon Communications Inc.
- Samsung Electronics Co. Ltd.
- Verizon Communications Inc.
- ZTE Corporation
Additional Benefits:
- The market estimate (ME) sheet in Excel format
- 3 months of analyst support
TABLE OF CONTENTS
1 INTRODUCTION
- 1.1 Study Assumptions and Market Definition
- 1.2 Scope of the Study
2 RESEARCH METHODOLOGY
3 EXECUTIVE SUMMARY
4 MARKET LANDSCAPE
- 4.1 Market Overview
- 4.2 Market Drivers
- 4.2.1 Increasing machine-to-machine and IoT device density
- 4.2.2 Surge in mobile data consumption
- 4.2.3 Government spectrum auctions accelerating mid-band rollouts
- 4.2.4 Telco capex pivot to cloud-native open RAN architectures
- 4.2.5 Emerging demand for private 5G in brownfield industrial sites
- 4.2.6 Fixed-wireless access (FWA) substituting fiber in rural markets
- 4.3 Market Restraints
- 4.3.1 High upfront RAN densification and fiber back-haul costs
- 4.3.2 Delayed standardization for network-slicing monetization
- 4.3.3 National-security restrictions on Chinese vendors
- 4.3.4 Skilled-labor shortages for mmWave deployment
- 4.4 Value Chain Analysis
- 4.5 Regulatory Landscape
- 4.6 Technological Outlook
- 4.7 Investment and Funding Trends
- 4.8 Porter's Five Forces Analysis
- 4.8.1 Bargaining Power of Suppliers
- 4.8.2 Bargaining Power of Buyers
- 4.8.3 Threat of New Entrants
- 4.8.4 Intensity of Competitive Rivalry
- 4.8.5 Threat of Substitute Products
5 MARKET SIZE AND GROWTH FORECASTS (VALUE)
- 5.1 By Communication Infrastructure
- 5.1.1 5G Radio Access Network (RAN)
- 5.1.2 Transport / xHaul (Front-, Mid-, Back-haul)
- 5.1.3 Core Network (Cloud-native 5GC)
- 5.2 By Spectrum Band
- 5.2.1 Low-Band (less than 1 GHz)
- 5.2.2 Mid-Band (1-6 GHz)
- 5.2.3 High-Band / mmWave (above 24 GHz)
- 5.3 By Network Architecture
- 5.3.1 Non-Standalone (NSA)
- 5.3.2 Standalone (SA)
- 5.4 By Core Network Technology
- 5.4.1 Software-Defined Networking (SDN)
- 5.4.2 Network Function Virtualization (NFV)
- 5.4.3 Multi-access Edge Computing (MEC)
- 5.4.4 Network Slicing
- 5.5 By End-user Vertical
- 5.5.1 Consumer Electronics
- 5.5.2 Automotive and Mobility
- 5.5.3 Industrial Manufacturing
- 5.5.4 Healthcare and Life Sciences
- 5.5.5 Energy and Utilities
- 5.5.6 Public Safety and Defense
- 5.5.7 Smart Cities and Infrastructure
- 5.5.8 Other Verticals (Retail, Media, Agriculture)
- 5.6 By Geography
- 5.6.1 North America
- 5.6.1.1 United States
- 5.6.1.2 Canada
- 5.6.2 South America
- 5.6.2.1 Brazil
- 5.6.2.2 Argentina
- 5.6.2.3 Rest of South America
- 5.6.3 Europe
- 5.6.3.1 Germany
- 5.6.3.2 United Kingdom
- 5.6.3.3 France
- 5.6.3.4 Italy
- 5.6.3.5 Spain
- 5.6.3.6 Russia
- 5.6.3.7 Rest of Europe
- 5.6.4 APAC
- 5.6.4.1 China
- 5.6.4.2 Japan
- 5.6.4.3 South Korea
- 5.6.4.4 India
- 5.6.4.5 Australia
- 5.6.4.6 Rest of APAC
- 5.6.5 Middle East and Africa
- 5.6.5.1 Middle East
- 5.6.5.1.1 Saudi Arabia
- 5.6.5.1.2 United Arab Emirates
- 5.6.5.1.3 Turkey
- 5.6.5.1.4 Rest of Middle East
- 5.6.5.2 Africa
- 5.6.5.2.1 South Africa
- 5.6.5.2.2 Nigeria
- 5.6.5.2.3 Rest of Africa
- 5.6.5.1 Middle East
- 5.6.1 North America
6 COMPETITIVE LANDSCAPE
- 6.1 Market Concentration
- 6.2 Strategic Moves
- 6.3 Market Share Analysis
- 6.4 Company Profiles (includes Global level Overview, Market level overview, Core Segments, Financials as available, Strategic Information, Market Rank/Share for key companies, Products and Services, and Recent Developments)
- 6.4.1 Airspan Networks Inc.
- 6.4.2 AT&T Inc.
- 6.4.3 Casa Systems Inc.
- 6.4.4 Cisco Systems Inc.
- 6.4.5 CommScope Holding Company Inc.
- 6.4.6 Corning Inc.
- 6.4.7 Dell Technologies Inc.
- 6.4.8 Telefonaktiebolaget LM Ericsson
- 6.4.9 Fujitsu Limited
- 6.4.10 Hewlett Packard Enterprise Development LP
- 6.4.11 Huawei Technologies Co. Ltd.
- 6.4.12 Intel Corporation
- 6.4.13 Juniper Networks Inc.
- 6.4.14 Mavenir Systems Inc.
- 6.4.15 NEC Corporation
- 6.4.16 Nokia Corporation
- 6.4.17 Oracle Corporation
- 6.4.18 Parallel Wireless Inc.
- 6.4.19 Qualcomm Technologies Inc.
- 6.4.20 Qucell Networks Co. Ltd.
- 6.4.21 Rakuten Symphony Inc.
- 6.4.22 Ribbon Communications Inc.
- 6.4.23 Samsung Electronics Co. Ltd.
- 6.4.24 Verizon Communications Inc.
- 6.4.25 ZTE Corporation
7 MARKET OPPORTUNITIES AND FUTURE OUTLOOK
- 7.1 White-space and Unmet-need Assessment

 網路技術與市場追蹤器網路技術與市場追蹤概況:2026年第三季度
 全球5G基礎設施市場規模、佔有率、趨勢和成長分析報告(2026-2034年)
 5G基礎設施市場:按網路基礎設施、應用和區域分類
 中東5G基礎設施:市場佔有率分析、產業趨勢與統計及成長預測(2026-2031年)亞太地區5G基礎設施:市場佔有率分析、產業趨勢與統計及成長預測(2026-2031年)非洲5G基礎設施:市場佔有率分析、產業趨勢與統計及成長預測(2026-2031年)
 5G基礎設施市場:2026-2032年全球市場預測(按組件、網路架構、部署模型、應用、最終用戶和部署環境分類)
 NTN 連接市場預測—全球分析(按組件、軌道類型、頻段、平台、應用、最終用戶和地區分類)—2034 年5G基礎設施市場預測至2034年-全球組件、通訊基礎設施、網路技術、網路架構、類型、應用和區域分析