


 |
市場調查報告書
商品編碼
2122511
行動行銷:市場佔有率分析、產業趨勢與統計、成長預測(2026-2031)Mobile Marketing - Market Share Analysis, Industry Trends & Statistics, Growth Forecasts (2026 - 2031) |
||||||

※ 本網頁內容可能與最新版本有所差異。詳細情況請與我們聯繫。
根據 Mordor Intelligence 預測,行動行銷市場規模將從 2025 年的 259 億美元成長到 2026 年的 303 億美元,然後在 2031 年達到 663.1 億美元,2026 年至 2031 年的複合年成長率為 16.98%。
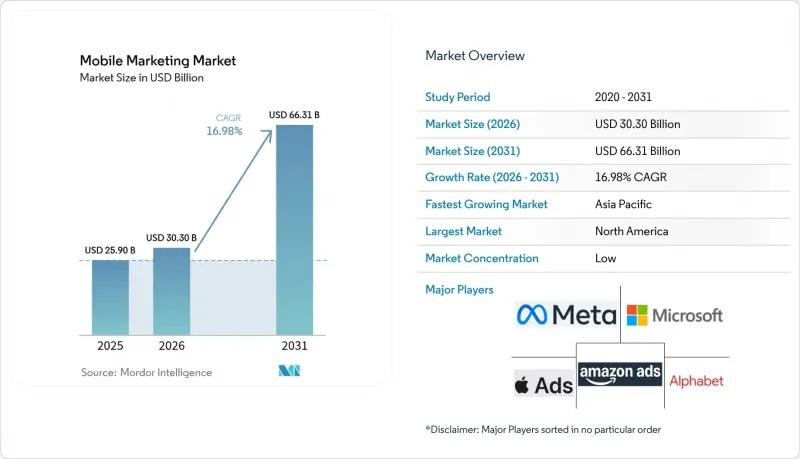
本報告按組件(平台、服務)、解決方案類型(行動網頁、簡訊、彩信等)、分銷管道(社交媒體行銷、聯盟行銷等)、企業規模(大型企業、中小企業)、部署模式(雲端、本地部署)、最終用戶行業(零售/電子商務、媒體/娛樂/OTT)和地區進行細分。市場預測以美元計價。
全球行動行銷市場趨勢與洞察
在北美,注重隱私的識別碼框架的採用正在提升應用程式內收入。
在美國,領先的出版商正見證著伺服器端事件收集和基於使用者授權的裝置代幣取代瀏覽器級 Cookie。採用這些框架的品牌報告稱,匹配率實現了兩位數的提升,並且能夠在滿足州級隱私監管要求的同時,實現更精細的受眾細分。同樣的機制還能自動產生合規報告,使財務部門能夠將增強的隱私保護措施作為技術投資。因此,行銷和風險管理部門可以基於通用指標進行協作,使廣告商即使在監管日益嚴格的情況下也能保持個人化的廣告策略。這些結果表明,合規的身份解析正在成為成長的加速器,而不僅僅是成本中心。
5G部署使亞洲都市區能夠實現超低延遲的宣傳活動。
目前,商用5G網路已覆蓋亞洲大部分主要城市,行動影片平均載入時間遠低於100毫秒。為此,行銷人員正在部署互動式擴增實境(AR)產品演示,使用戶能夠將產品虛擬放置在自己的環境中,然後一鍵完成付款。在2024年首爾舉辦的一場遊戲展覽會上,在網路邊緣進行的即時A/B測試顯示,與在4G環境下進行的相同創新相比,斷線率降低了近25%。這個例子表明,頻寬不僅僅是交付環境的改進,它更像是一塊“創新畫布”,能夠促進沉浸式故事的敘述。隨著5G部署的推進,行動行銷市場可望迎來更豐富的素材形式和更高的轉換效率。
無 cookie 應用程式的興起導致全球跨應用程式歸因分析出現混亂。
隨著第三方 Cookie 從主流瀏覽器中消失,跨裝置圖譜也隨之縮小,行銷人員被迫轉向機率測量和漸進式實驗。過去依賴用戶級報告的負責人現在開始利用基於提升度的儀錶板,專注於因果貢獻。雖然學習週期較長,但隨著機率訊號對隱私波動的適應能力增強,預算分配正逐步趨於穩定。效果負責人目前面臨短期摩擦,但這種轉變最終將建立更穩健的規劃流程,並保護行動行銷市場免受未來監管變化的影響。
細分市場分析
到2025年,平台軟體將佔總收入的66.20%,鞏固其作為行動行銷市場核心的地位。供應商正在整合低程式碼旅程建立器和隱私儀表板,使品牌團隊能夠在無需工程團隊支援的情況下近乎即時地測試規則。服務領域雖然規模仍然較小,但隨著企業尋求在無塵室實施、創新自動化和區域法規方面的指導,其成長速度正在加快。諮詢服務正將其重點從媒體套利轉向技術支持,從而開闢新的收入來源,並重新平衡整個價值鏈的價值創造。在整個預測期內,軟體升級將有助於提高客戶維繫,而服務合約將進一步增強客戶鎖定。
此外,技術服務在廣告商和發布商之間複雜的資料共用協議中扮演中介角色,促進了基於使用者授權的識別碼的順利實施。這種對技術和專業知識的雙重需求,使得混合型服務提供者能夠佔據更大的市場佔有率。因此,儘管軟體仍保持領先的市場佔有率,但與配置服務相關的行動行銷市場預計將以高於整體市場成長率的速度擴張。
智慧定位佔據行動行銷市場十幾個百分點的佔有率,年複合成長率高達 21.3%,預計到 2031 年將超越其他解決方案。這項增強型技術融合了 GPS、藍牙信標和店內 Wi-Fi,能夠以亞米級的精度定位消費者的位置。這些「原地」優惠在兌換率和購物車價值等指標上均優於傳統優惠券。QR碼作為連接貨架和螢幕的橋樑,再次受到關注。在 2025 年柏林的一項軟性飲料促銷活動中,瓶蓋下印有的序號引導消費者進入一款提供即時獎勵的手機遊戲。
推播通知憑藉其極高的開啟率仍然至關重要,但編配引擎現在會根據預期的用戶疲勞程度調整推播頻率,以防止用戶取消訂閱。隨著零售商將富媒體內容融入這些通知,基於位置的訊號能夠進一步最佳化推播時間,加深用戶互動,並提高單一用戶消費量。將地圖 API、分析工具和創新工具整合到單一介面中的供應商正在獲得競爭優勢,並在更廣泛的行動行銷市場中擴大市場佔有率。
區域分析
至2025年,北美將佔全球營收的37.60%,凸顯其作為廣告科技創新試驗場的地位。各州的隱私改革正在加速第一方資料項目的推進,從而提高匹配率並實現合規的身份圖譜。隨著2028年洛杉磯奧運會的臨近,面向賽事的定位平臺正在湧現,將門票銷售、特許經營攤位和贊助商訊息整合到統一的行動流程中。 2024年美式足球季後賽期間的一項試點項目表明,根據特許經營攤位的等待時間動態推送優惠信息,可以在不增加客流量的情況下提高人均消費額,展現出超越媒體價值的運營效益。隨著出版商加速整合注重隱私的識別系統,創投依然強勁,從而支撐著整個行動行銷市場的發展。
亞太地區預計將實現19.2%的複合年成長率,反映了5G速度提升、超級應用生態系統發展以及社交電商興起等因素的綜合影響。 2024年,東南亞一家主流超級應用內開展的化妝品宣傳活動,將擴增實境(AR)虛擬試妝功能與聊天內支付相結合,將購買流程縮短至60秒以內,並使銷售額成長了兩倍。在印度,在地化語音搜尋正在擴大覆蓋範圍,平台營運商正在為識字率較低的用戶群體推出語音廣告形式。這些創新表明,技術的普及程度不僅取決於技術成熟度,還很大程度上取決於文化習慣。智慧型手機的快速更換和低廉的資料通訊流量成本正在進一步推動行動行銷市場的發展。
嚴格的歐洲隱私法規限制了基於cookie的推廣範圍,但零售商正透過閉合迴路零售媒體網路實現會員忠誠度計畫的獲利,以此應對這項挑戰。 2025年,一家荷蘭連鎖超市推出了自助服務入口網站,供應商可以在此購買贊助商品圖塊,這些圖塊隨後會延伸至該連鎖超市的行動錢包,並在幾天內實現了端到端的歸因分析。儘管規模較小,但北歐國家的用戶行動參與度在歐洲最高,證明在贏得消費者信任的前提下,尊重隱私的個人化行銷也能取得成功。雖然監管方面的澄清可能會減緩短期成長,但它們有助於長期穩定,並支持全部區域行動行銷市場的穩定擴張。
其他好處:
- Excel格式的市場預測(ME)表
- 3個月的分析師支持
目錄
第1章:引言
- 研究假設和市場定義
- 調查範圍
第2章:調查方法
第3章執行摘要
第4章 市場狀況
- 市場概覽
- 市場促進因素
- 隱私保護標識符框架正在提高北美應用程式內行銷的投資報酬率。
- 5G 的部署將使亞洲各地能夠開展超低延遲的富媒體宣傳活動。
- 在南美洲的都市區,快速商務應用程式的激增正在推動推播通知的支出。
- 歐洲零售媒體網路正在強制要求與第一方行動數據供應商建立合作關係。
- 市場限制因素
- 無 cookie 應用程式的趨勢正在縮小跨應用程式歸因中的裝置圖譜。
- 營運商對簡訊防火牆的升級增加了非洲 A2P 流量的成本。
- 價值供應鏈分析
- 監管和技術展望
- 波特五力分析
- 產業價值鏈分析
- 新冠疫情對市場的影響
第5章 市場規模與成長預測
- 按組件
- 平台
- 服務
- 按解決方案類型
- 行動網頁
- 簡訊和彩信
- 基於位置的行銷/地理圍欄
- 應用程式內廣告和遊戲內廣告
- 推播通知與富媒體
- QR碼與近場行銷
- 新興技術(AR/VR、信標、5G邊緣運算)
- 透過分銷管道
- 社群媒體行銷
- 聯盟行銷
- 全通路/零售應用
- 內容行銷與網紅行銷
- 線上公共關係
- 電子郵件和簡訊宣傳活動
- 遊戲內/電子競技
- 按公司規模
- 大公司
- 中小企業
- 部署模式
- 雲
- 現場
- 按最終用戶行業分類
- 零售與電子商務
- 媒體娛樂/OTT
- BFSI
- 醫療保健和生命科學
- 旅遊、觀光和酒店
- 電訊
- 車
- 教育
- 其他(政府、公共產業)
- 按地區
- 北美洲
- 美國
- 加拿大
- 墨西哥
- 南美洲
- 巴西
- 阿根廷
- 其他南美國家
- 歐洲
- 德國
- 英國
- 法國
- 義大利
- 西班牙
- 其他歐洲國家
- 亞太地區
- 中國
- 日本
- 韓國
- 印度
- 其他亞太國家
- 中東和非洲
- 阿拉伯聯合大公國
- 沙烏地阿拉伯
- 南非
- 其他中東和非洲國家
- 北美洲
第6章 競爭情勢
- Strategic Developments
- Vendor Positioning Analysis
- 公司簡介
- Alphabet Inc.(Google)
- Meta Platforms Inc.
- Apple Inc.(Apple Advertising)
- Microsoft Corporation
- Amazon.com Inc.(Amazon Ads)
- Twitter/X Corp.
- Snap Inc.
- Pinterest Inc.
- Verizon Communications Inc.(Yahoo Advertising)
- ATandT Inc.
- InMobi Pte Ltd
- AppLovin Corporation
- GroundTruth
- Criteo SA
- Airship
- Adobe Inc.
- Oracle Corporation
- Salesforce Inc.
- Publicis Groupe(Phonevalley)
- AdColony Inc.
- MoPub(AppLovin Exchange)
第7章 市場機會與未來展望
According to Mordor Intelligence, the mobile marketing market size is expected to grow from USD 25.9 billion in 2025 to USD 30.3 billion in 2026 and is forecast to reach USD 66.31 billion by 2031 at 16.98% CAGR over 2026-2031.
This report is Segmented by Component (Platform, Services), Solution Type (Mobile Web, SMS and MMS, and More), Distribution Channel (Social Media Marketing, Affiliate Marketing, and More), by Enterprise Size (Large Enterprises, Smes), Deployment Mode (Cloud, On-Premises), by End-User Industry (Retail and E-Commerce, Media and Entertainment / OTT), Geography. The Market Forecasts are Provided in Terms of Value (USD).
Global Mobile Marketing Market Trends and Insights
Privacy-safe identifier frameworks lifting in-app returns in North America
Server-side event collection and consented device tokens are replacing browser-level cookies across major United States publishers. Brands embedding these frameworks report doubled-digit improvements in match rates, enabling richer segmentation while meeting state-level privacy mandates. The same mechanisms automate compliance reporting, allowing finance teams to capitalise on privacy upgrades as technology investments. Marketing and risk units, therefore, align on shared metrics, and advertisers can sustain personalised outreach even as regulations tighten. These gains validate that compliant identity resolution is becoming a growth accelerator rather than a cost centre.
5G roll-outs enabling ultra-low-latency campaigns across urban Asia
Commercial 5G networks now serve most tier-one Asian cities, pushing average mobile video load times well below 100 milliseconds. Marketers respond with interactive augmented-reality product demos that let users virtually place items in their environment before one-tap checkout. Live A/B switches executed at the network edge during a 2024 gaming convention in Seoul cut abandonment by nearly 25% versus identical creative on 4G. The experience reveals that bandwidth acts as a creative canvas, spurring immersive storytelling rather than functioning only as a distribution upgrade. As 5G densifies, the mobile marketing market will see richer asset formats and higher conversion efficiency.
Cookieless policies disrupt cross-app attribution worldwide
Third-party cookies are vanishing from mainstream browsers, shrinking cross-device graphs, and forcing marketers toward probabilistic measurement and incrementality experiments. Finance controllers who relied on user-level reports now train on lift-based dashboards focused on causal contribution. Learning cycles lengthen, yet budget allocations gradually stabilise because probabilistic signals tolerate privacy volatility. While performance marketers face near-term friction, the shift ultimately produces more resilient planning processes, cushioning the mobile marketing market against future regulatory swings.
Other drivers and restraints analyzed in the detailed report include:
- Quick-commerce boom drives specialised notification spend in South American capitals
- Retail media networks reshape European campaign supply chains
- Telco SMS firewall upgrades escalate A2P costs in Africa
For complete list of drivers and restraints, kindly check the Table Of Contents.
Segment Analysis
Platform software contributed 66.20% of 2025 revenue, affirming its status as the operating backbone of the mobile marketing market. Vendors embed low-code journey builders and privacy dashboards that let brand teams test rules in near real time without engineering support. Services lines, though smaller, are expanding faster as enterprises seek guidance on clean-room deployment, creative automation and regional regulations. Advisory practices pivot from media arbitrage to technical enablement, carving fresh fee pools and rebalancing value capture along the supply chain. Over the forecast horizon, software upgrades will sustain retention, while service engagements deepen customer lock-in.
Technical services also mediate complex data-sharing agreements between advertisers and publishers, smoothing the adoption of consented identifiers. This dual need for technology and expertise positions hybrid providers to harvest greater wallet share. As a result, the mobile marketing market size tied to component services is projected to outpace overall market growth, even as software retains lead share.
Location intelligence holds a mid-teen fraction of the mobile marketing market size and is poised for a 21.3% CAGR, eclipsing other solution clusters by 2031. Enhanced stacks blend GPS, Bluetooth beacons, and venue Wi-Fi, pinpointing shopper dwell zones with sub-metre accuracy. Moment-specific offers then outperform generic coupons on redemption and basket value metrics. QR codes re-emerge as bridge technology between shelf and screen; a 2025 soft-drink promotion in Berlin used under-cap serialised codes to funnel consumers into a mobile game with instant rewards.
Push alerts remain indispensable for their superior open rates, but orchestration engines throttle frequency against predicted fatigue to prevent opt-outs. As retailers embed rich media into these alerts, location signals further sharpen timing, deepening engagement, and raising spending per user. Providers that integrate mapping APIs, analytics, and creative tooling within one interface widen their moat and expand their share within the wider mobile marketing market.
Complete Report Scope:
- By Component
- Platform
- Services
- By Solution Type
- Mobile Web
- SMS and MMS
- Location-Based Marketing / Geofencing
- In-App and In-Game Advertising
- Push Notification and Rich Media
- QR-Code and Proximity Marketing
- Emerging (AR/VR, Beacons, 5G Edge)
- By Distribution Channel
- Social Media Marketing
- Affiliate Marketing
- Omni-Channel / Retail Apps
- Content and Influencer Marketing
- Online Public Relations
- Email and SMS Campaigns
- In-Game / Esports
- By Enterprise Size
- Large Enterprises
- Small and Medium Enterprises (SMEs)
- By Deployment Mode
- Cloud
- On-Premises
- By End-user Industry
- Retail and E-commerce
- Media and Entertainment / OTT
- BFSI
- Healthcare and Life Sciences
- Travel, Tourism and Hospitality
- Telecommunications
- Automotive
- Education
- Others (Government, Utilities)
- By Geography
- North America
- United States
- Canada
- Mexico
- South America
- Brazil
- Argentina
- Rest of South America
- Europe
- Germany
- United Kingdom
- France
- Italy
- Spain
- Rest of Europe
- Asia-Pacific
- China
- Japan
- South Korea
- India
- Rest of Asia-Pacific
- Middle East and Africa
- United Arab Emirates
- Saudi Arabia
- South Africa
- Rest of Middle East and Africa
- North America
Geography Analysis
North America generated 37.60% of 2025 revenue, underscoring its role as a test bed for ad-tech innovation. State privacy amendments accelerate first-party data programs, leading to higher match rates and compliant identity graphs. Event-grade location platforms emerge ahead of the 2028 Los Angeles Olympics, merging ticketing, concessions, and sponsor messaging into unified mobile flows. Trials during the 2024 football playoffs demonstrated that dynamic offers aligned with concession wait times raised per-capita spend without adding foot traffic, showing operational upside beyond media value. Venture investment remains steady as publishers race to integrate privacy-safe IDs, supporting the broader mobile marketing market.
Asia-Pacific is forecast to post a 19.2% CAGR, reflecting the compounding effect of 5G speed, super-app ecosystems, and social commerce norms. A 2024 cosmetics campaign inside a leading Southeast Asian super-app combined augmented-reality try-ons with in-chat checkout, shrinking purchase journeys to under 60 seconds and tripling unit sales. In India, vernacular voice search expands reach, prompting platform owners to launch speech-driven ad formats for low-literacy segments. These innovations confirm that adoption curves depend on cultural habits as much as technology readiness. Rapid smartphone replacement cycles and low data costs further expand the mobile marketing market.
Europe's stringent privacy statutes restrict cookie-based reach, but retailers counter by monetising loyalty programs through closed-loop retail media networks. A 2025 Dutch grocery chain launched a self-service portal where suppliers buy sponsored product tiles that extend into the chain's mobile wallet, enabling end-to-end attribution within days. Nordic countries, although smaller, record the continent's highest per-user mobile engagement, proving that privacy-respecting personalisation thrives when consumer trust is secured. Regulatory clarity dampens short-term growth yet fosters long-term stability, supporting steady expansion of the mobile marketing market across the region.
- Alphabet Inc. (Google)
- Meta Platforms Inc.
- Apple Inc. (Apple Advertising)
- Microsoft Corporation
- Amazon.com Inc. (Amazon Ads)
- Twitter/X Corp.
- Snap Inc.
- Pinterest Inc.
- Verizon Communications Inc. (Yahoo Advertising)
- ATandT Inc.
- InMobi Pte Ltd
- AppLovin Corporation
- GroundTruth
- Criteo S.A.
- Airship
- Adobe Inc.
- Oracle Corporation
- Salesforce Inc.
- Publicis Groupe (Phonevalley)
- AdColony Inc.
- MoPub (AppLovin Exchange)
Additional Benefits:
- The market estimate (ME) sheet in Excel format
- 3 months of analyst support
TABLE OF CONTENTS
1 INTRODUCTION
- 1.1 Study Assumptions and Market Definition
- 1.2 Scope of the Study
2 RESEARCH METHODOLOGY
3 EXECUTIVE SUMMARY
4 MARKET LANDSCAPE
- 4.1 Market Overview
- 4.2 Market Drivers
- 4.2.1 Privacy-safe Identifier Frameworks Boosting In-App Marketing ROI in North America
- 4.2.2 5G Roll-outs Enabling Ultra-Low-Latency Rich Media Campaigns Across Asia
- 4.2.3 Surge in Quick-Commerce Apps Fuelling Push Notification Spend in Urban South America
- 4.2.4 Retail Media Networks Mandating First-Party Mobile Data Partnerships in Europe
- 4.3 Market Restraints
- 4.3.1 Cookieless Policies Shrinking Device Graphs for Cross-App Attribution
- 4.3.2 Telco SMS Firewall Upgrades Escalating A2P Traffic Costs in Africa
- 4.4 Value / Supply-Chain Analysis
- 4.5 Regulatory or Technological Outlook
- 4.6 Porter's Five Forces Analysis
- 4.6.1 Threat of New Entrants
- 4.6.2 Bargaining Power of Buyers
- 4.6.3 Bargaining Power of Suppliers
- 4.6.4 Threat of Substitutes
- 4.6.5 Intensity of Competitive Rivalry
- 4.7 Industry Value-Chain Analysis
- 4.8 Impact of COVID-19 on the Market
5 MARKET SIZE AND GROWTH FORECASTS (VALUE)
- 5.1 By Component
- 5.1.1 Platform
- 5.1.2 Services
- 5.2 By Solution Type
- 5.2.1 Mobile Web
- 5.2.2 SMS and MMS
- 5.2.3 Location-Based Marketing / Geofencing
- 5.2.4 In-App and In-Game Advertising
- 5.2.5 Push Notification and Rich Media
- 5.2.6 QR-Code and Proximity Marketing
- 5.2.7 Emerging (AR/VR, Beacons, 5G Edge)
- 5.3 By Distribution Channel
- 5.3.1 Social Media Marketing
- 5.3.2 Affiliate Marketing
- 5.3.3 Omni-Channel / Retail Apps
- 5.3.4 Content and Influencer Marketing
- 5.3.5 Online Public Relations
- 5.3.6 Email and SMS Campaigns
- 5.3.7 In-Game / Esports
- 5.4 By Enterprise Size
- 5.4.1 Large Enterprises
- 5.4.2 Small and Medium Enterprises (SMEs)
- 5.5 By Deployment Mode
- 5.5.1 Cloud
- 5.5.2 On-Premises
- 5.6 By End-user Industry
- 5.6.1 Retail and E-commerce
- 5.6.2 Media and Entertainment / OTT
- 5.6.3 BFSI
- 5.6.4 Healthcare and Life Sciences
- 5.6.5 Travel, Tourism and Hospitality
- 5.6.6 Telecommunications
- 5.6.7 Automotive
- 5.6.8 Education
- 5.6.9 Others (Government, Utilities)
- 5.7 By Geography
- 5.7.1 North America
- 5.7.1.1 United States
- 5.7.1.2 Canada
- 5.7.1.3 Mexico
- 5.7.2 South America
- 5.7.2.1 Brazil
- 5.7.2.2 Argentina
- 5.7.2.3 Rest of South America
- 5.7.3 Europe
- 5.7.3.1 Germany
- 5.7.3.2 United Kingdom
- 5.7.3.3 France
- 5.7.3.4 Italy
- 5.7.3.5 Spain
- 5.7.3.6 Rest of Europe
- 5.7.4 Asia-Pacific
- 5.7.4.1 China
- 5.7.4.2 Japan
- 5.7.4.3 South Korea
- 5.7.4.4 India
- 5.7.4.5 Rest of Asia-Pacific
- 5.7.5 Middle East and Africa
- 5.7.5.1 United Arab Emirates
- 5.7.5.2 Saudi Arabia
- 5.7.5.3 South Africa
- 5.7.5.4 Rest of Middle East and Africa
- 5.7.1 North America
6 COMPETITIVE LANDSCAPE
- 6.1 Strategic Developments
- 6.2 Vendor Positioning Analysis
- 6.3 Company Profiles (includes Global level Overview, Market level overview, Core Segments, Financials as available, Strategic Information, Products and Services, and Recent Developments)
- 6.3.1 Alphabet Inc. (Google)
- 6.3.2 Meta Platforms Inc.
- 6.3.3 Apple Inc. (Apple Advertising)
- 6.3.4 Microsoft Corporation
- 6.3.5 Amazon.com Inc. (Amazon Ads)
- 6.3.6 Twitter/X Corp.
- 6.3.7 Snap Inc.
- 6.3.8 Pinterest Inc.
- 6.3.9 Verizon Communications Inc. (Yahoo Advertising)
- 6.3.10 ATandT Inc.
- 6.3.11 InMobi Pte Ltd
- 6.3.12 AppLovin Corporation
- 6.3.13 GroundTruth
- 6.3.14 Criteo S.A.
- 6.3.15 Airship
- 6.3.16 Adobe Inc.
- 6.3.17 Oracle Corporation
- 6.3.18 Salesforce Inc.
- 6.3.19 Publicis Groupe (Phonevalley)
- 6.3.20 AdColony Inc.
- 6.3.21 MoPub (AppLovin Exchange)
7 MARKET OPPORTUNITIES AND FUTURE OUTLOOK
- 7.1 White-space and Unmet-Need Assessment

 行動行銷市場:全球市場預測,2026-2032年
 行動互動市場規模、佔有率和成長分析:按組件、部署模式、組織規模、通路、應用、最終用戶和地區分類-2026-2033年產業預測
 行動行銷市場規模、佔有率和成長分析:按組件、行銷管道、部署類型、組織規模、應用、最終用戶產業和地區分類-2026-2033年產業預測行動互動市場:按裝置類型、作業系統、網路類型、應用程式使用行為和購買管道分類 - 全球預測(2026-2032 年)
 2026年全球行動互動市場報告2026年全球QR碼行動行銷市場報告
 全球行動行銷市場規模、佔有率、趨勢和成長分析報告(2026-2034)
 行動行銷市場-全球產業規模、佔有率、趨勢、機會和預測,按組件、通路、組織規模、垂直產業、地區和競爭格局分類,2021-2031年預測
 防機器人撥號及品牌呼叫市場:2025年~2030年
 全球行動行銷市場規模、佔有率、趨勢分析報告、按組成部分、公司規模、應用、最終用途、地區分類的展望和預測,2024 年至 2031 年