


 |
市場調查報告書
商品編碼
2122434
複合材料:市場佔有率分析、產業趨勢與統計、成長預測(2026-2031)Composite Material - Market Share Analysis, Industry Trends & Statistics, Growth Forecasts (2026 - 2031) |
||||||

※ 本網頁內容可能與最新版本有所差異。詳細情況請與我們聯繫。
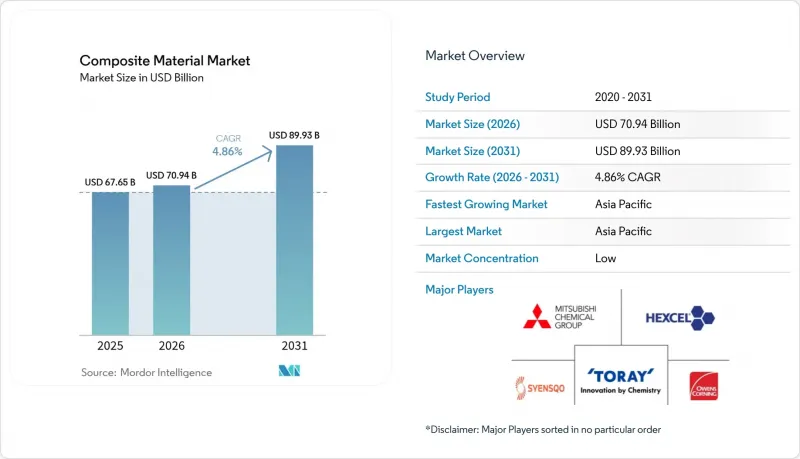
根據 Mordor Intelligence 預測,複合材料市場規模將從 2025 年的 676.5 億美元成長到 2026 年的 709.4 億美元,然後在 2031 年達到 899.3 億美元,2026 年至 2031 年的複合年成長率為 4.86%。
本報告按基體材料(高分子複合材料(PMC)、陶瓷/碳基複合材料 (CMC) 及其他基體)、增強纖維(玻璃纖維、碳纖維及其他)、終端應用產業(汽車和交通運輸、風力發電及其他)以及地區(亞太地區、北美地區、歐洲及其他)對產業進行分類。市場預測以美元 (USD) 為單位。
全球複合材料市場趨勢與洞察
受電氣化推動,電動車領域對碳纖維的需求不斷成長。
電動車大約需要使用450磅塑膠和聚合物複合材料,比內燃機汽車增加了18%。這是因為車輛總重每減少10%,續航里程通常就能增加6-8%。電池外殼就是這種應用的典型例子,碳纖維增強聚合物與鋁相比,重量減輕了30%,而且不會影響熱穩定性。採用玻璃纖維增強熱塑性塑膠模製的車身面板實現了具有成本競爭力的減重,而用於內飾的天然纖維層壓板則進一步加強了永續性。汽車製造商正朝著多材料結構方向發展,將碳纖維、玻璃纖維和生物基增強材料結合,以最佳化剛性、碰撞安全性和生命週期排放。供應鏈正在積極應對,在北美、歐洲和東亞地區擴大絲束產能和認證預浸料生產線,以避免在2026年至2028年新車上市期間出現瓶頸。
擴大在風力發電機葉片製造的應用
全球風電裝置容量預計在2024年成長17%,2025年成長35%,推動累積裝置容量在2035年達到450吉瓦。新一代離岸風力發電的功率已超過15兆瓦,需要長度超過110公尺的葉片,而這只有透過客製化複合材料層壓結構才能實現。到本世紀末,預計每年用於葉片製造的玻璃纖維和碳纖維增強材料將超過100萬噸,這將對玻璃纖維熔煉能力和高模量碳纖維的供應造成越來越大的壓力。雖然玻璃纖維增強塑膠在單位成本方面仍然佔據主導地位,但選擇性碳纖維葉片帽的應用正在不斷擴大,以減少葉尖撓度和葉根重量。在歐洲,熱塑性樹脂葉片的測試和運作正在進行中,以實現可焊接的葉根連接,這有望建立一條避免在水泥窯中混燒的回收管道。隨著該領域葉片新循環法規的引入,材料可追溯性和樹脂再合成已成為原始設備製造商和生產商的當務之急。
複合材料高成本
以零件交付成本計算,碳纖維複合材料的成本通常是鋼材的5到10倍,阻礙了其對成本敏感的細分市場的滲透。航太級預浸料需要高壓釜固化、嚴格的環境控制和廣泛的非破壞性檢測,所有這些都推高了單位成本。汽車產業也面臨類似的障礙,儘管碳纖維具有優異的重量性能比,但其應用主要限於豪華汽車品牌。生產規模仍然是一個重大障礙,因為纖維紡絲生產線和前體工廠都需要大量資金投入。雖然美國國家可再生能源實驗室(NREL)的熱成型等突破性技術預計將回收碳纖維片材的成本降低90%至95%,但商業性化應用仍需要多年的認證測試。在原物料價格下降或設計工程師能夠證明系統層面的顯著成本節約之前,許多潛在的採用者可能會推遲大規模的替換計畫。
細分市場分析
預計到2025年,高分子複合材料(PMC)將佔複合材料市場銷售額的55.62%,這表明其在性能和可製造性方面達到了最佳平衡,是複合材料市場的理想選擇。雖然熱固性環氧樹脂在航太、船舶和風力渦輪機葉片領域仍佔據主導地位,但可回收熱塑性樹脂在汽車和消費品領域的市場佔有率正在穩步成長。目前,商用熱塑性單向帶材的生產線寬度已超過1米,使其適用於電池托盤和片材結構的高通量壓模成型。同時,在航太推進系統和聚光型太陽熱能發電接收器的推動下,陶瓷基質複合材料(CMC)市場預計將在2026年至2031年間以8.12%的複合年成長率成長。
陶瓷基複合材料(CMC)可承受超過1600 度C的高溫,可取代鎳基高溫合金,並透過顯著降低冷卻需求實現無與倫比的熱效率。雖然初始投資較大,但一旦生產穩定,其整個生命週期的提案——更輕的重量、更低的油耗和更低的維護成本——足以彌補增加的初始成本。金屬複合材料在細分市場中正蓬勃發展,憑藉其卓越的導熱性和耐磨性,應用於電子基板載體和刹車盤等領域。隨著積層製造和五軸數控加工帶來的設計彈性不斷提高,預計在未來十年後半期,其市場佔有率將進一步擴大。
區域分析
亞太地區是複合材料市場的中心,預計到2025年將佔全球銷售額的44.85%。受中國離岸風力發電裝置容量擴張、印度地鐵網路發展以及東南亞電網基礎設施升級等因素的推動,該地區複合材料市場預計到2031年將以7.45%的年均複合成長率成長。碳纖維產能的擴張也促進了該地區複合材料市場規模的成長。韓國曉星公司正將其年產量提高到9,000噸,以滿足航太和氫氣罐的需求。日本的價值鏈專注於高精度絲束鋪展和預浸料技術,服務國內飛機專案和出口客戶。
北美緊隨其後,這主要得益於航太領域的持續交付、聯邦政府對可再生能源的投資以及休閒船舶領域復甦的跡象。美國能源局已撥款2000萬美元用於促進風力發電機複合材料的回收利用,顯示循環經濟正在蓬勃發展。加拿大各省正在支持先進材料產業叢集,這些集群將學術研究與開發和注塑成型試驗生產線相結合,旨在維護生物基熱塑性塑膠的國家智慧財產權。
歐洲憑藉其先進的設計能力和嚴格的環境法規,正推動生物樹脂和閉合迴路製程的快速普及。即使受供應鏈中斷和能源成本上漲的影響,2024年下半年產量有所下降,但該地區仍維持了全球21.74%的產量佔有率。維斯塔斯(Vestas)的圓形葉片和低排放塔等舉措,展現了歐盟氣候政策如何引導原始設備製造商(OEM)將優先事項轉向永續性。東歐國家正利用其熟練的勞動力和毗鄰西方市場的地理優勢,吸引對鈽化和纏繞成型工廠的投資。
儘管總合規模較小,但隨著複合材料解決方案在基礎設施現代化和海水淡化項目中得到應用,南美洲和中東/非洲地區的複合材料市場正呈現出顯著成長。值得關注的需求集中區域包括巴西的風電走廊、沙烏地阿拉伯用於海水淡化的濃鹽水管線以及南非的電動公車車身。跨國公司的技術轉讓,加上本地生產的增強材料(劍麻、黃麻)的供應,正在刺激當地創新,並逐步縮小與進口零件的成本差距。
其他好處
- Excel格式的市場預測(ME)表
- 3個月的分析師支持
目錄
第1章:引言
- 研究假設和市場定義
- 調查範圍
第2章:調查方法
第3章執行摘要
第4章 市場狀況
- 市場概覽
- 市場促進因素
- 受電氣化推動,電動車領域對碳纖維的需求不斷成長。
- 擴大在風力發電機葉片製造的應用
- 熱塑性複合材料在汽車大規模生產的應用日益廣泛
- 材料科學領域的技術進步
- 航太和國防工業中複合材料的日益廣泛應用
- 市場限制因素
- 複合材料高成本
- 複合材料回收面臨的挑戰
- 自動化層壓工藝中熟練勞動力短缺
- 價值鏈分析
- 波特五力模型
第5章 市場規模與成長預測
- 透過基體材料
- 高分子複合材料(PMC)
- 熱固性樹脂
- 熱塑性樹脂
- 陶瓷/碳基複合材料(CMC)
- 其他基體(金屬複合材料)
- 高分子複合材料(PMC)
- 增強纖維類型
- 玻璃纖維
- 碳纖維
- 醯胺纖維
- 其他纖維(天然纖維、生物纖維)
- 按最終用途行業分類
- 汽車和交通運輸
- 風力發電
- 航太/國防
- 管道和儲罐
- 建造
- 電氣和電子設備
- 體育和休閒
- 其他終端用戶產業(醫療保健、海運等)
- 按地區
- 亞太地區
- 中國
- 印度
- 日本
- 韓國
- 泰國
- 馬來西亞
- 印尼
- 越南
- 其他亞太國家
- 北美洲
- 美國
- 加拿大
- 墨西哥
- 歐洲
- 德國
- 英國
- 法國
- 義大利
- 西班牙
- 俄羅斯
- 北歐國家
- 土耳其
- 其他歐洲國家
- 南美洲
- 巴西
- 阿根廷
- 哥倫比亞
- 其他南美國家
- 中東和非洲
- 沙烏地阿拉伯
- 南非
- 奈及利亞
- 卡達
- 埃及
- 阿拉伯聯合大公國
- 其他中東和非洲國家
- 亞太地區
第6章 競爭情勢
- 策略趨勢
- 市佔率和排名分析
- 公司簡介
- 3M
- Arkema
- BASF
- CPIC BRASIL Fibras de Vidro Ltda
- DuPont
- Exel Composites
- Gurit Services AG
- Hexcel Corporation
- HS HYOSUNG ADVANCED MATERIALS
- Lanxess
- Mitsubishi Chemical Group Corporation
- Nippon Graphite Fiber Co., Ltd.
- Owens Corning
- SGL Carbon
- Syensqo
- Teijin Limited
- Toray Industries Inc.
第7章 市場機會與未來展望
According to Mordor Intelligence, the composite material market size is expected to grow from USD 67.65 billion in 2025 to USD 70.94 billion in 2026 and is forecast to reach USD 89.93 billion by 2031 at 4.86% CAGR over 2026-2031.
This report Segments the Industry by Matrix Material (Polymer Matrix Composites (PMC), Ceramic/Carbon Matrix Composites (CMCs), Other Matrices), Reinforcement Fiber (Glass Fiber, Carbon Fiber, and More), End-Use Industry (Automotive and Transportation, Wind Energy, and More), and Geography (Asia-Pacific, North America, Europe, and More). The Market Forecasts are Provided in Terms of Value (USD).
Global Composite Material Market Trends and Insights
Electrification-Driven Carbon-Fiber Demand in E-Mobility
Electric vehicles integrate roughly 450 lb of plastics and polymer composites-an 18% rise compared with internal-combustion platforms-because every 10% curb in curb weight typically stretches driving range by 6-8%. Battery enclosures have become a flagship application, where carbon-fiber reinforced polymers deliver a 30% mass cut versus aluminum without sacrificing thermal stability. Body panels molded from glass-fiber reinforced thermoplastics enable cost-competitive lightweighting, while natural-fiber laminates in interior trim broaden sustainability credentials. Automakers are converging on multi-material architectures that blend carbon, glass and bio reinforcements to optimise stiffness, crashworthiness and lifecycle emissions. Supply chains are responding by expanding tow capacity and qualified prepreg lines across North America, Europe and East Asia to avert bottlenecks during the 2026-2028 model-launch window.
Increasing Usage in the Manufacturing of Wind Turbine Blades
Global wind installations climbed 17% in 2024 and 35% in 2025, pushing cumulative capacity toward the 450 GW mark envisaged for 2035. Next-generation offshore machines now exceed 15 MW, requiring blades longer than 110 m that can only be realised with tailored composite lay-ups. More than 1 million t of glass and carbon reinforcements will be consumed annually for blade manufacture by the end of the decade, intensifying pressure on glass-fiber melt capacity and high-modulus carbon supply. While glass-fiber reinforced plastics continue to dominate on a cost-per-meter basis, selective carbon spar caps are proliferating to curb tip deflection and blade-root mass. Europe is piloting thermoplastic blades for weldable root joints, potentially enabling recycling routes that avoid co-processing in cement kilns. The sector's emerging blade-circularity regulations make material traceability and resin reformulation urgent priorities for OEMs and fabricators.
High Cost of Composite Materials
Carbon-fiber composites typically price at five-to-ten times steel on a delivered-part basis, deterring penetration into cost-sensitive segments. Aerospace-grade prepregs entail autoclave curing, tight environmental controls and extensive non-destructive testing, each inflating unit expense. Automotive programs confront similar hurdles, confining carbon-fiber usage largely to premium marques despite favorable weight-benefit ratios. Production scale remains a pivotal barrier, since fiber-spinning lines and precursor plants run capital-intensive. Breakthroughs such as National Renewable Energy Laboratory's thermoforming route promise 90-95% cost savings for recyclable carbon sheets, yet commercial deployment will require multi-year qualification campaigns. Until raw-material prices drop or design engineers capture superior system-level savings, many potential adopters may defer high-volume substitution.
Other drivers and restraints analyzed in the detailed report include:
- Growing Adoption of Thermoplastic Composites in Mass-Production Automotive
- Increasing Use of Composites in the Aerospace and Defense Industry
- Challenges in Recycling Composite Materials
For complete list of drivers and restraints, kindly check the Table Of Contents.
Segment Analysis
Polymer matrix composites (PMCs) delivered 55.62% of 2025 revenue, reinforcing the composites market as the preferred option for balanced performance and manufacturability. Thermoset epoxies remain mainstream in aerospace, marine and wind blades, yet recyclable thermoplastics are steadily eroding share in automotive and consumer goods. Commercial thermoplastic UD-tape lines now exceed 1 m wide, favouring high-throughput press forming for battery trays and seat structures. In parallel, the composites market size attributable to ceramic matrix composites is projected to post an 8.12% CAGR between 2026 and 2031, propelled by aerospace propulsion and concentrated solar-power receivers.
CMCs withstand more than 1 600 °C, replacing nickel super-alloys and slashing cooling demands, thereby unlocking unrivalled thermal efficiencies. Investment outlays are significant, but once quiver production stabilises, their life-cycle value proposition offsets initial premiums through weight savings, fuel burn reductions and lower maintenance. Metal matrix composites occupy a smaller niche that thrives on extraordinary thermal conductivity and wear resistance for electronic substrate carriers and brake rotors. Additive-manufacturing pathways and five-axis CNC finishing are broadening design envelopes, hinting at incremental penetration in the latter half of the decade.
Complete Report Scope:
- By Matrix Material
- Polymer Matrix Composites (PMC)
- Thermoset Resins
- Thermoplastic Resins
- Ceramic/Carbon Matrix Composites (CMCs)
- Other Matrices (Metal Matrix Composites)
- Polymer Matrix Composites (PMC)
- By Reinforcement Fiber
- Glass Fiber
- Carbon Fiber
- Aramid Fiber
- Other Fibers (Natural/Bio Fiber)
- By End-use Industry
- Automotive and Transportation
- Wind Energy
- Aerospace and Defense
- Pipes and Tanks
- Construction
- Electrical and Electronics
- Sports and Recreation
- Other End user Industries (Healthcare, Marine, etc.)
- By Geography
- Asia-Pacific
- China
- India
- Japan
- South Korea
- Thailand
- Malaysia
- Indonesia
- Vietnam
- Rest of Asia-Pacific
- North America
- United States
- Canada
- Mexico
- Europe
- Germany
- United Kingdom
- France
- Italy
- Spain
- Russia
- NORDIC Countries
- Turkey
- Rest of Europe
- South America
- Brazil
- Argentina
- Colombia
- Rest of South America
- Middle East and Africa
- Saudi Arabia
- South Africa
- Nigeria
- Qatar
- Egypt
- United Arab Emirates
- Rest of Middle-East and Africa
- Asia-Pacific
Geography Analysis
Asia-Pacific anchors the composites market with 44.85% revenue in 2025 and is projected to grow at 7.45% through 2031 as China escalates offshore wind installations, India expands metro rail networks and Southeast Asia upgrades grid infrastructure. The regional composites market size also benefits from escalating carbon-fiber capacity; South Korea's Hyosung is lifting annual output to 9 000 t to meet aerospace and hydrogen-tank demand. Japan's value chain focuses on high-precision tow spreading and prepreg technologies, serving both domestic air-frame programs and export customers.
North America trails closely, propelled by sustained aerospace deliveries, federal investments in renewable energy and a resurgent recreational-marine segment. The United States Department of Energy earmarked USD 20 million to advance wind-turbine composite recycling, signalling policy momentum toward circularity. Canadian provinces sponsor advanced-materials clusters that couple academic R&D with injection over-molding pilot lines, aiming to retain domestic IP around bio-based thermoplastics.
Europe commands sophisticated design capabilities and stringent environmental regulations that foster rapid adoption of bio-resins and closed-loop processes. Although supply-chain disruptions and energy-cost spikes trimmed production in late-2024, the bloc maintains a 21.74% share of global volumes. Initiatives such as Vestas's circular blades and low-emission towers illustrate how EU climate policy is steering OEM priorities toward holistic sustainability. Eastern European nations, leveraging skilled labor and proximity to Western markets, are courting investment in pultrusion and filament-winding plants.
South America and the Middle East & Africa, while collectively smaller, are registering outsized percentage gains as infrastructure modernization and desalination projects specify composite solutions. Brazilian wind corridors, Saudi desalination brine lines and South African electric-bus bodies are notable demand pockets. Technology transfer from multinational players, combined with local reinforcement supply (sisal, jute), is catalysing indigenous innovation and gradually narrowing cost gaps with imported parts.
- 3M
- Arkema
- BASF
- CPIC BRASIL Fibras de Vidro Ltda
- DuPont
- Exel Composites
- Gurit Services AG
- Hexcel Corporation
- HS HYOSUNG ADVANCED MATERIALS
- Lanxess
- Mitsubishi Chemical Group Corporation.
- Nippon Graphite Fiber Co., Ltd.
- Owens Corning
- SGL Carbon
- Syensqo
- Teijin Limited
- Toray Industries Inc.
Additional Benefits:
- The market estimate (ME) sheet in Excel format
- 3 months of analyst support
TABLE OF CONTENTS
1 Introduction
- 1.1 Study Assumptions and Market Definition
- 1.2 Scope of the Study
2 Research Methodology
3 Executive Summary
4 Market Landscape
- 4.1 Market Overview
- 4.2 Market Drivers
- 4.2.1 Electrification-Driven Carbon-Fiber Demand in E-Mobility
- 4.2.2 Increasing Usage in the Manufacturing of Wind Turbine
- 4.2.3 Growing Adoption of Thermoplastic Composites in Mass-Production Automotive
- 4.2.4 Technological Advancement in the Field of Material Science
- 4.2.5 Increasing Use of Composites in the Aerospace and Defense Industry
- 4.3 Market Restraints
- 4.3.1 High Cost of Composite Materials
- 4.3.2 Challenges in Recycling of these Materials
- 4.3.3 Skilled-Labour Gap in Automated Lay-up Processes
- 4.4 Value Chain Analysis
- 4.5 Porter's Five Forces
- 4.5.1 Bargaining Power of Suppliers
- 4.5.2 Bargaining Power of Buyers
- 4.5.3 Threat of New Entrants
- 4.5.4 Threat of Substitutes
- 4.5.5 Degree of Competition
5 Market Size and Growth Forecasts (Value)
- 5.1 By Matrix Material
- 5.1.1 Polymer Matrix Composites (PMC)
- 5.1.1.1 Thermoset Resins
- 5.1.1.2 Thermoplastic Resins
- 5.1.2 Ceramic/Carbon Matrix Composites (CMCs)
- 5.1.3 Other Matrices (Metal Matrix Composites)
- 5.1.1 Polymer Matrix Composites (PMC)
- 5.2 By Reinforcement Fiber
- 5.2.1 Glass Fiber
- 5.2.2 Carbon Fiber
- 5.2.3 Aramid Fiber
- 5.2.4 Other Fibers (Natural/Bio Fiber)
- 5.3 By End-use Industry
- 5.3.1 Automotive and Transportation
- 5.3.2 Wind Energy
- 5.3.3 Aerospace and Defense
- 5.3.4 Pipes and Tanks
- 5.3.5 Construction
- 5.3.6 Electrical and Electronics
- 5.3.7 Sports and Recreation
- 5.3.8 Other End user Industries (Healthcare, Marine, etc.)
- 5.4 By Geography
- 5.4.1 Asia-Pacific
- 5.4.1.1 China
- 5.4.1.2 India
- 5.4.1.3 Japan
- 5.4.1.4 South Korea
- 5.4.1.5 Thailand
- 5.4.1.6 Malaysia
- 5.4.1.7 Indonesia
- 5.4.1.8 Vietnam
- 5.4.1.9 Rest of Asia-Pacific
- 5.4.2 North America
- 5.4.2.1 United States
- 5.4.2.2 Canada
- 5.4.2.3 Mexico
- 5.4.3 Europe
- 5.4.3.1 Germany
- 5.4.3.2 United Kingdom
- 5.4.3.3 France
- 5.4.3.4 Italy
- 5.4.3.5 Spain
- 5.4.3.6 Russia
- 5.4.3.7 NORDIC Countries
- 5.4.3.8 Turkey
- 5.4.3.9 Rest of Europe
- 5.4.4 South America
- 5.4.4.1 Brazil
- 5.4.4.2 Argentina
- 5.4.4.3 Colombia
- 5.4.4.4 Rest of South America
- 5.4.5 Middle East and Africa
- 5.4.5.1 Saudi Arabia
- 5.4.5.2 South Africa
- 5.4.5.3 Nigeria
- 5.4.5.4 Qatar
- 5.4.5.5 Egypt
- 5.4.5.6 United Arab Emirates
- 5.4.5.7 Rest of Middle-East and Africa
- 5.4.1 Asia-Pacific
6 Competitive Landscape
- 6.1 Strategic Moves
- 6.2 Market Share (%)/Ranking Analysis
- 6.3 Company Profiles {(includes Global level Overview, Market level overview, Core Segments, Financials as available, Strategic Information, Market Rank/Share for key companies, Products and Services, Recent Developments)}
- 6.3.1 3M
- 6.3.2 Arkema
- 6.3.3 BASF
- 6.3.4 CPIC BRASIL Fibras de Vidro Ltda
- 6.3.5 DuPont
- 6.3.6 Exel Composites
- 6.3.7 Gurit Services AG
- 6.3.8 Hexcel Corporation
- 6.3.9 HS HYOSUNG ADVANCED MATERIALS
- 6.3.10 Lanxess
- 6.3.11 Mitsubishi Chemical Group Corporation.
- 6.3.12 Nippon Graphite Fiber Co., Ltd.
- 6.3.13 Owens Corning
- 6.3.14 SGL Carbon
- 6.3.15 Syensqo
- 6.3.16 Teijin Limited
- 6.3.17 Toray Industries Inc.
7 Market Opportunities and Future Outlook
- 7.1 White-space and Unmet-Need Assessment

 環保複合地板材料市場:全球市場預測(2026-2032)礦山複合襯砌市場:全球市場預測,2026-2032年
 軟磁複合材料市場:按材料、應用、最終用戶、分銷管道和地區分類
 2026年全球精準發酵衍生生醫材料市場報告
 全球永續複合材料市場(2027-2037 年)
 運輸容器市場規模、佔有率和成長分析:按產品類型、材料、應用、最終用戶、分銷管道和地區分類 - 產業預測,2026-2033年
 電動車電池外殼複合材料市場分析與預測(至2035年):類型、產品、技術、組件、應用、形狀、材料類型、最終用戶、功能
 2034年風力渦輪機葉片複合材料市場預測-全球分析(依樹脂類型、材料類型、製造流程、葉片長度、應用和地區分類)
 可再生能源領域複合材料:市場佔有率分析、產業趨勢與統計及成長預測(2026-2031)
 起重機墊板市場機會、成長要素、產業趨勢分析及2026-2035年預測