


 |
市場調查報告書
商品編碼
2122290
靜態隨機存取記憶體(SRAM):市場佔有率分析、行業趨勢和統計數據以及成長預測(2026-2031 年)Static Random Access Memory (SRAM) - Market Share Analysis, Industry Trends & Statistics, Growth Forecasts (2026 - 2031) |
||||||

※ 本網頁內容可能與最新版本有所差異。詳細情況請與我們聯繫。
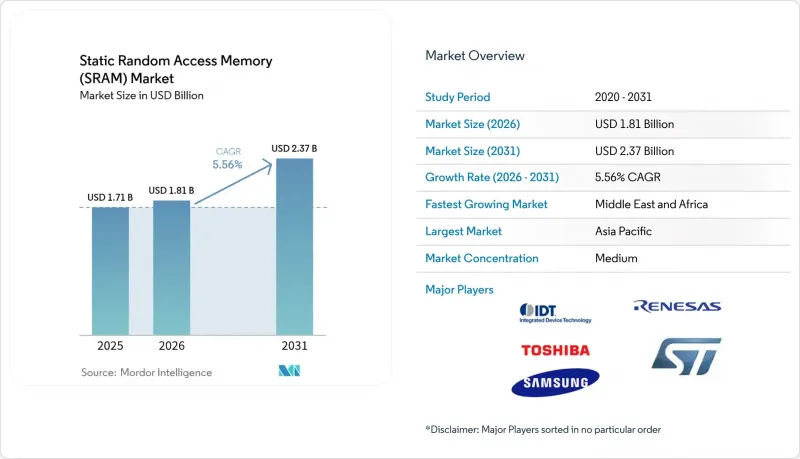
據 Mordor Intelligence 稱,2025 年靜態隨機存取記憶體 (SRAM) 市場價值為 17.1 億美元,預計到 2031 年將從 2026 年的 18.1 億美元成長至 23.7 億美元,預測期(2026-2031 年)的複合成長率為 5.56%。
本報告按功能(非同步 SRAM、同步 SRAM)、產品類型(偽 SRAM、非揮發性 SRAM、其他產品類型)、儲存密度(8Mb 或更少、8-64Mb、64-256Mb、超過 256Mb)、最終用戶(消費電子、工業、工業基礎設施、其他)和電信(北美、南美、歐洲地區分類和電信地區。
全球靜態隨機存取記憶體(SRAM)市場趨勢與洞察
高速快取記憶體的需求日益成長
預計2025年出貨的先進CPU和GPU將配備更大的片上快取,以降低推理延遲。英特爾至強6處理器透過快取最佳化實現了1.4倍的效能提升。台積電的2nm平台比競爭對手的18A製程節點擁有更高的SRAM單元密度,從而提高了超大規模客戶的每瓦L3快取容量。 Marvell發表了6Gb低功耗的2nm客製化SRAM,與傳統製程節點相比,能耗降低了66%。這些創新使得AI加速器能夠將模型參數更靠近運算單元,從而在保持吞吐量的同時減少DRAM流量。因此,靜態隨機存取記憶體(SRAM)市場受益於資料中心和邊緣運算晶片容量的持續升級。
資料中心和5G網路的擴展
雲端服務供應商已將機架密度翻倍以託管人工智慧伺服器,這導致機架頂部交換器中基於 SRAM 的封包緩衝區使用量增加。微軟已在伺服器機房測試並部署了 246-275GHz 無線背板,利用高速 SRAM 實現微秒緩衝。思科的融合 5G 傳輸技術實現了確定性延遲,這需要路由器配備大規模的SRAM 佇列。康寧預測,每個人工智慧機架的光纖需求將成長 18 倍,這反映了基於同步 SRAM 的交換器緩衝區規模的擴大。這波基礎設施浪潮鞏固了靜態隨機存取記憶體 (SRAM) 市場的短期收入前景。
與DRAM/NAND相比,每比特成本更高。
由於SRAM的每位元成本仍然是通用DRAM的數倍,設計人員被迫減少其在大眾市場設備中的使用。 2025年上半年,DDR4模組的價格上漲了約50%,凸顯了整個記憶體堆疊價格的極端波動。三星抓住供應緊張的機會提高了LPDDR4的價格,但這項策略可能會加速OEM廠商對結合SRAM和DRAM的混合架構的興趣,以降低組件成本。因此,靜態隨機存取記憶體(SRAM)市場在入門級消費領域遭遇了抵制,直到密度和成本之間的權衡得到改善。
細分市場分析
到2025年,同步SRAM將佔據靜態隨機存取記憶體市場58.05%的佔有率,鞏固其在CPU、GPU和網路ASIC的確定性快取操作中的關鍵作用。在汽車MCU領域,同步SRAM陣列已被廣泛應用,以滿足駕駛輔助工作負載對即時性的高要求。隨著先進製程節點的進步,頻率範圍不斷擴大,核心電壓不斷降低,預計該領域將繼續保持主導地位。
非同步SRAM的複合年成長率(CAGR)達到6.21%,主要得益於物聯網穿戴式裝置和邊緣閘道領域對SRAM的日益重視,這些裝置對功耗的限制遠大於對延遲的要求。節能設計消除了時脈樹並簡化了基板佈局,這對於採用Syntiant神經協處理器的電池供電醫療設備是一項重大優勢。這種差異凸顯了SRAM市場正從追求統一的效能轉向針對特定應用的最佳化。
偽 SRAM 透過在 SRAM 式介面後整合 DRAM 單元,無需系統層級刷新管理即可實現高密度,預計到 2025 年將佔據 54.02% 的市場佔有率。 RAAAM Memory Technologies 和 NXP 聲稱,與傳統的高密度 SRAM 相比,偽 SRAM 的面積減少了 50%,功耗降低了十倍,使其對大眾市場微控制器極具吸引力。
非揮發性靜態隨機存取記憶體 (nvSRAM) 的成長率最高,複合年成長率 (CAGR) 達到 8.42%,這主要得益於工廠和汽車產業在電壓驟降期間對資料完整性日益成長的需求。工業自動化領域的企業採用 nvSRAM 模組來保護製程變數並避免代價高昂的停機時間。儘管 nvSRAM 市場仍處於小眾階段,但其高附加價值的容錯功能豐富了靜態隨機存取記憶體 (SRAM) 的市場格局。
區域分析
2025年,亞太地區在全球靜態隨機存取記憶體(SRAM)市場佔據61.02%的佔有率,這主要得益於台灣晶圓代工產業的領先地位、韓國的記憶體技術創新以及中國不斷擴大產能的努力。 SK海力士在全球DRAM產量中佔36%的佔有率,凸顯了該地區的技術實力。然而,2024年台灣地震暴露了市場集中度過高的風險,促使日本和新加坡建造緊急晶圓廠。預計2026年日本半導體製造設備銷售額將達到5.51兆日圓(約383.5億美元),凸顯了持續擴大產能的必要性。
中東和非洲地區以7.23%的複合年成長率位居榜首,這主要得益於政府支持的投資,旨在將沿岸地區打造成為橫跨三大洲的資料中心。該地區的倉儲自動化市場預計到2025年將達到16億美元,年均成長率達17.5%,主要驅動力是對可靠的車載現金的需求。累計到2030年,非洲的能源項目將帶來7,300億美元的新資本投資,需要依賴SRAM(靜態隨機存取記憶體)來實現確定性響應的工業控制系統。
北美正致力於部署人工智慧資料中心,而歐洲則集中精力透過430億歐元的「TIPS法案」鞏固其國內主導。意法半導體已獲得50億歐元(約54億美元)的資金,用於在義大利建造碳化矽(SiC)園區,從而擴大其在電力電子領域的區域競爭力,而電力電子領域也需要使用專用SRAM。然而,人才短缺正威脅業務擴張,阿斯麥(ASML)也警告稱,如果移民限制收緊,該公司可能會遷址。這些截然不同的情況凸顯了影響靜態隨機存取記憶體(SRAM)市場的多元化區域因素。
其他好處
- Excel格式的市場預測(ME)表
- 3個月的分析師支持
目錄
第1章:引言
- 研究假設和市場定義
- 調查範圍
第2章:調查方法
第3章執行摘要
第4章 市場狀況
- 市場概覽
- 市場促進因素
- 高速快取記憶體的需求日益成長
- 資料中心和5G網路的擴展
- 物聯網和穿戴式裝置的普及
- 用於小晶片的 3D 整合 SRAM
- 用於低地球軌道(LEO)衛星的抗輻射加強型SRAM
- 引進記憶體內人工智慧加速器
- 市場限制因素
- 與DRAM/NAND相比,每比特成本更高。
- 5nm以下製程節點功耗增加。
- 新興非揮發性記憶體(MRAM/ReRAM)取代市場佔有率
- 由於微影術變異性導致良率降低。
- 價值鏈分析
- 監理情勢
- 技術展望
- 波特五力分析
- 宏觀經濟因素的影響
第5章 市場規模與成長預測
- 按功能
- 異步SRAM
- 同步SRAM
- 依產品類型
- 偽隨機存取記憶體(PSRAM)
- 非揮發性 SRAM (nvSRAM)
- 其他
- 按內存密度
- 8Mb 或更少
- 8~64Mb
- 64~256Mb
- 超過 256MB
- 最終用戶
- 家用電子產品
- 產業
- 通訊基礎設施
- 汽車和航太
- 其他
- 按地區
- 北美洲
- 美國
- 加拿大
- 墨西哥
- 南美洲
- 巴西
- 阿根廷
- 其他南美國家
- 歐洲
- 德國
- 英國
- 法國
- 義大利
- 俄羅斯
- 其他歐洲國家
- 亞太地區
- 中國
- 日本
- 韓國
- 印度
- 台灣
- 其他亞太國家
- 中東和非洲
- 中東
- 土耳其
- 以色列
- GCC
- 其他中東國家
- 非洲
- 南非
- 奈及利亞
- 其他非洲地區
- 中東
- 北美洲
第6章 競爭情勢
- 市場集中度
- 策略趨勢
- 市佔率分析
- 公司簡介
- GSI Technology Inc.
- Cypress Semiconductor Corp.(Infineon)
- Renesas Electronics Corp.
- Integrated Silicon Solution Inc.
- Alliance Memory Inc.
- Everspin Technologies Inc.
- Samsung Electronics Co., Ltd.
- Toshiba Electronic Devices & Storage Corp.
- STMicroelectronics NV
- SK hynix Inc.
- Micron Technology Inc.
- Nanya Technology Corp.
- Winbond Electronics Corp.
- Elite Semiconductor Memory Technology Inc.
- Chiplus Semiconductor Corp.
- Powerchip Semiconductor Mfg. Corp.
- Puya Semiconductor Technology Co., Ltd.
- Lyontek Inc.
- ON Semiconductor Corporation
- Texas Instruments Incorporated
- Integrated Device Technology Inc.
- NXP Semiconductors NV
- Etron Technology Inc.
- Espressif Systems(Shanghai)Co., Ltd.
- SKYHigh Memory Ltd.
第7章 市場機會與未來展望
According to Mordor Intelligence, the static random access memory market size was valued at USD 1.71 billion in 2025 and estimated to grow from USD 1.81 billion in 2026 to reach USD 2.37 billion by 2031, at a CAGR of 5.56% during the forecast period (2026-2031).
This report is Segmented by Function (Asynchronous SRAM, and Synchronous SRAM), Product Type (Pseudo SRAM, Non-Volatile SRAM, and Other Product Types), Memory Density (<=8 Mb, 8-64 Mb, 64-256 Mb, and >256 Mb), End User (Consumer Electronics, Industrial, Communication Infrastructure, and More), and Geography (North America, South America, Europe, Asia-Pacific, and Middle East and Africa).
Global Static Random Access Memory (SRAM) Market Trends and Insights
Rising demand for faster cache memories
Advanced CPUs and GPUs shipped in 2025 featured larger on-chip caches to cut inference latency, with Intel's Xeon 6 showing a 1.4X performance lift tied to cache optimization. TSMC's 2 nm platform delivered higher SRAM cell density than competing 18A nodes, giving hyperscale customers more L3 cache per watt. Marvell unveiled 2 nm custom SRAM that packs 6 Gb of low-power memory, reducing energy use by 66% versus prior nodes. Such innovations enabled AI accelerators to keep model parameters closer to compute units, sustaining throughput while containing DRAM traffic. Consequently, the Static Random Access Memory market benefited from recurring capacity upgrades across data-center and edge silicon.
Data-center and 5G network build-out
Cloud operators doubled rack densities to host AI servers, prompting wider use of SRAM-based packet buffers in top-of-rack switches. Microsoft tested 246-275 GHz wireless backplanes in server halls, where microsecond-scale buffering relied on high-speed SRAM. Cisco's converged 5G transport promoted deterministic latency, necessitating deep SRAM queues in routers. Corning forecasts an 18X jump in fiber demand per AI rack, mirroring the scaling of switch buffers built on synchronous SRAM. This infrastructure wave reinforced near-term revenue visibility for the Static Random Access Memory market.
High cost per bit vs. DRAM/NAND
SRAM remained several times more expensive per bit than commodity DRAM, pressuring designers to trim usage in mass-market gadgets. DDR4 module prices climbed roughly 50% in H1 2025, illustrating volatility across the memory stack. Samsung leveraged tightening supply to lift LPDDR4 pricing, but that tactic risked accelerating OEM interest in hybrid SRAM-DRAM architectures to curb bills of materials. Consequently, the Static Random Access Memory market faced pushback in entry-level consumer segments until density-versus-cost trade-offs improved.
Other drivers and restraints analyzed in the detailed report include:
- IoT and wearable device proliferation
- In-memory AI accelerators adoption
- Emerging NVM (MRAM/ReRAM) displacement
For complete list of drivers and restraints, kindly check the Table Of Contents.
Segment Analysis
Synchronous SRAM captured 58.05% Static Random Access Memory market share in 2025, underscoring its indispensability for deterministic cache operation in CPUs, GPUs, and network ASICs. Automotive MCUs used synchronous arrays to meet stringent real-time requirements for driver-assistance workloads. The segment will maintain leadership as advanced nodes extend frequency envelopes and reduce core voltages.
Asynchronous SRAM expanded at a 6.21% CAGR and increasingly served IoT wearables and edge gateways where power budgets override latency targets. Energy-efficient designs eliminated clock trees and simplified board layouts, a boon for battery-operated healthcare devices employing Syntiant's neural coprocessors. This divergence emphasized the Static Random Access Memory market trend toward application-specific optimization rather than one-size-fits-all performance chasing.
Pseudo-SRAM held a 54.02% share in 2025 by embedding DRAM cells behind an SRAM-style interface, achieving higher density without refresh management at the system level. RAAAM Memory Technologies and NXP claimed 50% area and 10X power savings versus classic high-density SRAM, appealing to mass-market microcontrollers.
Non-volatile SRAM grew fastest at 8.42% CAGR as factories and vehicles demanded data integrity during brownouts. Industrial automation players selected nvSRAM modules to protect process variables, avoiding costly downtime. Although niche, this cohort enriched the Static Random Access Memory market landscape with value-added resilience features.
Complete Report Scope:
- By Function
- Asynchronous SRAM
- Synchronous SRAM
- By Product Type
- Pseudo SRAM (PSRAM)
- Non-Volatile SRAM (nvSRAM)
- Other Product Types
- By Memory Density
- <=8 Mb
- 8 - 64 Mb
- 64 - 256 Mb
- >256 Mb
- By End User
- Consumer Electronics
- Industrial
- Communication Infrastructure
- Automotive and Aerospace
- Other End Users
- By Geography
- North America
- United States
- Canada
- Mexico
- South America
- Brazil
- Argentina
- Rest of South America
- Europe
- Germany
- United Kingdom
- France
- Italy
- Russia
- Rest of Europe
- Asia-Pacific
- China
- Japan
- South Korea
- India
- Taiwan
- Rest of Asia-Pacific
- Middle East and Africa
- Middle East
- Turkey
- Israel
- GCC Countries
- Rest of Middle East
- Africa
- South Africa
- Nigeria
- Rest of Africa
- Middle East
- North America
Geography Analysis
Asia-Pacific retained 61.02% Static Random Access Memory market share in 2025, fueled by Taiwan's foundry dominance, South Korea's memory innovation, and China's scale-up efforts. SK Hynix's rise to 36% of global DRAM output highlighted the region's technology depth. Yet the 2024 Taiwan quake exposed concentration risk, prompting contingency fabs in Japan and Singapore. Japan projected semiconductor equipment sales of JPY 5.51 trillion (USD 38.35 billion) in FY26, underscoring continued capacity build-out.
Middle East and Africa charted the fastest 7.23% CAGR, anchored by sovereign-fund spending to position the Gulf as a tri-continent data hub. Warehouse automation in the region was set for 17.5% annual growth to USD 1.6 billion by 2025, driving demand for reliable on-board caches. Africa's energy projects earmarked USD 730 billion in new capex to 2030, requiring industrial control systems that lean on SRAM for deterministic response.
North America focused on AI datacenter roll-outs, while Europe doubled down on sovereignty through the EUR 43 billion Chips Act. STMicroelectronics secured EUR 5 billion (USD 5.4 billion) for a Silicon Carbide campus in Italy, widening regional competency in power electronics that also consume specialized SRAM. Talent shortages, however, threatened expansion, with ASML warning it might shift operations if immigration tightened. These contrasts highlight diverse regional levers shaping the Static Random Access Memory market.
- GSI Technology Inc.
- Cypress Semiconductor Corp. (Infineon)
- Renesas Electronics Corp.
- Integrated Silicon Solution Inc.
- Alliance Memory Inc.
- Everspin Technologies Inc.
- Samsung Electronics Co., Ltd.
- Toshiba Electronic Devices & Storage Corp.
- STMicroelectronics N.V.
- SK hynix Inc.
- Micron Technology Inc.
- Nanya Technology Corp.
- Winbond Electronics Corp.
- Elite Semiconductor Memory Technology Inc.
- Chiplus Semiconductor Corp.
- Powerchip Semiconductor Mfg. Corp.
- Puya Semiconductor Technology Co., Ltd.
- Lyontek Inc.
- ON Semiconductor Corporation
- Texas Instruments Incorporated
- Integrated Device Technology Inc.
- NXP Semiconductors N.V.
- Etron Technology Inc.
- Espressif Systems (Shanghai) Co., Ltd.
- SKYHigh Memory Ltd.
Additional Benefits:
- The market estimate (ME) sheet in Excel format
- 3 months of analyst support
TABLE OF CONTENTS
1 INTRODUCTION
- 1.1 Study Assumptions and Market Definition
- 1.2 Scope of the Study
2 RESEARCH METHODOLOGY
3 EXECUTIVE SUMMARY
4 MARKET LANDSCAPE
- 4.1 Market Overview
- 4.2 Market Drivers
- 4.2.1 Rising demand for faster cache memories
- 4.2.2 Data-center and 5G network build-out
- 4.2.3 IoT and wearable device proliferation
- 4.2.4 3D-integrated SRAM for chiplets
- 4.2.5 Radiation-hardened SRAM for LEO satellites
- 4.2.6 In-memory AI accelerators adoption
- 4.3 Market Restraints
- 4.3.1 High cost per bit vs. DRAM/NAND
- 4.3.2 Escalating power at <=5 nm nodes
- 4.3.3 Emerging NVM (MRAM/ReRAM) displacement
- 4.3.4 Yield loss from lithography variability
- 4.4 Value Chain Analysis
- 4.5 Regulatory Landscape
- 4.6 Technological Outlook
- 4.7 Porter's Five Forces Analysis
- 4.7.1 Threat of New Entrants
- 4.7.2 Bargaining Power of Buyers
- 4.7.3 Bargaining Power of Suppliers
- 4.7.4 Threat of Substitutes
- 4.7.5 Intensity of Rivalry
- 4.8 Impact of Macroeconomic Factors
5 MARKET SIZE AND GROWTH FORECASTS (VALUE)
- 5.1 By Function
- 5.1.1 Asynchronous SRAM
- 5.1.2 Synchronous SRAM
- 5.2 By Product Type
- 5.2.1 Pseudo SRAM (PSRAM)
- 5.2.2 Non-Volatile SRAM (nvSRAM)
- 5.2.3 Other Product Types
- 5.3 By Memory Density
- 5.3.1 <=8 Mb
- 5.3.2 8 - 64 Mb
- 5.3.3 64 - 256 Mb
- 5.3.4 >256 Mb
- 5.4 By End User
- 5.4.1 Consumer Electronics
- 5.4.2 Industrial
- 5.4.3 Communication Infrastructure
- 5.4.4 Automotive and Aerospace
- 5.4.5 Other End Users
- 5.5 By Geography
- 5.5.1 North America
- 5.5.1.1 United States
- 5.5.1.2 Canada
- 5.5.1.3 Mexico
- 5.5.2 South America
- 5.5.2.1 Brazil
- 5.5.2.2 Argentina
- 5.5.2.3 Rest of South America
- 5.5.3 Europe
- 5.5.3.1 Germany
- 5.5.3.2 United Kingdom
- 5.5.3.3 France
- 5.5.3.4 Italy
- 5.5.3.5 Russia
- 5.5.3.6 Rest of Europe
- 5.5.4 Asia-Pacific
- 5.5.4.1 China
- 5.5.4.2 Japan
- 5.5.4.3 South Korea
- 5.5.4.4 India
- 5.5.4.5 Taiwan
- 5.5.4.6 Rest of Asia-Pacific
- 5.5.5 Middle East and Africa
- 5.5.5.1 Middle East
- 5.5.5.1.1 Turkey
- 5.5.5.1.2 Israel
- 5.5.5.1.3 GCC Countries
- 5.5.5.1.4 Rest of Middle East
- 5.5.5.2 Africa
- 5.5.5.2.1 South Africa
- 5.5.5.2.2 Nigeria
- 5.5.5.2.3 Rest of Africa
- 5.5.5.1 Middle East
- 5.5.1 North America
6 COMPETITIVE LANDSCAPE
- 6.1 Market Concentration
- 6.2 Strategic Moves
- 6.3 Market Share Analysis
- 6.4 Company Profiles (includes Global level Overview, Market level overview, Core Segments, Financials as available, Strategic Information, Market Rank/Share for key companies, Products and Services, and Recent Developments)
- 6.4.1 GSI Technology Inc.
- 6.4.2 Cypress Semiconductor Corp. (Infineon)
- 6.4.3 Renesas Electronics Corp.
- 6.4.4 Integrated Silicon Solution Inc.
- 6.4.5 Alliance Memory Inc.
- 6.4.6 Everspin Technologies Inc.
- 6.4.7 Samsung Electronics Co., Ltd.
- 6.4.8 Toshiba Electronic Devices & Storage Corp.
- 6.4.9 STMicroelectronics N.V.
- 6.4.10 SK hynix Inc.
- 6.4.11 Micron Technology Inc.
- 6.4.12 Nanya Technology Corp.
- 6.4.13 Winbond Electronics Corp.
- 6.4.14 Elite Semiconductor Memory Technology Inc.
- 6.4.15 Chiplus Semiconductor Corp.
- 6.4.16 Powerchip Semiconductor Mfg. Corp.
- 6.4.17 Puya Semiconductor Technology Co., Ltd.
- 6.4.18 Lyontek Inc.
- 6.4.19 ON Semiconductor Corporation
- 6.4.20 Texas Instruments Incorporated
- 6.4.21 Integrated Device Technology Inc.
- 6.4.22 NXP Semiconductors N.V.
- 6.4.23 Etron Technology Inc.
- 6.4.24 Espressif Systems (Shanghai) Co., Ltd.
- 6.4.25 SKYHigh Memory Ltd.
7 MARKET OPPORTUNITIES AND FUTURE OUTLOOK
- 7.1 White-space and Unmet-need Assessment

 SRAM 和 ROM 設計 IP:市場佔有率分析、行業趨勢和統計數據、成長預測(2026-2031 年)
 2026-2034年SRAM和ROM設計IP全球市場規模、佔有率、趨勢和成長分析報告
 靜態隨機存取記憶體市場 - 全球產業規模、佔有率、趨勢、機會、預測:按產品類型、最終用戶、地區和競爭對手分類,2021-2031年
 SRAM 和 ROM 設計 IP 市場報告:按類型和地區分類(2026-2034 年)
 靜態隨機存取記憶體(SRAM)市場機會、成長要素、產業趨勢分析及2026年至2035年預測
 SRAM 和 ROM 設計 IP 市場規模、佔有率和成長分析(按應用、產品、技術、最終用途和地區分類)—產業預測(2026-2033 年)
 全球靜態隨機存取記憶體市場
 SRAM(靜態RAM)市場報告:2031年趨勢、預測與競爭分析
 2024 年至 2028 年全球 SRAM 與 ROM 設計 IP 市場SRAM 和 ROM 設計 IP 的全球市場