


 |
市場調查報告書
商品編碼
2121648
燃氣渦輪機:市場佔有率分析、產業趨勢與統計、成長預測(2026-2031)Gas Turbine - Market Share Analysis, Industry Trends & Statistics, Growth Forecasts (2026 - 2031) |
||||||

※ 本網頁內容可能與最新版本有所差異。詳細情況請與我們聯繫。
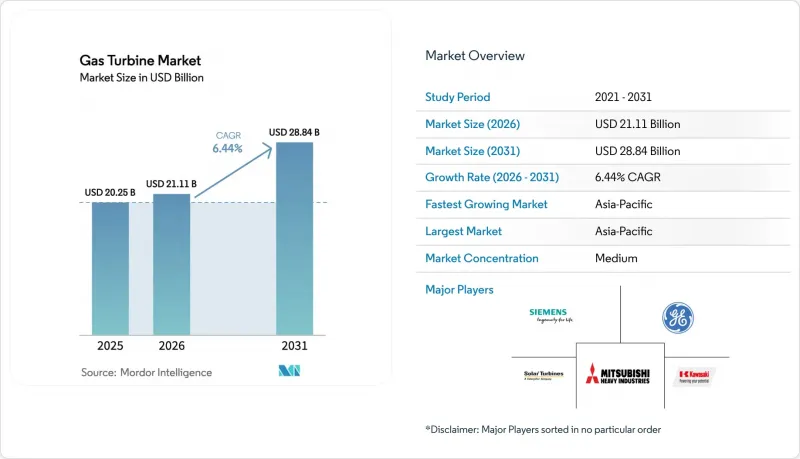
根據 Mordor Intelligence 預測,燃氣渦輪機市場規模將從 2025 年的 202.5 億美元和 2026 年的 211.1 億美元成長到 2031 年的 288.4 億美元,2026 年至 2031 年的年複合成長率(CAGR)為 6.44%。
本報告按輸出功率(小於 30 兆瓦、30-120 兆瓦和大於 120 兆瓦)、運行循環(聯合循環、簡單/開式循環、汽電共生/CHP)、燃料類型(天然氣、液體燃料和其他燃料類型)、最終用戶行業(電力、石油和天然氣以及其他最終用戶行業)和地區(北美、歐洲、亞太地區分類以及中東和非洲地區。
全球燃氣渦輪機市場趨勢及洞察
亞太地區從煤炭轉向天然氣正在加速電力公司的訂單成長。
從煤炭到天然氣的大規模轉型正推動燃氣渦輪機採購量達到歷史新高。馬來西亞於2024年簽署了一份1400兆瓦的聯合循環發電契約,越南將於2025年運作超過2700兆瓦的液化天然氣發電裝置容量。中國已批准2025年新增12吉瓦燃氣發電裝置容量,以補充間歇性可再生能源,其中大部分訂單由國內原始設備製造商(OEM)取得。泰國簽署了一份5300兆瓦的框架契約,指定使用能夠摻入30%氫氣的「氫能型」機組。新加坡將於2025年運作一座670兆瓦的氫能型電廠,進一步鞏固其脫碳進程。
東南亞的液化天然氣互聯島嶼電網正在推動對移動式飛機衍生發電機的需求。
在島嶼電網中,為了避免昂貴的固定基礎設施,採用移動式飛機發電機組正在加速普及。 2024年,巴哈馬群島在颶風過後,根據72小時快速部署條款租賃了四台TM2500型發電機組,迅速恢復了電力供應。 2025年,印尼國家電力公司(PLN)為其分散的礦場和農產品加工廠訂購了20台類似的發電機組。波多黎各和一些加勒比海國家採用了多年期租賃協議,將租賃、燃料物流以及營運和維護(O&M)整合到一份合約中,將所需時間從三年縮短到不到一年。
烏克蘭戰爭後天然氣價格波動,導致歐盟計畫縮減規模。
天然氣價格的持續波動正在削弱專案的獲利能力。德國萊茵集團(RWE)推遲了原定於2024年啟動的1800兆瓦項目,義大利國家電力公司(Enel)在未能獲得超過每兆瓦時80歐元的購電協議(PPA)後,取消了原定於2025年啟動的1200兆瓦電廠項目。西班牙已將資金轉向電池儲能項目,而在英國,進口量的增加導致容量市場結算價格下降。
細分市場分析
功率範圍在30至120兆瓦的中型燃氣渦輪機市場成長最為迅猛,到2031年複合年成長率將達到6.8%。這反映出市場對模組化專案的需求,此類專案可以繞過耗時多年的授權流程。 2025年,功率超過120兆瓦的燃氣渦輪機佔總裝置量的58.3%,但併網和環境評估的瓶頸正在減緩新訂單的成長。預計到2031年,30至120兆瓦級燃氣渦輪機市場規模將超過180億美元,主要得益於東南亞地區加速核准流程的政策。菲律賓等國家將100兆瓦以下電廠的核准期限縮短至9個月,等監管方面的加速措施也推動了這項成長動能。
專案發起人傾向選擇中型機組進行分階段擴建。通用電氣 (GE) 的 LM6000 機組在 2024 年獲得了 18 份訂單,交付週期為 12 個月。西門子能源的 SGT-400 機組在加勒比地區的災害救援領域持續保持緊急備用電源的主導地位。雖然亞太地區的大型電廠建設仍在繼續,但開發商正日益重視降低建設風險,並將發電容量拆分為多個 120 兆瓦的模組,以配合資金籌措里程碑。
預計到2025年,聯合循環發電廠將佔燃氣渦輪機市場佔有率的74.9%,並在2031年之前以7%的複合年成長率成長。隨著營運商追求63%的淨功率效率基準,採用聯合循環配置的燃氣渦輪機市場預計將在2026年至2031年間成長210億美元。單循環發電機在尖峰電力供應和輔助服務市場仍具有價值,但隨著電池技術蠶食頻率調節收入,其市佔率正在下降。
在中東地區,將渦輪機與海水淡化結合,提高了聯合循環發電的經濟效益。阿拉伯聯合大公國哈西揚發電廠裝置容量為2,400兆瓦,日產1.2億加侖淡水,與單獨逆滲透相比,水成本降低了一半。亞洲開發銀行(亞洲開發銀行)等優惠貸款機構目前已將ISO 50001認證作為評估超過2億美元燃氣發電廠貸款的一項標準,進一步推動了高效設計的標準化。
區域分析
預計到2025年,亞太地區將佔全球整體燃氣渦輪機銷售額的59.5%,並將在2031年之前以7.3%的複合年成長率持續成長,鞏固主導在燃氣渦輪機市場的領先地位。中國計劃在2025年新增12吉瓦燃氣發電裝置容量,其中70%的訂單由本土原始設備製造商(OEM)獲得。印度計劃在2030年新增25吉瓦燃氣發電裝置容量,並鼓勵成立合資企業,在當地生產高附加價值零件。在東南亞地區,預計到2028年,在多邊融資的支持下,將有總合14吉瓦的液化天然氣(LNG)發電管道項目開工。
北美市場的成長主要集中在資料中心備用電源、與液化天然氣出口相關的汽電共生以及氫能發電試點計畫。美國在2024年新增了4.8吉瓦的裝置容量,墨西哥在2025年簽署了一份2.4吉瓦聯合循環發電的合約。加拿大的「加拿大液化天然氣」(LNG Canada)計畫在液化過程中採用了1.2吉瓦的通用電氣(GE)燃氣渦輪機,凸顯了天然氣發電在能源出口中的作用。美國環保署(EPA)自2025年起實施的更嚴格的排放標準將強制要求引入選擇性催化還原(SCR)系統,這將使資本成本增加8%。在歐洲,天然氣價格波動和對環境、社會和治理(ESG)融資的限制構成了不利因素。德國和西班牙推遲了2024年的聯合循環發電工程,而英國則選擇氫能發電裝置來實現其脫碳目標。在南歐國家,電池技術的批准正在加速,而天然氣調峰電廠的前景則受到阻礙。
中東和非洲市場正受到石化熱電汽電共生和「水力發電複合循環」計畫的推動。沙烏地阿拉伯將於2024年運作3.8吉瓦的機組,埃及也將在2024年訂購一台4.8吉瓦的單一渦輪機,這將是非洲最大的單一渦輪機。在非洲開發銀行的支持下,南非正在試驗利用飛機廢氣發電來穩定其依賴煤炭的電網。南美洲預計到2025年將佔全球銷售額的5%,利用渦輪機抵銷水力發電的波動。巴西和智利正在根據其綜合可再生能源發展藍圖部署廢氣發電設施。
其他好處:
- Excel格式的市場預測(ME)表
- 3個月的分析師支持
目錄
第1章:引言
- 研究假設和市場定義
- 調查範圍
第2章:調查方法
第3章執行摘要
第4章 市場狀況
- 市場概覽
- 市場促進因素
- 東南亞以液化天然氣為能源的島嶼電網正在推動對基於飛機引擎的發電機的需求。
- 中東地區石化汽電共生設施興建與擴建
- 在加勒比海地區,災害救援的航空衍生發電設備租賃需求激增。
- 市場限制因素
- 烏克蘭戰爭後天然氣價格波動阻礙了歐盟計畫。
- 公用事業規模的電池儲能系統將取代峰值負載渦輪機(美國/澳洲)
- 基於歐盟分類法的ESG主導資金籌措限制
- 大型機架高溫氣體通道零件用超合金供應鏈供不應求。
- 供應鏈分析
- 監理情勢
- 技術展望
- 波特五力分析
第5章 市場規模與成長預測
- 依輸出類型
- 小於30兆瓦
- 30~120 MW
- 120兆瓦或以上
- 駕駛循環
- 複合循環
- 簡單/開放式循環
- 汽電共生/CHP
- 按燃料類型
- 天然氣
- 液體燃料(柴油/煤油/液化石油氣)
- 其他燃料類型(氫氣、沼氣)
- 按最終用戶行業分類
- 電力
- 石油和天然氣
- 其他終端用戶產業(工業、船舶)
- 按地區
- 北美洲
- 美國
- 加拿大
- 墨西哥
- 歐洲
- 英國
- 德國
- 法國
- 義大利
- 西班牙
- 俄羅斯
- 其他歐洲國家
- 亞太地區
- 中國
- 印度
- 日本
- 韓國
- 東南亞國協
- 其他亞太國家
- 南美洲
- 巴西
- 阿根廷
- 智利
- 其他南美國家
- 中東和非洲
- 沙烏地阿拉伯
- 阿拉伯聯合大公國
- 南非
- 埃及
- 其他中東和非洲國家
- 北美洲
第6章 競爭情勢
- 市場集中度
- 策略趨勢(併購、聯盟、購電協議)
- 市場佔有率分析(主要公司的市場排名和市場佔有率)
- 公司簡介
- General Electric Company
- Siemens Energy AG
- Mitsubishi Heavy Industries Ltd.
- Kawasaki Heavy Industries Ltd.
- Ansaldo Energia SpA
- MAN Energy Solutions SE
- Wartsila Oyj Abp
- Rolls-Royce Holdings plc
- Solar Turbines Incorporated
- Capstone Green Energy Corporation
- Doosan Skoda Power
- IHI Corporation
- Bharat Heavy Electricals Limited
- Harbin Electric Co. Ltd.
- Shanghai Electric Group Co. Ltd.
- OPRA Turbines BV
- Baker Hughes Company
- Vericor Power Systems LLC
- Zorya-Mashproekt
- Nanjing Turbine & Electric Machinery Group
第7章 市場機會與未來展望
According to Mordor Intelligence, the gas turbine market size is projected to expand from USD 20.25 billion in 2025 and USD 21.11 billion in 2026 to USD 28.84 billion by 2031, registering a CAGR of 6.44% between 2026 to 2031.
This report is Segmented by Capacity (Below 30 MW, 30 To 120 MW, and Above 120 MW), Operating Cycle (Combined Cycle, Simple/Open Cycle, and Cogeneration/CHP), Fuel Type (Natural Gas, Liquid Fuels, and Other Fuel Types), End-User Industry (Power, Oil and Gas, and Other End-User Industries), and Geography (North America, Europe, Asia-Pacific, South America, and Middle East and Africa).
Global Gas Turbine Market Trends and Insights
Asia-Pacific Coal-to-Gas Transition Accelerating Utility Orders
Large-scale conversions from coal to gas are driving record turbine procurement. Malaysia awarded a 1,400 MW combined-cycle contract in 2024, and Vietnam commissioned more than 2,700 MW of LNG-to-power capacity in 2025. China cleared 12 GW of new gas capacity in 2025 to complement intermittent renewables, with domestic OEMs winning the bulk of orders. Thailand signed a 5,300 MW framework that specifies hydrogen-ready units capable of 30% blends. Singapore brought a 670 MW hydrogen-capable plant online in 2025, strengthening the city-state's decarbonization pathway.
LNG-Linked Island Grids in SEA Driving Mobile Aeroderivative Demand
Island grids are fast-tracking mobile aeroderivative sets to avoid expensive fixed infrastructure. The Bahamas restored post-hurricane supply with four TM2500 units in 2024, leased under 72-hour redeployment clauses. Indonesia's PLN ordered 20 similar units in 2025 for scattered mining and agro-processing hubs. Puerto Rico and several Caribbean nations adopted multi-year leasing pools that integrate rental, fuel logistics, and O&M in single contracts, compressing timelines from three years to under one.
Gas-Price Volatility Post-Ukraine War Curtailing EU Projects
Persistent gas-price swings are eroding project economics. Germany's RWE delayed 1,800 MW of projects in 2024, and Italy's Enel withdrew a 1,200 MW plant in 2025 after failing to secure PPAs above EUR 80 per MWh. Spain redirected capital to batteries, while the UK capacity market cleared at lower prices as imports rose.
Other drivers and restraints analyzed in the detailed report include:
- Petrochemical Cogeneration Build-out in Middle East
- Disaster-Relief Leasing Surge for Aeroderivative Sets in Caribbean
- ESG-Driven Financing Restrictions under EU Taxonomy
For complete list of drivers and restraints, kindly check the Table Of Contents.
Segment Analysis
Mid-range turbines between 30 and 120 MW recorded the fastest growth at a 6.8% CAGR through 2031, reflecting demand for modular projects that avoid multi-year permitting. Above 120 MW machines still represented 58.3% of 2025 installations, but grid-connection bottlenecks and environmental reviews are tempering new orders. The gas turbine market size for the 30 to 120 MW bracket is expected to surpass USD 18 billion by 2031, underpinned by fast-track approvals in Southeast Asia. Regulatory fast-track schemes, such as the Philippines' nine-month permitting window for sub-100 MW plants, underline this momentum.
Project sponsors prefer mid-range sets for incremental expansion. GE's LM6000 secured 18 orders in 2024, citing 12-month delivery schedules. Siemens Energy's SGT-400 continues to dominate emergency back-up throughout the Caribbean disaster-relief segment. Large-frame developments still proceed in Asia-Pacific, but developers increasingly split capacity into multiple 120 MW blocks to mitigate construction risk and align with financing milestones.
Combined-cycle plants controlled 74.9% of the gas turbine market share in 2025 and are forecast to grow at a 7% CAGR to 2031. The gas turbine market size accruing to combined-cycle configurations is projected to add USD 21 billion between 2026 and 2031 as operators pursue 63% net electrical efficiency benchmarks. Simple-cycle machines retain value in peaking and ancillary-service markets, but their share is declining as batteries claim frequency-regulation revenues.
Coupling turbines with desalination is reinforcing combined-cycle economics in the Middle East. UAE's 2,400 MW Hassyan plant pairs power generation with 120 million gallons per day of water production, halving water costs versus standalone reverse-osmosis. Concessional financiers like the Asian Development Bank now use ISO 50001 certification as a gatekeeper for gas-power loans above USD 200 million, further standardizing high-efficiency designs.
Complete Report Scope:
- By Capacity
- Below 30 MW
- 30 to 120 MW
- Above 120 MW
- By Type
- Combined Cycle
- Simple/Open Cycle
- Cogeneration/CHP
- By Fuel Type
- Natural Gas
- Liquid Fuels (Diesel/Kerosene/LPG)
- Other Fuel Types (Hydrogen, Biogas)
- By End-User Industry
- Power
- Oil and Gas
- Other End-user Industries (Industrial, Marine)
- By Geography
- North America
- United States
- Canada
- Mexico
- Europe
- United Kingdom
- Germany
- France
- Italy
- Spain
- Russia
- Rest of Europe
- Asia-Pacific
- China
- India
- Japan
- South Korea
- ASEAN Countries
- Rest of Asia-Pacific
- South America
- Brazil
- Argentina
- Chile
- Rest of South America
- Middle East and Africa
- Saudi Arabia
- United Arab Emirates
- South Africa
- Egypt
- Rest of Middle East and Africa
- North America
Geography Analysis
Asia-Pacific generated 59.5% of global revenue in 2025 and is set to expand at a 7.3% CAGR through 2031, cementing its lead in the gas turbine market. China approved 12 GW of new gas capacity in 2025, with local OEMs securing 70% of orders. India projects 25 GW of additions by 2030, incentivizing joint ventures that localize high-value components. LNG-to-power pipelines totaling 14 GW across Southeast Asia will enter construction before 2028 with multilateral financing support.
North America market growth focused on data-center backup power, LNG export cogeneration, and hydrogen pilots. The United States added 4.8 GW in 2024, and Mexico awarded 2.4 GW of combined-cycle contracts in 2025. Canada's LNG Canada project relies on 1.2 GW of GE turbines for liquefaction, highlighting the role of gas generation in energy exports. Stricter EPA emissions thresholds from 2025 raise capital costs by 8% due to required selective catalytic reduction systems. Europe is facing headwinds from volatile gas prices and ESG financing limits. Germany and Spain deferred combined-cycle projects in 2024, while the UK opted for hydrogen-ready units to meet decarbonization goals. Southern Europe accelerated battery storage approvals, reducing gas peaker prospects.
The Middle East and Africa market is propelled by petrochemical cogeneration and water-plus-power projects. Saudi Arabia commissioned 3.8 GW in 2024, and Egypt placed Africa's largest single turbine order in 2024 for 4.8 GW. South Africa pilots aeroderivative peakers to stabilize coal-heavy grids with African Development Bank support. South America captured 5% of revenue in 2025, leveraging turbines to offset hydropower variability. Brazil and Chile see peaker installations aligned with renewable integration roadmaps.
- General Electric Company
- Siemens Energy AG
- Mitsubishi Heavy Industries Ltd.
- Kawasaki Heavy Industries Ltd.
- Ansaldo Energia SpA
- MAN Energy Solutions SE
- Wartsila Oyj Abp
- Rolls-Royce Holdings plc
- Solar Turbines Incorporated
- Capstone Green Energy Corporation
- Doosan Skoda Power
- IHI Corporation
- Bharat Heavy Electricals Limited
- Harbin Electric Co. Ltd.
- Shanghai Electric Group Co. Ltd.
- OPRA Turbines BV
- Baker Hughes Company
- Vericor Power Systems LLC
- Zorya-Mashproekt
- Nanjing Turbine & Electric Machinery Group
Additional Benefits:
- The market estimate (ME) sheet in Excel format
- 3 months of analyst support
TABLE OF CONTENTS
1 Introduction
- 1.1 Study Assumptions & Market Definition
- 1.2 Scope of the Study
2 Research Methodology
3 Executive Summary
4 Market Landscape
- 4.1 Market Overview
- 4.2 Market Drivers
- 4.2.1 LNG-linked Island Grids in SEA Driving Mobile Aeroderivative Demand
- 4.2.2 Petro-chemical Cogeneration Build-out in Middle East
- 4.2.3 Disaster-Relief Leasing Surge for Aeroderivative Sets in Caribbeans
- 4.3 Market Restraints
- 4.3.1 Gas-price Volatility Post-Ukraine War Curtailing EU Projects
- 4.3.2 Utility-scale Battery Storage Displacing Peaking Turbines (US/Australia)
- 4.3.3 ESG-driven Financing Restrictions under EU Taxonomy
- 4.3.4 Super-alloy Supply-Chain Shortages for Large-Frame Hot-gas-path Parts
- 4.4 Supply-Chain Analysis
- 4.5 Regulatory Landscape
- 4.6 Technological Outlook
- 4.7 Porter's Five Forces Analysis
- 4.7.1 Bargaining Power of Suppliers
- 4.7.2 Bargaining Power of Consumers
- 4.7.3 Threat of New Entrants
- 4.7.4 Threat of Substitute Products and Services
- 4.7.5 Intensity of Competitive Rivalry
5 Market Size & Growth Forecasts
- 5.1 By Capacity
- 5.1.1 Below 30 MW
- 5.1.2 30 to 120 MW
- 5.1.3 Above 120 MW
- 5.2 By Type
- 5.2.1 Combined Cycle
- 5.2.2 Simple/Open Cycle
- 5.2.3 Cogeneration/CHP
- 5.3 By Fuel Type
- 5.3.1 Natural Gas
- 5.3.2 Liquid Fuels (Diesel/Kerosene/LPG)
- 5.3.3 Other Fuel Types (Hydrogen, Biogas)
- 5.4 By End-User Industry
- 5.4.1 Power
- 5.4.2 Oil and Gas
- 5.4.3 Other End-user Industries (Industrial, Marine)
- 5.5 By Geography
- 5.5.1 North America
- 5.5.1.1 United States
- 5.5.1.2 Canada
- 5.5.1.3 Mexico
- 5.5.2 Europe
- 5.5.2.1 United Kingdom
- 5.5.2.2 Germany
- 5.5.2.3 France
- 5.5.2.4 Italy
- 5.5.2.5 Spain
- 5.5.2.6 Russia
- 5.5.2.7 Rest of Europe
- 5.5.3 Asia-Pacific
- 5.5.3.1 China
- 5.5.3.2 India
- 5.5.3.3 Japan
- 5.5.3.4 South Korea
- 5.5.3.5 ASEAN Countries
- 5.5.3.6 Rest of Asia-Pacific
- 5.5.4 South America
- 5.5.4.1 Brazil
- 5.5.4.2 Argentina
- 5.5.4.3 Chile
- 5.5.4.4 Rest of South America
- 5.5.5 Middle East and Africa
- 5.5.5.1 Saudi Arabia
- 5.5.5.2 United Arab Emirates
- 5.5.5.3 South Africa
- 5.5.5.4 Egypt
- 5.5.5.5 Rest of Middle East and Africa
- 5.5.1 North America
6 Competitive Landscape
- 6.1 Market Concentration
- 6.2 Strategic Moves (M&A, Partnerships, PPAs)
- 6.3 Market Share Analysis (Market Rank/Share for key companies)
- 6.4 Company Profiles (includes Global level Overview, Market level overview, Core Segments, Financials as available, Strategic Information, Products & Services, and Recent Developments)
- 6.4.1 General Electric Company
- 6.4.2 Siemens Energy AG
- 6.4.3 Mitsubishi Heavy Industries Ltd.
- 6.4.4 Kawasaki Heavy Industries Ltd.
- 6.4.5 Ansaldo Energia SpA
- 6.4.6 MAN Energy Solutions SE
- 6.4.7 Wartsila Oyj Abp
- 6.4.8 Rolls-Royce Holdings plc
- 6.4.9 Solar Turbines Incorporated
- 6.4.10 Capstone Green Energy Corporation
- 6.4.11 Doosan Skoda Power
- 6.4.12 IHI Corporation
- 6.4.13 Bharat Heavy Electricals Limited
- 6.4.14 Harbin Electric Co. Ltd.
- 6.4.15 Shanghai Electric Group Co. Ltd.
- 6.4.16 OPRA Turbines BV
- 6.4.17 Baker Hughes Company
- 6.4.18 Vericor Power Systems LLC
- 6.4.19 Zorya-Mashproekt
- 6.4.20 Nanjing Turbine & Electric Machinery Group
7 Market Opportunities & Future Outlook
- 7.1 White-space & Unmet-Need Assessment

 複合循環 (CC)的全球市場 (以季度為基礎)
 燃氣渦輪機
燃氣渦輪機 北美燃氣渦輪機:市場佔有率分析、產業趨勢與統計及成長預測(2026-2031 年)歐洲燃氣渦輪機:市場佔有率分析、產業趨勢與統計及成長預測(2026-2031)
 聯合循環燃氣渦輪機市場:按零件、燃料類型、渦輪功率、運轉模式、循環配置、安裝類型和最終用戶分類-2026-2032年全球市場預測
 H/J級燃氣渦輪機市場規模:依產品類型、技術、終端用戶產業、地區和預測分類燃氣渦輪機市場:2026-2032年全球市場預測(按產品、零件、功率輸出、技術、冷卻系統、最終用戶和分銷管道分類)
 氫燃料相容燃氣渦輪機市場預測至2034年-按發電容量、氫燃料相容程度、技術、最終用戶和地區分類的全球分析
 燃氣渦輪機市場-全球產業規模、佔有率、趨勢、機會、預測:產能、技術、週期、產業、地區和競爭格局,2021-2031年
 燃氣渦輪機機服務市場規模、佔有率和趨勢分析報告:按渦輪機類型、渦輪機功率、服務類型、服務供應商、最終用途、地區和細分市場預測(2026-2033 年)