


 |
市場調查報告書
商品編碼
2113978
北美燃氣渦輪機:市場佔有率分析、產業趨勢與統計及成長預測(2026-2031 年)North America Gas Turbine - Market Share Analysis, Industry Trends & Statistics, Growth Forecasts (2026 - 2031) |
||||||

※ 本網頁內容可能與最新版本有所差異。詳細情況請與我們聯繫。
根據 Mordor Intelligence 估計,2026 年北美燃氣渦輪機市值為 30.6 億美元,預計到 2031 年將達到 36.6 億美元,在預測期(2026-2031 年)內複合年成長率為 3.67%。
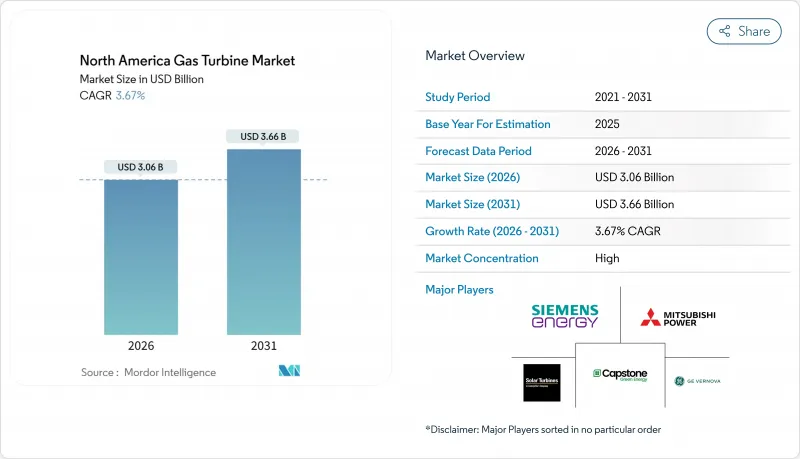
本報告按輸出功率(30兆瓦以下、31-120兆瓦、120兆瓦以上)、運行循環(聯合循環、簡單/開式循環、汽電共生/CHP)、燃料類型(天然氣、液體燃料、其他燃料類型)、終端用戶產業(電力、石油和天然氣、其他)以及地區(美國、加拿大、墨西哥)進行細分。市場規模和預測均以美元計價。
北美燃氣渦輪機市場趨勢與洞察
可再生能源普及率的不斷提高,正在推動對輸出調整能力的快速需求。
到2024年,美國風能和太陽能的累積設備容量將達到295吉瓦,這將迫使電網營運商維護能夠在10分鐘內將輸出功率從零調整到滿載的發電機組。 ERCOT的操作後備電力需求曲線傾向於採用源自航空的渦輪機,例如GE Vernova的LM2500XPRESS,這類渦輪機可以在5分鐘內達到滿載輸出,在電力短缺期間,其價格將超過每兆瓦時5000美元。 PJM互聯公司在2025/2026年競標改革後,也對快速啟動的資源採取了類似的估值方法,改革後結算價格將提高到每兆瓦日269.92美元。根據國際能源總署(IEA)的數據,可再生能源佔比超過40%的電網需要至少相當於尖峰負載15%的可調備用容量,而加州已經超過了這個閾值。因此,單一循環和開式循環發電設施正受到關注,因為儘管它們的熱效率較低,但其每兆瓦峰值輸出的資本成本比聯合循環發電設施低 30% 至 40%。
資料中心和人工智慧負載的激增導致區域容量短缺。
預計到2024年,超大規模資料中心和人工智慧訓練設施的耗電量將達到約50太瓦時(TWh),而且這項耗電量還在穩定成長,往往超過當地電網的可用容量。 2024年12月訂購的29台GE Vernova LM2500XPRESS機組,正是資料中心營運商部署現場快速回應發電系統以確保運作的例證。在維吉尼亞州勞登縣,公用事業公司申請了2024年新增2.3吉瓦(GW)的併網容量,其中大部分將分配給燃氣熱電聯產(CH)系統,這些系統能夠在發生故障時獨立運作。德克薩斯州也出現了類似的採購模式,即時價格波動正在推動用戶側的部署。向模組化陣列的轉變,使得雙燃料能力、黑啟動能力和快速部署比絕對熱效率性能更為重要。
電池成本的下降削弱了新建燃氣尖峰發電廠的地位。
根據美國能源局的一項趨勢分析,公用事業規模的鋰離子電池價格持續下降,預計2026年將與運行4小時的簡單迴圈燃氣渦輪機實現成本閾值。加州獨立系統營運商(California ISO)已簽訂超過6吉瓦的儲能契約,用於替代計畫中的燃氣調峰電廠。德州電力可靠性委員會(ERCOT)也計劃在2024年新增4.2吉瓦的儲能容量。電池具有瞬時響應的優勢,並可享受投資稅額扣抵,這削弱了那些主要依賴因供不應求而導致價格上漲的資產的投資回報。然而,由於運作和電網穩定性能力的限制,同步燃氣渦輪機在可靠性方面仍然發揮著一定的作用,尤其是在運行時間超過4小時或需要慣性支撐的情況下。原始設備製造商(OEM)正透過銷售氫燃料相容燃燒器和二氧化碳捕集維修套件來與儲能系統區分開來。
細分市場分析
預計到2025年,北美31-120兆瓦級燃氣渦輪機市場規模將達15.8億美元,佔市場佔有率的53.3%。此細分市場成長的原因在於其標準化的設計、更短的前置作業時間以及對併網用戶和電錶後向用戶的適應性。工業製造商正在採用中功率機組進行熱電聯產(CHP),而中游天然氣業者則將類似的機組用於壓縮站。另一個優勢是降低風險。買家可以分階段增加發電容量,從而降低燃料價格波動和政策變化帶來的風險。與微型燃氣渦輪機相比,其維護週期更短,且與大型機組相比,其重建成本也更可控。
儘管目前120兆瓦以上的機組數量不多,但預計到2031年,其複合年成長率將達到4.5%。以這一速度,預計到預測期結束時,它們在北美燃氣渦輪機市場的佔有率將接近30%。這項規格的機組主要用於美國東南部和中西部地區的燃煤改燃氣項目,這些地區的單一電廠需要彌補因退役的吉瓦級基本負載容量而造成的損失。杜克能源公司計劃於2024年關閉其位於卡羅來納州的兩座燃煤發電廠,因此採購了通用電氣Vernova HA系列新型燃氣渦輪機,該系列燃氣渦輪機採用複合迴圈配置,額定輸出功率為826兆瓦。由於鎳基高溫合金供應鏈日益緊張,預計此類機組的前置作業時間將會延長,這促使原始設備製造商(OEM)對其鍛造能力進行垂直整合。
預計到2025年,複合迴圈發電將佔總發電收入的71.1%(21.1億美元),凸顯了其熱效率超過60%所帶來的燃料成本優勢。儘管此運作模式的資本密集度較高,但在天然氣價格適中的情況下,其高產能利用率可以彌補這一不足,使其成為調度需求適中的電力公司的理想選擇。近期的一些建設案例將燃氣渦輪機與輔助管道燃燒和先進的餘熱鍋爐(HRSG)設計相結合,在備用容量緊張的情況下,可以產生額外的兆瓦電力。
儘管效率可能下降超過15個百分點,但簡單迴圈和開式循環設備仍以5.3%的複合年成長率快速擴張。隨著電力市場重新評估輸出波動性和啟動可靠性,預計到2031年,北美簡單迴圈峰值功率燃氣渦輪機市場規模將達到12.5億美元。 ERCOT在2024年模擬的電力短缺事件凸顯了能夠在10分鐘內達到額定輸出功率的設備具有更高的獲利潛力。輸電系統運營商現在根據運行週期選擇分段式設備組合,而不是依賴單一技術來覆蓋所有負載曲線,在過渡時段採用聯合循環,在高峰時段採用簡單迴圈。
其他好處:
- Excel格式的市場預測(ME)表
- 3個月的分析師支持
目錄
第1章:引言
- 研究假設和市場定義
- 調查範圍
第2章:調查方法
第3章執行摘要
第4章 市場狀況
- 市場概覽
- 近期趨勢與發展
- 市場促進因素
- 豐富的頁岩氣供應使燃料成本維持在較低水準。
- 可再生能源普及率的不斷提高,正在推動發電能力需求的快速成長。
- 燃煤電廠改燃氣電廠的更新計劃
- 資料中心和人工智慧帶來的負載激增導致區域容量短缺。
- IRA 對 H2 相容型渦輪機的氫能稅額扣抵產生的連鎖反應。
- 預測分析能力的提升降低了生命週期內的平準化能源成本。
- 市場限制因素
- 電池成本的下降阻礙了新建燃氣尖峰發電廠的建設。
- 加強對石化燃料資產的淨零排放監管
- 大型鍛造件和鎳合金供應鏈中的瓶頸
- ERCOT和PJM的容量價格波動
- 供應鏈分析
- 監理情勢
- 技術展望
- 波特五力模型
第5章 市場規模與成長預測
- 按產能
- 30兆瓦或以下
- 31~120 MW
- 超過120兆瓦
- 按商業週期
- 複合循環
- 簡單/開放式循環
- 汽電共生/CHP
- 按燃料類型
- 天然氣
- 液體燃料(柴油/煤油/液化石油氣)
- 其他燃料類型(氫氣、沼氣)
- 按最終用戶行業分類
- 電力
- 石油和天然氣
- 其他終端用戶產業(工業、船舶)
- 按地區
- 美國
- 加拿大
- 墨西哥
第6章 競爭情勢
- 市場集中度
- 策略趨勢(併購、聯盟、購電協議)
- 市場佔有率分析(主要公司的市場排名和佔有率)
- 公司簡介
- GE Vernova
- Siemens Energy
- Mitsubishi Power Americas
- Rolls-Royce plc
- Solar Turbines(Caterpillar)
- Capstone Green Energy
- Kawasaki Heavy Industries
- Ansaldo Energia
- Harbin Electric International
- Wartsila Energy
- MAN Energy Solutions
- Vericor Power Systems
- Doosan Enerbility
- Centrax Gas Turbines
- OPRA Turbines
- Siemens AG(legacy units)
- Pratt & Whitney Power Systems
- Bharat Heavy Electricals(BHEL)
- United Engine Corporation
- EthosEnergy
第7章 市場機會與未來展望
According to Mordor Intelligence, the North America gas turbine market size is estimated at USD 3.06 billion in 2026, and is expected to reach USD 3.66 billion by 2031, at a CAGR of 3.67% during the forecast period (2026-2031).
This report is Segmented by Capacity (Up To 30 MW, 31 To 120 MW, and Above 120 MW), Operating Cycle (Combined Cycle, Simple/Open Cycle, and Cogeneration/CHP), Fuel Type (Natural Gas, Liquid Fuels, and Other Fuel Types), End-User Industry (Power, Oil and Gas, and Others), and Geography (United States, Canada, and Mexico). The Market Sizes and Forecasts are Provided in Terms of Value (USD).
North America Gas Turbine Market Trends and Insights
Rising Renewable Penetration Drives Fast-Ramping Capacity Needs
Cumulative U.S. wind and solar capacity reached 295 GW in 2024, compelling grid operators to maintain generators that can ramp from zero to full load in under 10 minutes. ERCOT's operating-reserve demand curve prices scarcity events above USD 5,000 per MWh, rewarding aeroderivative turbines such as GE Vernova's LM2500XPRESS that can achieve full output within five minutes. PJM Interconnection applies a similar valuation to fast-start resources after its 2025/2026 auction reforms lifted clearing prices to USD 269.92 per MW-day. The International Energy Agency projects that grids surpassing 40% renewable penetration need dispatchable reserves equal to at least 15% of peak load, a threshold already exceeded in California. Consequently, simple-cycle and open-cycle installations, despite lower thermal efficiency, gain prominence because their capital cost per MW of peaking capacity is 30%-40% below combined-cycle equivalents.
Data-Center & AI Load Surges Creating Local Capacity Deficits
Hyperscale and AI-training facilities consumed roughly 50 TWh in 2024 and continue to grow, often outpacing local grid headroom. A December 2024 order for 29 GE Vernova LM2500XPRESS units illustrates how data-center operators procure on-site fast-start generation to guarantee uptime. Loudoun County, Virginia, saw utilities file for 2.3 GW of new interconnection capacity in 2024, much of it earmarked for gas-fired combined heat and power that can island during disturbances. Similar procurement patterns appear in Texas, where real-time price volatility encourages behind-the-meter deployment. The shift toward modular arrays values dual-fuel capability, black-start readiness, and rapid installation over absolute heat-rate performance.
Falling Battery-Storage Costs Undermine New Gas Peakers
Utility-scale lithium-ion prices continue to decline and are expected to cross the cost-parity threshold with 4-hour simple-cycle turbines in 2026, according to U.S. Department of Energy trend analyses. California ISO has already contracted more than 6 GW of storage, displacing planned gas peakers, and ERCOT added 4.2 GW in 2024. Batteries offer instantaneous response and qualify for investment tax credits, eroding the earnings outlook for assets that rely primarily on scarcity pricing. Yet limitations in duration and grid-forming capability still leave a reliability niche for synchronous gas turbines, especially for events exceeding four hours or requiring inertial support. OEMs counter by marketing hydrogen-ready burners and carbon-capture retrofit kits to differentiate against storage.
Other drivers and restraints analyzed in the detailed report include:
- IRA Hydrogen-Tax-Credit Pull-Through for H2-Ready Turbines
- Predictive-Analytics Upgrades Lowering Lifetime LCOE
- Tightening Net-Zero Regulations on Fossil Assets
For complete list of drivers and restraints, kindly check the Table Of Contents.
Segment Analysis
North America gas turbine market size for the 31-120 MW class reached USD 1.58 billion in 2025, representing a 53.3% share. The segment thrives on standardized engineering, compressed lead times, and suitability for both grid-connected and behind-the-meter customers. Industrial manufacturers adopt mid-range units for combined heat and power, while midstream gas operators use similar frames for compression stations. A second-order effect is risk mitigation: buyers can phase in capacity, limiting exposure to fuel-price swings and policy shifts. Maintenance intervals are shorter than those for microturbines, yet rebuilding costs remain manageable relative to heavy-duty frames.
Units above 120 MW, though smaller in count, are recording a 4.5% CAGR through 2031, a rate likely to lift their North America gas turbine market share to just under 30% by the end of the forecast horizon. Coal-to-gas replacement projects in the U.S. Southeast and Midwest predominantly adopt this size class because individual plants must replicate gigawatt-scale retiring baseload capacity. Duke Energy's 2024 coal retirements in the Carolinas triggered procurement of new GE Vernova HA-class turbines rated at 826 MW in combined-cycle configuration. Supply-chain stress for nickel-based superalloys exposes this class to longer lead times, prompting OEMs to vertically integrate forging capacity.
Combined-cycle configurations commanded 71.1% of 2025 revenue, equal to USD 2.11 billion, confirming the cost-of-fuel advantage derived from 60%-plus thermal efficiency. The operating cycle's higher capital intensity is offset by strong capacity factors under moderate gas prices, making it the preferred choice for utilities with mid-merit dispatch profiles. Recent builds pair gas turbines with supplementary duct firing and advanced HRSG designs, extracting incremental megawatts when reserve margins tighten.
Simple-cycle and open-cycle installations grow faster, at a 5.3% CAGR, even though their efficiency penalty can exceed 15 percentage points. The North America gas turbine market size for simple-cycle peakers is forecast to touch USD 1.25 billion by 2031 as capacity markets revise valuation for ramp speed and start reliability. ERCOT's 2024 scarcity events highlighted revenue upside for assets capable of reaching nameplate in under ten minutes. Grid operators now procure portfolios that segment by duty cycle, combined-cycle for shoulder periods, and simple-cycle for peaks, rather than forcing one technology to cover all load shapes.
Complete Report Scope:
- By Capacity
- Up to 30 MW
- 31 to 120 MW
- Above 120 MW
- By Operating Cycle
- Combined Cycle
- Simple/Open Cycle
- Cogeneration/CHP
- By Fuel Type
- Natural Gas
- Liquid Fuels (Diesel/Kerosene/LPG)
- Other Fuel Types (Hydrogen, Biogas)
- By End-User Industry
- Power
- Oil and Gas
- Other End-user Industries (Industrial, Marine)
- By Geography
- United States
- Canada
- Mexico
List of Companies Covered in this Report:
- GE Vernova
- Siemens Energy
- Mitsubishi Power Americas
- Rolls-Royce plc
- Solar Turbines (Caterpillar)
- Capstone Green Energy
- Kawasaki Heavy Industries
- Ansaldo Energia
- Harbin Electric International
- Wartsila Energy
- MAN Energy Solutions
- Vericor Power Systems
- Doosan Enerbility
- Centrax Gas Turbines
- OPRA Turbines
- Siemens AG (legacy units)
- Pratt & Whitney Power Systems
- Bharat Heavy Electricals (BHEL)
- United Engine Corporation
- EthosEnergy
Additional Benefits:
- The market estimate (ME) sheet in Excel format
- 3 months of analyst support
TABLE OF CONTENTS
1 Introduction
- 1.1 Study Assumptions & Market Definition
- 1.2 Scope of the Study
2 Research Methodology
3 Executive Summary
4 Market Landscape
- 4.1 Market Overview
- 4.2 Recent Trends & Developments
- 4.3 Market Drivers
- 4.3.1 Abundant shale-gas supply keeps fuel costs low
- 4.3.2 Rising renewable penetration drives fast-ramping capacity needs
- 4.3.3 Coal-to-gas fleet replacement programmes
- 4.3.4 Data-centre & AI load surges creating local capacity deficits
- 4.3.5 IRA hydrogen-tax-credit pull-through for H2-ready turbines
- 4.3.6 Predictive-analytics upgrades lowering lifetime LCOE
- 4.4 Market Restraints
- 4.4.1 Falling battery-storage costs undermine new gas peakers
- 4.4.2 Tightening net-zero regulations on fossil assets
- 4.4.3 Supply-chain bottlenecks for large forgings & nickel alloys
- 4.4.4 ERCOT & PJM capacity-price volatility
- 4.5 Supply-Chain Analysis
- 4.6 Regulatory Landscape
- 4.7 Technological Outlook
- 4.8 Porter's Five Forces
- 4.8.1 Bargaining Power of Suppliers
- 4.8.2 Bargaining Power of Buyers
- 4.8.3 Threat of New Entrants
- 4.8.4 Threat of Substitutes
- 4.8.5 Intensity of Rivalry
5 Market Size & Growth Forecasts
- 5.1 By Capacity
- 5.1.1 Up to 30 MW
- 5.1.2 31 to 120 MW
- 5.1.3 Above 120 MW
- 5.2 By Operating Cycle
- 5.2.1 Combined Cycle
- 5.2.2 Simple/Open Cycle
- 5.2.3 Cogeneration/CHP
- 5.3 By Fuel Type
- 5.3.1 Natural Gas
- 5.3.2 Liquid Fuels (Diesel/Kerosene/LPG)
- 5.3.3 Other Fuel Types (Hydrogen, Biogas)
- 5.4 By End-User Industry
- 5.4.1 Power
- 5.4.2 Oil and Gas
- 5.4.3 Other End-user Industries (Industrial, Marine)
- 5.5 By Geography
- 5.5.1 United States
- 5.5.2 Canada
- 5.5.3 Mexico
6 Competitive Landscape
- 6.1 Market Concentration
- 6.2 Strategic Moves (M&A, Partnerships, PPAs)
- 6.3 Market Share Analysis (Market Rank/Share for key companies)
- 6.4 Company Profiles (includes Global level Overview, Market level overview, Core Segments, Financials as available, Strategic Information, Products & Services, and Recent Developments)
- 6.4.1 GE Vernova
- 6.4.2 Siemens Energy
- 6.4.3 Mitsubishi Power Americas
- 6.4.4 Rolls-Royce plc
- 6.4.5 Solar Turbines (Caterpillar)
- 6.4.6 Capstone Green Energy
- 6.4.7 Kawasaki Heavy Industries
- 6.4.8 Ansaldo Energia
- 6.4.9 Harbin Electric International
- 6.4.10 Wartsila Energy
- 6.4.11 MAN Energy Solutions
- 6.4.12 Vericor Power Systems
- 6.4.13 Doosan Enerbility
- 6.4.14 Centrax Gas Turbines
- 6.4.15 OPRA Turbines
- 6.4.16 Siemens AG (legacy units)
- 6.4.17 Pratt & Whitney Power Systems
- 6.4.18 Bharat Heavy Electricals (BHEL)
- 6.4.19 United Engine Corporation
- 6.4.20 EthosEnergy
7 Market Opportunities & Future Outlook
- 7.1 White-space & Unmet-Need Assessment

 複合循環 (CC)的全球市場 (以季度為基礎)
 燃氣渦輪機
燃氣渦輪機 燃氣渦輪機:市場佔有率分析、產業趨勢與統計、成長預測(2026-2031)歐洲燃氣渦輪機:市場佔有率分析、產業趨勢與統計及成長預測(2026-2031)
 聯合循環燃氣渦輪機市場:按零件、燃料類型、渦輪功率、運轉模式、循環配置、安裝類型和最終用戶分類-2026-2032年全球市場預測
 H/J級燃氣渦輪機市場規模:依產品類型、技術、終端用戶產業、地區和預測分類燃氣渦輪機市場:2026-2032年全球市場預測(按產品、零件、功率輸出、技術、冷卻系統、最終用戶和分銷管道分類)
 氫燃料相容燃氣渦輪機市場預測至2034年-按發電容量、氫燃料相容程度、技術、最終用戶和地區分類的全球分析
 燃氣渦輪機市場-全球產業規模、佔有率、趨勢、機會、預測:產能、技術、週期、產業、地區和競爭格局,2021-2031年
 燃氣渦輪機機服務市場規模、佔有率和趨勢分析報告:按渦輪機類型、渦輪機功率、服務類型、服務供應商、最終用途、地區和細分市場預測(2026-2033 年)