


 |
市場調查報告書
商品編碼
2121329
智慧製造:市場佔有率分析、產業趨勢與統計、成長預測(2026-2031)Smart Manufacturing - Market Share Analysis, Industry Trends & Statistics, Growth Forecasts (2026 - 2031) |
||||||

※ 本網頁內容可能與最新版本有所差異。詳細情況請與我們聯繫。
根據 Mordor Intelligence 預測,智慧製造市場規模預計將在 2026 年達到 3,871.4 億美元,到 2031 年達到 7,300.4 億美元,複合年成長率為 13.53%。
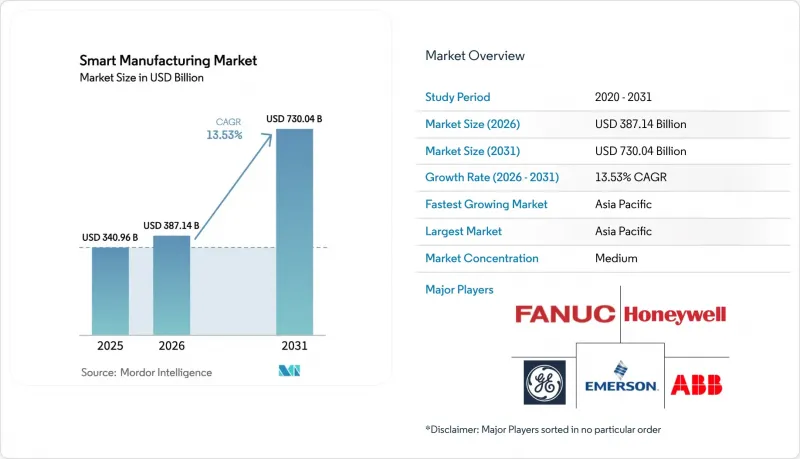
本報告按技術(可程式邏輯控制器 (PLC)、監控與資料擷取系統 (SCADA) 及其他)、元件(硬體、軟體及其他)、部署模式(本地部署、雲端部署和混合部署)、終端用戶產業(汽車、半導體和電子、化學和石化及其他)以及地區進行細分。市場預測以美元 (USD) 為單位。
全球智慧製造市場趨勢與洞察
擴大工業4.0和工業物聯網的應用,以提高效率
工廠正從先導計畫過渡到全面部署工業物聯網 (IIoT),透過在現有設備上添加低成本邊緣感測器,將意外停機時間減少高達 20%。監控與資料收集 (SCADA) 基礎設施降低了新節點的邊際成本,實現了預測性警報,從而避免了汽車和半導體生產線上數百萬美元的停機損失。製藥廠正在將這種架構擴展到無塵室,以即時監控顆粒物數量,從而降低批次缺陷率並提高毛利率。數位審計追蹤現在已成為身份驗證框架的基礎,而 IIoT 的實施是更新品管的先決條件。隨著操作技術和資訊技術的融合,工廠正在實施零信任分段和流量異常分析,以減輕橫向網路威脅。
政府對數位化工廠的獎勵和政策義務
美國《晶片與科學法案》為2027年實施先進製造執行系統(AME)的半導體製造廠提供390億美元的補助。德國的工業4.0津貼為實施雲端連接控制器和人機介面的中小型工廠提供高達40%的維修費用補貼。印度的生產連結獎勵計畫計劃為電子和製藥行業的企業提供補貼,但前提是必須進行即時生產歷史追蹤。中國的「十四五」規劃要求鋼鐵、化工和能源產業的國有企業在2025年實現「智慧製造」目標,這推動了國內對分散式控制和邊緣分析平台的訂單成長。推遲升級的企業可能會失去補貼資金籌措和需要數位化可追溯性的出口市場。
中小企業面臨高昂的資本投資成本和不確定的投資回報。
中小企業佔製造業總就業人數的60%,但只有28%的企業投資於智慧製造。這是因為實施入門級執行系統的成本在20萬至80萬美元之間,遠遠超出典型的IT預算。傳統控制器通常缺少乙太網路端口,因此需要購買閘道器設備和進行自訂協定轉換。一項2025年的調查顯示,超過一半的歐洲中小企業在18個月內無法量化生產力提升,導致預算凍結。訂閱模式雖然降低了初始成本,但會產生持續的費用。此外,新興市場的銀行在提供自動化貸款時要求大量的股本。
細分市場分析
數位孿生平台將比任何其他技術都更有價值,因為它們允許工廠在實際升級設備之前模擬整條生產線。可程式邏輯控制器 (PLC) 仍然至關重要,但其預計到 2025 年將佔據 31.23% 的市場佔有率,這表明它們已進入成熟階段而非成長階段。對虛擬副本的需求很高,尤其是在航太和汽車行業,因為在這些行業,每一分鐘的實體停機都可能造成六位數的損失。數位孿生工具與產品生命週期管理 (PLM) 系統配合使用,可以幫助工程師測試數百種「假設」場景,而無需關閉運作中線。在離散電子領域,數位孿生可以縮短新產品的部署時間,因為佈局變更可以在虛擬空間中顯示,而無需在現場進行調整。
分散式控制系統在化學和石油天然氣行業仍然佔據主導地位,因為這些行業的安全要求確定性的回應時間。邊緣分析正在與監控與資料收集 (SCADA) 系統融合,透過將機器學習模型整合到控制器韌體中,泵浦可以在振動超過閾值之前很久就向工作人員發出軸承磨損警報。移動人機介面正在取代固定面板,每次事故的平均維修時間縮短約 15 分鐘。國際電工委員會 (IEC) 標準 IEC 61499 在模組化生產線中越來越受歡迎,因為這些生產線需要在無需大規模重新編程的情況下進行小批量生產切換。這些融合趨勢表明,智慧製造市場將越來越依賴基於硬體基礎的軟體主導編配。
即使到了2025年,硬體仍將佔支出的44.13%,但隨著感測器和機器人價格的下降,未來的成長將轉向軟體和整合。如今,測量溫度和振動的感測器每個成本不到10美元,這使得在工廠的每個馬達上安裝感測器成為可能。每秒收集和處理數百萬個資料點給舊有系統帶來了壓力,因此智慧製造市場正在轉型為可橫向擴展的高效能時間序列資料庫。隨著市場從永久授權轉向雲端訂閱,軟體收入穩步成長,儘管長期擁有成本不斷上升,但供應商的現金流保持穩定。
由於多供應商堆疊使實施成為一項複雜的工程項目,服務業正以16.89%的複合年成長率快速成長。整合商將來自一家供應商的可程式邏輯控制器 (PLC)、另一家供應商的監控系統以及另一家供應商的企業資源計劃 (ERP) 系統整合。專家將預先配置的模板打包,用於製藥批次處理和汽車混合車型組裝,從而將運作時間縮短一半。小規模工廠由於缺乏自動化工程師,更傾向於選擇託管服務,這些服務按月提供遠端監控、軟體修補程式和網路安全服務。隨著整合的重要性超過採購,服務將成為智慧製造市場規模指標下一波成長的基礎。
區域分析
預計到2025年,亞太地區將佔智慧製造收入的36.53%,並在2031年之前維持14.54%的年均成長率,超過其他所有地區。光是中國就已部署了400多個私有5G工廠網路,其五年規劃要求在2025年之前實現智慧製造目標。印度的補貼計畫已投資65億美元用於電子產品和藥品的數位化溯源,將平均投資回收期縮短至不到兩年。在日本,由於勞動力老化,協作機器人的引入正在加速;而在韓國,測量儀器正被引入到半導體製造設備的電極等各個層面,以確保3奈米及以下節點的良率。
在北美,美國《晶片與整合產品法案》(CHIPS Act)提供的390億美元津貼正被廣泛應用,用於推動先進執行系統的部署。此外,實施能源監控系統的公司還能獲得稅額扣抵。在墨西哥,近岸外包熱潮正將跨國資本引入基於數位孿生和私有5G的尖端生產線。在加拿大的航太叢集中,機器視覺檢測技術正被應用於複合材料組件的偵測。歐洲正依靠碳邊境調節機制鼓勵出口商維修其能源監控設備,以避免未來被徵收關稅。德國正在擴大小規模工廠40%的維修津貼,而英國正在對其汽車生產線進行改造,以適應電動車的生產需求。
在中東和非洲,各國都在推行各自的產業政策。沙烏地阿拉伯在其「2030願景」框架下,正大力資助石化、金屬和食品相關項目,並強制要求所有新建生產線採用可程式邏輯控制器(PLC)和邊緣分析技術。阿拉伯聯合大公國則將人工智慧津貼與海水淡化和鋁提煉產業的數位化工廠試點計畫掛鉤。在南非,由於工廠在停電期間依賴柴油發電機,雲端運算的普及速度較為緩慢。儘管如此,肯亞的紡織業正在實施基本的智慧工廠機制,因為出口合約使得相關成本可以有效控制。
其他好處:
- Excel格式的市場預測(ME)表
- 3個月的分析師支持
目錄
第1章:引言
- 研究假設和市場定義
- 調查範圍
第2章:調查方法
第3章執行摘要
第4章 市場狀況
- 市場概覽
- 市場促進因素
- 工業物聯網旨在促進工業4.0的廣泛應用和效率提升。
- 政府對數位化工廠的激勵措施和政策義務
- 技術純熟勞工短缺正在加速自動化技術的應用。
- 碳邊境調節機制促進了工廠層級的能源透明度。
- 利用數位孿生技術進行預測性維護的收入來源
- 部署可實現超低延遲控制的專用 5G 網路
- 市場限制因素
- 中小企業面臨高額資本投入和不明朗的投資報酬率問題。
- 網路安全和資料主權問題
- 限制互通性的傳統類比設備
- 半導體供應鏈的波動導致控制硬體的交付延遲。
- 宏觀經濟因素對市場的影響
- 產業價值鏈分析
- 監理情勢
- 技術展望
- 波特五力分析
第5章 市場規模與成長預測
- 透過技術
- 可程式邏輯控制器(PLC)
- 監控與數據採集(SCADA)
- 企業資源規劃(ERP)
- 分散式控制系統(DCS)
- 人機介面(HMI)
- 產品生命週期管理(PLM)
- 製造執行系統(MES)
- 其他技術
- 按組件
- 硬體
- 機器人技術
- 感應器
- 機器視覺系統
- 控制設備
- 軟體
- MES
- PLM
- SCADA/ERP套件
- 數位孿生/人工智慧和分析
- 服務
- 整合和部署
- 諮詢和培訓
- 託管服務
- 電信業
- 硬體
- 部署模式
- 現場
- 雲
- 混合
- 按最終用戶行業分類
- 車
- 半導體和電子設備
- 石油和天然氣
- 化工/石油化工
- 製藥和生命科學
- 食品/飲料
- 能源公用事業
- 物流和倉儲
- 其他終端用戶產業
- 按地區
- 北美洲
- 美國
- 加拿大
- 墨西哥
- 歐洲
- 德國
- 英國
- 法國
- 義大利
- 西班牙
- 俄羅斯
- 其他歐洲國家
- 亞太地區
- 中國
- 日本
- 印度
- 韓國
- ASEAN
- 澳洲和紐西蘭
- 其他亞太國家
- 南美洲
- 巴西
- 阿根廷
- 其他南美國家
- 中東
- 沙烏地阿拉伯
- 阿拉伯聯合大公國
- 土耳其
- 其他中東國家
- 非洲
- 南非
- 奈及利亞
- 其他非洲國家
- 北美洲
第6章 競爭情勢
- 市場集中度
- 策略趨勢
- 市佔率分析
- 公司簡介
- ABB Ltd.
- Emerson Electric Co.
- FANUC Corporation
- General Electric Co.
- Honeywell International Inc.
- Mitsubishi Electric Corp.
- Robert Bosch GmbH
- Rockwell Automation Inc.
- Schneider Electric SE
- Siemens AG
- Texas Instruments Inc.
- Yokogawa Electric Corp.
- Cisco Systems Inc.
- IBM Corporation
- Oracle Corporation
- SAP SE
- Johnson Controls Intl. plc
- PTC Inc.
- Dassault Systemes SE
- 3D Systems Corp.
- Stratasys Ltd.
- Delta Electronics Inc.
- Capgemini SE
- Renishaw plc
第7章 市場機會與未來展望
According to Mordor Intelligence, the smart manufacturing market size is USD 387.14 billion in 2026 and is projected to reach USD 730.04 billion by 2031, reflecting a 13.53% CAGR.
This report is Segmented by Technology (Programmable Logic Controller (PLC), Supervisory Controller and Data Acquisition (SCADA), and More), Component (Hardware, Software, and More), Deployment Mode (On-Premise, Cloud, and Hybrid), End-User Industry (Automotive, Semiconductors and Electronics, Chemical and Petrochemical, and More), and Geography. The Market Forecasts are Provided in Terms of Value (USD).
Global Smart Manufacturing Market Trends and Insights
Rising Adoption of Industry 4.0 and IIoT for Efficiency
Factories move from pilot projects to full-scale IIoT rollouts, cutting unplanned downtime by as much as 20% after adding low-cost edge sensors to legacy equipment. Supervisory control and data acquisition backbones lower the marginal cost of new nodes, helping automotive and semiconductor lines generate predictive alerts that avert million-dollar stoppages. Pharmaceutical plants extend the architecture into cleanrooms to monitor particulate counts in real time, trimming batch rejection rates and raising gross margins. Certification frameworks now reference digital audit trails, making IIoT adoption a prerequisite for quality-management renewals. As operational and information technology converge, plants deploy zero-trust segmentation and traffic anomaly analytics to curb lateral cyber threats.
Government Incentives and Policy Mandates for Digital Factories
The United States CHIPS and Science Act directs USD 39 billion in subsidies toward fabs that install advanced manufacturing execution systems by 2027. Germany's Industry 4.0 grants reimburse up to 40% of retrofit costs for small and medium plants that add cloud-connected controllers and human-machine interfaces. India's Production-Linked Incentive schemes tie payouts to real-time genealogy tracking in electronics and pharmaceuticals. China's 14th Five-Year Plan obliges state-owned enterprises in steel, chemicals, and energy to reach "intelligent manufacturing" targets by 2025, inflating domestic orders for distributed control and edge-analytics platforms. Companies delaying upgrades risk losing access to subsidized capital and export markets that demand digital traceability.
High CAPEX and Uncertain SME ROI
Small and medium enterprises cover 60% of manufacturing employment but just 28% of smart-manufacturing capex, because entry-level execution systems run USD 200,000-USD 800,000, well above typical IT budgets. Legacy controllers often lack Ethernet ports, forcing purchases of gateway devices and custom protocol translation. A 2025 survey found that more than half of European SMEs could not quantify productivity gains within 18 months, leading to budget freezes. Subscription pricing lowers upfront costs but adds recurring fees, and banks in emerging markets demand high equity contributions for automation loans.
Other drivers and restraints analyzed in the detailed report include:
- Skilled-Labor Shortages Accelerating Automation Uptake
- Carbon-Border Adjustment Mechanism Driving Factory-level Energy Transparency
- Cyber-Security and Data-Sovereignty Concerns
For complete list of drivers and restraints, kindly check the Table Of Contents.
Segment Analysis
Digital-twin platforms will capture more incremental value than any other technology as factories simulate entire lines before physical retooling. Programmable logic controllers remain vital, yet their 31.23% revenue share in 2025 signals maturity rather than growth. Demand for virtual replicas rises especially in aerospace and automotive, where every minute of physical downtime carries six-figure costs. Digital-twin tools link with product lifecycle management to help engineers test hundreds of "what-if" scenarios without stopping a running line. In discrete electronics, twins shorten new-product introductions because layout changes surface virtually, not on shop floors.
Distributed control systems stay entrenched in chemicals and oil and gas, where safety demands deterministic response times. Edge analytics blends with supervisory control and data acquisition, embedding machine-learning models inside controller firmware so pumps alert staff to bearing wear well before vibration exceeds thresholds. Mobile human-machine interfaces replace fixed panels, shaving average repair time by nearly 15 minutes per incident. The International Electrotechnical Commission's IEC 61499 standard gains traction in modular lines that must switch between short batches without extensive reprogramming. This convergence suggests the smart manufacturing market will rely on software-driven orchestration layered over a hardware foundation.
Hardware still accounted for 44.13% of expenditure in 2025, yet falling sensor and robot prices mean future growth will shift to software and integration. Sensors for temperature or vibration now cost under USD 10 each, allowing plants to instrument every motor. Collating millions of data points per second strains legacy systems, pushing the smart manufacturing market toward high-performance time-series databases that scale horizontally. Software revenue grows steadily as perpetual licenses give way to cloud subscriptions, driving up long-run ownership cost but smoothing cash flow for vendors.
Services expand at a 16.89% CAGR because multi-vendor stacks turn deployment into a complex engineering project. Integrators blend programmable logic controllers from one vendor with supervision from another and enterprise resource planning from a third. Specialists bundle pre-configured templates for pharmaceutical batch execution or automotive mixed-model assembly, halving go-live timelines. Managed services appeal to smaller plants that lack automation engineers, offering remote monitoring, software patching, and cybersecurity under monthly contracts. As integration eclipses procurement, services will anchor the next growth wave within the smart manufacturing market size metrics.
Complete Report Scope:
- By Technology
- Programmable Logic Controller (PLC)
- Supervisory Control and Data Acquisition (SCADA)
- Enterprise Resource Planning (ERP)
- Distributed Control System (DCS)
- Human-Machine Interface (HMI)
- Product Lifecycle Management (PLM)
- Manufacturing Execution System (MES)
- Other Technologies
- By Component
- Hardware
- Robotics
- Sensors
- Machine-Vision Systems
- Control Devices
- Software
- MES
- PLM
- SCADA / ERP Suites
- Digital-Twin / AI and Analytics
- Services
- Integration and Implementation
- Consulting and Training
- Managed Services
- Communication Segment
- Hardware
- By Deployment Mode
- On-Premise
- Cloud
- Hybrid
- By End-User Industry
- Automotive
- Semiconductors and Electronics
- Oil and Gas
- Chemical and Petrochemical
- Pharmaceuticals and Life Sciences
- Food and Beverage
- Energy and Utilities
- Logistics and Warehousing
- Other End-User Industries
- By Geography
- North America
- United States
- Canada
- Mexico
- Europe
- Germany
- United Kingdom
- France
- Italy
- Spain
- Russia
- Rest of Europe
- Asia Pacific
- China
- Japan
- India
- South Korea
- ASEAN
- Australia and New Zealand
- Rest of Asia Pacific
- South America
- Brazil
- Argentina
- Rest of South America
- Middle East
- Saudi Arabia
- United Arab Emirates
- Turkey
- Rest of Middle East
- Africa
- South Africa
- Nigeria
- Rest of Africa
- North America
Geography Analysis
Asia-Pacific held 36.53% of smart manufacturing revenue in 2025 and will deliver a 14.54% compound growth pace through 2031, outstripping every other region. China alone deployed more than 400 private 5G factory networks, and its five-year plan mandates intelligent-manufacturing milestones by 2025. India's subsidies channel USD 6.5 billion into digital traceability for electronics and pharmaceuticals, cutting average payback to under two years. Japan's aging workforce accelerates collaborative-robot rollouts, while South Korea instruments every semiconductor tool down to electrodes to safeguard yields at sub-3-nanometer nodes.
North America benefits from USD 39 billion in U.S. CHIPS Act grants, which require advanced execution systems, and tax credits that reward energy-monitoring layers. Mexico's nearshoring boom pulls capital south of the border to brand-new lines designed around digital twins and private 5G. Canada's aerospace cluster adds machine-vision inspection on composite assemblies. Europe leans on its Carbon Border Adjustment Mechanism, pushing exporters to retrofit energy-monitoring devices now to avoid future tariffs. Germany extends 40% retrofit grants for small plants, and the United Kingdom rebuilds automotive lines for electric vehicles.
Middle East and Africa pursue national industrial agendas. Saudi Arabia funds petrochemical, metals, and food projects under Vision 2030, with every new line stipulating programmable logic controllers and edge analytics. The United Arab Emirates ties AI grants to digital-factory pilots in desalination and aluminum smelting. South Africa's cloud adoption lags because plants rely on diesel generators during power outages. Still, Kenya's textiles adopt basic smart-factory layers where export contracts justify the cost.
- ABB Ltd.
- Emerson Electric Co.
- FANUC Corporation
- General Electric Co.
- Honeywell International Inc.
- Mitsubishi Electric Corp.
- Robert Bosch GmbH
- Rockwell Automation Inc.
- Schneider Electric SE
- Siemens AG
- Texas Instruments Inc.
- Yokogawa Electric Corp.
- Cisco Systems Inc.
- IBM Corporation
- Oracle Corporation
- SAP SE
- Johnson Controls Intl. plc
- PTC Inc.
- Dassault Systemes SE
- 3D Systems Corp.
- Stratasys Ltd.
- Delta Electronics Inc.
- Capgemini SE
- Renishaw plc
Additional Benefits:
- The market estimate (ME) sheet in Excel format
- 3 months of analyst support
TABLE OF CONTENTS
1 INTRODUCTION
- 1.1 Study Assumptions and Market Definition
- 1.2 Scope of the Study
2 RESEARCH METHODOLOGY
3 EXECUTIVE SUMMARY
4 MARKET LANDSCAPE
- 4.1 Market Overview
- 4.2 Market Drivers
- 4.2.1 Rising Adoption of Industry 4.0 / IIoT for Efficiency
- 4.2.2 Government Incentives and Policy Mandates for Digital Factories
- 4.2.3 Skilled-Labour Shortages Accelerating Automation Uptake
- 4.2.4 Carbon-Border Adjustment Mechanism Driving Factory-level Energy Transparency
- 4.2.5 Digital-Twin-based Predictive-Maintenance Revenue Streams
- 4.2.6 Roll-out of Private 5G Networks Enabling Ultra-Low-Latency Control
- 4.3 Market Restraints
- 4.3.1 High CAPEX and Uncertain SME ROI
- 4.3.2 Cyber-Security and Data-Sovereignty Concerns
- 4.3.3 Legacy Analogue Equipment Limiting Interoperability
- 4.3.4 Semiconductor Supply-Chain Volatility Delaying Control Hardware
- 4.4 Impact of Macroeconomic Factors on the Market
- 4.5 Industry Value Chain Analysis
- 4.6 Regulatory Landscape
- 4.7 Technological Outlook
- 4.8 Porter's Five Forces Analysis
- 4.8.1 Bargaining Power of Suppliers
- 4.8.2 Bargaining Power of Buyers
- 4.8.3 Threat of New Entrants
- 4.8.4 Threat of Substitutes
- 4.8.5 Intensity of Competitive Rivalry
5 MARKET SIZE AND GROWTH FORECASTS (VALUE)
- 5.1 By Technology
- 5.1.1 Programmable Logic Controller (PLC)
- 5.1.2 Supervisory Control and Data Acquisition (SCADA)
- 5.1.3 Enterprise Resource Planning (ERP)
- 5.1.4 Distributed Control System (DCS)
- 5.1.5 Human-Machine Interface (HMI)
- 5.1.6 Product Lifecycle Management (PLM)
- 5.1.7 Manufacturing Execution System (MES)
- 5.1.8 Other Technologies
- 5.2 By Component
- 5.2.1 Hardware
- 5.2.1.1 Robotics
- 5.2.1.2 Sensors
- 5.2.1.3 Machine-Vision Systems
- 5.2.1.4 Control Devices
- 5.2.2 Software
- 5.2.2.1 MES
- 5.2.2.2 PLM
- 5.2.2.3 SCADA / ERP Suites
- 5.2.2.4 Digital-Twin / AI and Analytics
- 5.2.3 Services
- 5.2.3.1 Integration and Implementation
- 5.2.3.2 Consulting and Training
- 5.2.3.3 Managed Services
- 5.2.4 Communication Segment
- 5.2.1 Hardware
- 5.3 By Deployment Mode
- 5.3.1 On-Premise
- 5.3.2 Cloud
- 5.3.3 Hybrid
- 5.4 By End-User Industry
- 5.4.1 Automotive
- 5.4.2 Semiconductors and Electronics
- 5.4.3 Oil and Gas
- 5.4.4 Chemical and Petrochemical
- 5.4.5 Pharmaceuticals and Life Sciences
- 5.4.6 Food and Beverage
- 5.4.7 Energy and Utilities
- 5.4.8 Logistics and Warehousing
- 5.4.9 Other End-User Industries
- 5.5 By Geography
- 5.5.1 North America
- 5.5.1.1 United States
- 5.5.1.2 Canada
- 5.5.1.3 Mexico
- 5.5.2 Europe
- 5.5.2.1 Germany
- 5.5.2.2 United Kingdom
- 5.5.2.3 France
- 5.5.2.4 Italy
- 5.5.2.5 Spain
- 5.5.2.6 Russia
- 5.5.2.7 Rest of Europe
- 5.5.3 Asia Pacific
- 5.5.3.1 China
- 5.5.3.2 Japan
- 5.5.3.3 India
- 5.5.3.4 South Korea
- 5.5.3.5 ASEAN
- 5.5.3.6 Australia and New Zealand
- 5.5.3.7 Rest of Asia Pacific
- 5.5.4 South America
- 5.5.4.1 Brazil
- 5.5.4.2 Argentina
- 5.5.4.3 Rest of South America
- 5.5.5 Middle East
- 5.5.5.1 Saudi Arabia
- 5.5.5.2 United Arab Emirates
- 5.5.5.3 Turkey
- 5.5.5.4 Rest of Middle East
- 5.5.6 Africa
- 5.5.6.1 South Africa
- 5.5.6.2 Nigeria
- 5.5.6.3 Rest of Africa
- 5.5.1 North America
6 COMPETITIVE LANDSCAPE
- 6.1 Market Concentration
- 6.2 Strategic Moves
- 6.3 Market Share Analysis
- 6.4 Company Profiles (includes Global Level Overview, Market Level Overview, Core Segments, Financials as Available, Strategic Information, Market Rank/Share for Key Companies, Products and Services, and Recent Developments)
- 6.4.1 ABB Ltd.
- 6.4.2 Emerson Electric Co.
- 6.4.3 FANUC Corporation
- 6.4.4 General Electric Co.
- 6.4.5 Honeywell International Inc.
- 6.4.6 Mitsubishi Electric Corp.
- 6.4.7 Robert Bosch GmbH
- 6.4.8 Rockwell Automation Inc.
- 6.4.9 Schneider Electric SE
- 6.4.10 Siemens AG
- 6.4.11 Texas Instruments Inc.
- 6.4.12 Yokogawa Electric Corp.
- 6.4.13 Cisco Systems Inc.
- 6.4.14 IBM Corporation
- 6.4.15 Oracle Corporation
- 6.4.16 SAP SE
- 6.4.17 Johnson Controls Intl. plc
- 6.4.18 PTC Inc.
- 6.4.19 Dassault Systemes SE
- 6.4.20 3D Systems Corp.
- 6.4.21 Stratasys Ltd.
- 6.4.22 Delta Electronics Inc.
- 6.4.23 Capgemini SE
- 6.4.24 Renishaw plc
7 MARKET OPPORTUNITIES AND FUTURE OUTLOOK
- 7.1 White-Space and Unmet-Need Assessment

 歐洲智慧製造:市場佔有率分析、產業趨勢與統計及成長預測(2026-2031)
 雲端製造市場規模、佔有率和成長分析:按部署模式、服務模式、應用、組織規模、最終用戶產業和地區分類-2026-2033年產業預測雲端製造:市場佔有率分析、產業趨勢與統計、成長預測(2026-2031)亞太地區智慧製造:市場佔有率分析、產業趨勢與統計及成長預測(2026-2031年)
 智慧製造市場:2026-2032年全球市場預測(按組件、技術、類型、模組、組織規模、部署類型、應用和最終用途行業分類)智慧製造平台市場:按組件、部署模式、應用程式和最終用戶產業分類-全球預測,2026-2032年
 全球智慧製造市場:按技術、產業和地區分類-預測至2032年
 智慧製造市場規模、佔有率、趨勢和預測:按組件、技術、最終用途和地區分類,2026-2034 年
 智慧製造平台市場:按平台類型、應用和區域分類
 全球智慧製造平台市場規模、佔有率、趨勢和成長分析報告(2026-2034年)