


 |
市場調查報告書
商品編碼
2120583
分散式發電:市場佔有率分析、產業趨勢與統計、成長預測(2026-2031)Distributed Power Generation - Market Share Analysis, Industry Trends & Statistics, Growth Forecasts (2026 - 2031) |
||||||

※ 本網頁內容可能與最新版本有所差異。詳細情況請與我們聯繫。
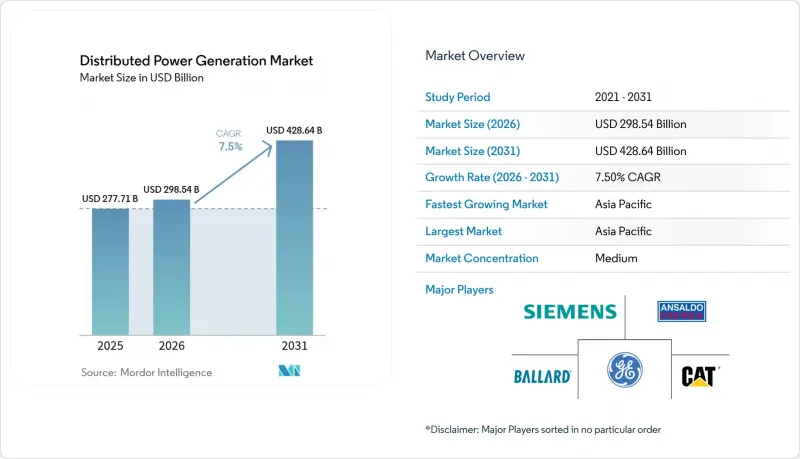
根據 Mordor Intelligence 預測,分散式發電市場規模預計將從 2025 年的 2,777.1 億美元成長到 2026 年的 2,985.4 億美元,並將從 2026 年到 2031 年以 7.5% 的複合年成長率成長,到 2031 年達到 2031 億美元。
本報告按技術(太陽能、風力發電機、燃氣渦輪機、柴油發電機、燃料電池、其他)、額定輸出功率(0-100kW、101-1000kW、超過1000kW)、燃料類型(可再生、不可可再生)、連接方式(併網、離北美地區/遠端)、最終住宅、電信/北美地區用戶(其他住宅和美國地區)。
全球分散式發電市場趨勢與洞察
亞洲小規模太陽能發電的平準化度電成本快速下降
到2024年,拓普康組件在中國的價格已降至每瓦0.16美元,降低了全部區域的平準化度電成本(LCOE),並重塑了分散式太陽能發電的經濟格局。安裝工作的標準化、低成本逆變器和優惠融資進一步放大了這一影響,使亞太地區成為全球小規模太陽能發電的標竿。世界各國政府正在簡化授權程序和併網規則,進一步縮短專案週期。這些價格壓力迫使其他地區的供應商透過提高效率和針對特定應用的設計來脫穎而出。
歐洲商業和工業(CI)用途的後置式電錶迅速普及
歐洲企業正加速推進現場發電,以對沖批發價格波動風險並履行其企業脫碳承諾。在德國,屋頂太陽能板的安裝量已創歷史新高,這與歐盟自2026年起強制要求新建商業建築安裝太陽能板的規定相符,並將於2028年擴展至現有建築的維修。電池儲能系統與太陽能發電相結合,能夠實現負載平衡和輔助服務收益,使分散式資產成為經濟和環境雙重工具。在聯邦稅收優惠和各州清潔能源政策的推動下,北美企業也正在效仿這一模式。
新興國家電力分配網路互聯互通的障礙
全球可再生能源併網申請已超過3000吉瓦,其中80%的申請因成本飆升和冗長的調查而被撤回。由於新興國家電網缺乏最新的標準和人員,小規模工程面臨不成比例的嚴重延誤。儘管目前正在進行改革,以優先考慮準備就緒的項目,但已開發市場以外的進展仍然緩慢,限制了短期部署。
細分市場分析
太陽能發電領域主要面向住宅和小規模商業屋頂安裝,採用簡化的安裝和逆變器套件,預計到2025年將佔銷售額的34.62%。 2025年,太陽能發電在分散式電力市場的佔有率將達到961.3億美元。燃料電池雖然規模仍較小,但其複合運作需求。Caterpillar公司已成功檢驗了一套用於懷俄明州超大規模資料中心的1.5兆瓦氫燃料電池備用系統,服務水準目標達到99.999%。風力微型渦輪機和往復式燃氣引擎也是重要的組成部分,它們被部署在一些對土地利用效率和熱電聯產能力要求較高的特定設施中。目前的競爭焦點並非單一發電硬體本身,而是儲能系統和電力電子設備的整合。
2025年,0-100kW範圍內的住宅和小規模商業系統將佔總需求的46.28%,這反映了其以成套設備採購和承包安裝模式為主的市場需求。就裝機量而言,該細分市場在分散式發電市場中佔據最大佔有率。另一方面,預計到2031年,1000kW以上的解決方案將以9.85%的複合年成長率成長,因為工業園區選擇現場發電以規避電網限制。供應商正透過利用數位孿生和運維分析來最佳化發電,使其與收費系統相匹配,從而實現差異化競爭。針對醫院和大學校園的101-1000kW中型機組方案,在標準化撬裝設備和有限的客製化之間取得了平衡。
區域分析
預計亞太地區將主導分散式發電市場,到2025年將佔據43.55%的銷售佔有率,並維持最高的成長率,到2031年年均複合成長率將達到10.7%。該地區的主導地位得益於大規模生產的太陽能組件、廣泛的政策獎勵以及不斷成長的電力需求。光是2024年,中國的屋頂光電計畫就將新增超過50吉瓦的發電容量,而印度的配電業者正在整合屋頂光電裝置,以創建虛擬電廠。東南亞一些國家的政府已正式推出淨計量計劃,以鼓勵對錶後光伏發電的投資。
北美地區天然氣儲量絕對值排名第二,擁有豐富的天然氣資源和優惠的稅額扣抵。美國市政電力公司在密西根州推出的20兆瓦「表後」計畫就是一個絕佳的例子,它展示了地方政府電力公司如何利用本地發電資源進行抑低尖峰負載。可再生。維吉尼亞、德克薩斯州和亞伯達的資料中心正在積極採用雙燃料和氫燃料相容引擎,進一步提升了該地區的能源需求。
面對地緣政治動盪導致的天然氣供應中斷,歐洲的分散式能源戰略符合能源安全需求。 「歐盟太陽能標準」強制要求自2026年起在新商業建築中安裝太陽能板,鼓勵開發商推廣分散式佈局。在法國,面積超過1500平方公尺的停車場必須至少50%的面積安裝太陽能板,違者最高可被罰款4萬歐元,這項規定正在加速商業不動產的維修。在德國,功率不超過800瓦的「陽台發電裝置」的報名手續已簡化,擴大了私人住宅的參與範圍。另一方面,有關歷史建築的法規以及在城市層級耗時的許可核准流程阻礙了歷史城區的發展。
其他福利
- Excel格式的市場預測(ME)表
- 3個月的分析師支持
目錄
第1章:引言
- 研究假設和市場定義
- 調查範圍
第2章:調查方法
第3章執行摘要
第4章 市場狀況
- 市場概覽
- 市場促進因素
- 亞洲小規模太陽能發電的平準化度電成本快速下降
- 歐洲商業和工業用後置式電錶迅速普及
- 在非洲和島嶼地區的通訊塔中引入微電網
- 北美天然氣價格波動導致沼氣發電機需求改變
- 美國地方政府公共產業可再生能源標準(RPS)
- 中東資料中心氫燃料電池試點項目
- 市場限制因素
- 新興國家電力分配網路互聯互通的障礙
- 為間歇性分散式發電 (DG) 提供資本密集型能源儲存系統系統的組合。
- 歐盟嚴格的氮氧化物和粒狀物排放法規限制了柴油發電機在都市區的銷售。
- 歷史城區屋頂太陽能發電的授權程序複雜
- 供應鏈分析
- 監理展望
- 技術展望
- 波特五力模型
第5章 市場規模與成長預測
- 透過技術
- 太陽能發電(屋頂式和地面式,5兆瓦或以下)
- 風力發電機(5兆瓦或以下)
- 微型渦輪機
- 燃氣渦輪機(50兆瓦或以下)
- 燃料電池(PEMFC、SOFC 等)
- 柴油發電機
- 天然氣發電機
- 水力發電/小規模水力發電(10兆瓦或以下)
- 其他(生質能熱電聯產、史特靈引擎)
- 按類型分類的額定輸出
- 0~100kW
- 101~1,000kW
- 超過1000千瓦
- 按燃料類型
- 可再生
- 不可可再生
- 連結性別
- 併網
- 離網、偏遠地區
- 最終用戶
- 住宅
- 適用於商業和公共機構
- 工業和製造業
- 公共產業和獨立發電商的尖峰負載處理和備用電源供應
- 通訊和資料中心
- 按地區
- 北美洲
- 美國
- 加拿大
- 墨西哥
- 歐洲
- 英國
- 德國
- 法國
- 西班牙
- 北歐國家
- 俄羅斯
- 其他歐洲國家
- 亞太地區
- 中國
- 印度
- 日本
- 韓國
- 馬來西亞
- 泰國
- 印尼
- 越南
- 澳洲
- 其他亞太國家
- 南美洲
- 巴西
- 阿根廷
- 哥倫比亞
- 其他南美國家
- 中東和非洲
- 阿拉伯聯合大公國
- 沙烏地阿拉伯
- 南非
- 埃及
- 其他中東和非洲國家
- 北美洲
第6章 競爭情勢
- 市場集中度
- 策略趨勢(併購、聯盟、購電協議)
- 市場佔有率分析(主要公司的市場排名和市場佔有率)
- 公司簡介
- Caterpillar Inc.
- Cummins Inc.
- Siemens AG
- General Electric Co.
- Schneider Electric SE
- Ansaldo Energia SpA
- Ballard Power Systems Inc.
- Bloom Energy Corp.
- Capstone Turbine Corp.
- FuelCell Energy Inc.
- Rolls-Royce plc(mtu Onsite Energy)
- Aggreko Ltd.
- Yanmar Holdings Co., Ltd.
- Wartsila Corp.
- Kohler Co.
- Canadian Solar Inc.
- Sunverge Energy Inc.
- MTU Aero Engines AG Microgrid Solutions
- Generac Power Systems Inc.
- Plug Power Inc.
第7章 市場機會與未來展望
According to Mordor Intelligence, the distributed power generation market size is expected to grow from USD 277.71 billion in 2025 to USD 298.54 billion in 2026 and is forecast to reach USD 428.64 billion by 2031 at 7.5% CAGR over 2026-2031.
This report is Segmented by Technology (Solar, Wind Turbines, Gas Turbines, Diesel Gensets, Fuel Cells, and More), by Rating (0 To 100 KW, 101 To 1, 000 KW, and More), Fuel Type (Renewable and Non-Renewable), Connectivity (On-Grid and Off-Grid), End-User (Residential, Telecom and Data Centers, and More), and Geography (North America, Europe, Asia-Pacific, South America, and Middle East and Africa).
Global Distributed Power Generation Market Trends and Insights
Rapid Decline in Small-Scale Solar-PV LCOE
Chinese TOPCon module prices fell to USD 0.16 per watt in 2024, driving a region-wide drop in levelized electricity costs and reshaping distributed economics. Installation labor standardization, low-cost inverters, and concessional finance amplify the effect, positioning Asia-Pacific as the global benchmark for small-scale PV. Governments streamline permitting and grid-code rules, further shortening project cycles. The price pressure forces suppliers elsewhere to differentiate on efficiency and application-specific design.
Booming Commercial & Industrial Behind-the-Meter Installations
European firms accelerate on-site generation to hedge volatile wholesale prices and meet corporate decarbonization pledges. Record rooftop additions in Germany follow EU rules that require solar on new commercial buildings from 2026, broadening to retrofits by 2028. Battery systems paired with PV allow load shifting and ancillary service income, making distributed assets a financial and environmental tool. North American businesses replicate the model, spurred by federal tax incentives and state clean-energy mandates.
Distribution-Network Interconnection Barriers in Emerging Economies
Renewables waiting in global interconnection queues exceed 3,000 GW, and 80% of applications are withdrawn due to escalating costs or long studies. Emerging grids lack modern standards and workforce capacity, so small projects face disproportionate delays. Although a "first-ready, first-served" reform is underway, progress outside advanced markets remains slow, restraining near-term deployment.
Other drivers and restraints analyzed in the detailed report include:
- Microgrid Adoption for Telecom Towers across Africa & Islands
- Natural-Gas Price Volatility Shifting Demand toward Biogas Gensets
- Capital-Intensive Energy-Storage Pairing for Intermittent DG
For complete list of drivers and restraints, kindly check the Table Of Contents.
Segment Analysis
The solar segment commanded 34.62% of 2025 revenues, anchored by residential and light-commercial rooftops that capitalize on simplified mounting and inverter kits. Solar's share of the distributed power generation market size for 2025 stood at USD 96.13 billion. Though smaller today, fuel cells deliver the highest 11.25% CAGR, led by projects at data-center campuses where operators seek diesel-free uptime. Caterpillar validated a 1.5 MW hydrogen fuel-cell backup system that met a 99.999% service-level target for a hyperscale facility in Wyoming. Wind micro-turbines and reciprocating gas engines round out the mix, serving niche sites that value either land-use efficiency or combined heat-and-power capability. Competitive dynamics now center on integrating storage and power electronics rather than standalone generation hardware.
Household and small-business systems in the 0-100 kW bracket captured 46.28% of 2025 demand, reflecting kit-based procurement and turnkey installation models. The segment accounted for the largest distributed power generation market share in unit terms. At the other extreme, Above 1,000 kW solutions will record a 9.85% CAGR through 2031 as industrial campuses opt for on-site generation to bypass grid constraints. Vendors differentiate through digital twins and O&M analytics that fine-tune dispatch against utility tariffs. Mid-range 101-1,000 kW packages serve hospitals and university estates, balancing standardized skids with limited custom engineering.
Complete Report Scope:
- By Technology
- Solar Photovoltaic (Rooftop & Ground-Mounted <=5 MW)
- Wind Turbines (<=5 MW)
- Microturbines
- Gas Turbines (<=50 MW)
- Fuel Cells (PEMFC, SOFC, Others)
- Diesel Gensets
- Natural-Gas Gensets
- Hydrokinetic and Small Hydro (<=10 MW)
- Others (Biomass CHP, Stirling Engines)
- By Power Rating
- 0 to 100 kW
- 101 to 1,000 kW
- Above 1,000 kW
- By Fuel Type
- Renewable
- Non-Renewable
- By Connectivity
- On-Grid
- Off-Grid and Remote
- By End-user
- Residential
- Commercial and Institutional
- Industrial and Manufacturing
- Utility and IPP Peaking/Reserve
- Telecom and Data Centers
- By Geography
- North America
- United States
- Canada
- Mexico
- Europe
- United Kingdom
- Germany
- France
- Spain
- Nordic Countries
- Russia
- Rest of Europe
- Asia-Pacific
- China
- India
- Japan
- South Korea
- Malaysia
- Thailand
- Indonesia
- Vietnam
- Australia
- Rest of Asia-Pacific
- South America
- Brazil
- Argentina
- Colombia
- Rest of South America
- Middle East and Africa
- United Arab Emirates
- Saudi Arabia
- South Africa
- Egypt
- Rest of Middle East and Africa
- North America
Geography Analysis
Asia-Pacific dominated the distributed power generation market with a 43.55% revenue share in 2025 and continues to post the fastest 10.7% CAGR to 2031. Regional leadership rests on mass-manufactured PV modules, extensive policy incentives, and surging electricity demand. China's rooftop program alone realized more than 50 GW of new capacity in 2024, while India's distribution utilities aggregate rooftop installations into virtual power plants. Several Southeast Asian governments are formalizing net-billing regimes, unlocking behind-the-meter investment.
North America ranks second in absolute value and combines an abundant natural gas supply with favorable tax credits. American Municipal Power's 20 MW behind-the-meter program in Michigan typifies how municipal utilities leverage local generation for peak shaving. Thirty state-level renewable portfolio standards catalyze solar-plus-storage at schools and municipal facilities. Data-center clusters in Virginia, Texas, and Alberta drive early adoption of dual-fuel or hydrogen-ready engines, further lifting the region's demand profile.
Europe's distributed strategy aligns with energy-security imperatives following geopolitical gas disruptions. The EU Solar Standard obliges new commercial buildings to integrate PV from 2026, pushing developers toward distributed layouts. France mandates 50% solar coverage on parking lots over 1 500 m2, with fines up to EUR 40 000 for non-compliance, accelerating commercial-real-estate retrofits. Germany simplified the registration of "balcony power plants" up to 800 W, broadening household participation. Heritage-site constraints and lengthy city-level permitting temper growth in historic urban cores.
- Caterpillar Inc.
- Cummins Inc.
- Siemens AG
- General Electric Co.
- Schneider Electric SE
- Ansaldo Energia SpA
- Ballard Power Systems Inc.
- Bloom Energy Corp.
- Capstone Turbine Corp.
- FuelCell Energy Inc.
- Rolls-Royce plc (mtu Onsite Energy)
- Aggreko Ltd.
- Yanmar Holdings Co., Ltd.
- Wartsila Corp.
- Kohler Co.
- Canadian Solar Inc.
- Sunverge Energy Inc.
- MTU Aero Engines AG Microgrid Solutions
- Generac Power Systems Inc.
- Plug Power Inc.
Additional Benefits:
- The market estimate (ME) sheet in Excel format
- 3 months of analyst support
TABLE OF CONTENTS
1 Introduction
- 1.1 Study Assumptions & Market Definition
- 1.2 Scope of the Study
2 Research Methodology
3 Executive Summary
4 Market Landscape
- 4.1 Market Overview
- 4.2 Market Drivers
- 4.2.1 Rapid Decline in Small-Scale Solar-PV LCOE in Asia
- 4.2.2 Booming Commercial & Industrial (C&I) Behind-the-Meter Installations in Europe
- 4.2.3 Microgrid Adoption for Telecom Towers across Africa & Islands
- 4.2.4 Natural-Gas Price Volatility Shifting Demand toward Biogas Gensets in North America
- 4.2.5 Mandated Renewable Portfolio Standards (RPS) in U.S. Municipal Utilities
- 4.2.6 Hydrogen-Ready Fuel-Cell Pilots in Middle-East Data Centers
- 4.3 Market Restraints
- 4.3.1 Distribution-Network Interconnection Barriers in Emerging Economies
- 4.3.2 Capital-Intensive Energy-Storage Pairing for Intermittent DG
- 4.3.3 Stringent NOx/PM Limits Curtailing Diesel Genset Sales in EU Urban Areas
- 4.3.4 Complex Permitting for Rooftop PV in Historic City Centers
- 4.4 Supply-Chain Analysis
- 4.5 Regulatory Outlook
- 4.6 Technological Outlook
- 4.7 Porters Five Forces
- 4.7.1 Bargaining Power of Suppliers
- 4.7.2 Bargaining Power of Consumers
- 4.7.3 Threat of New Entrants
- 4.7.4 Threat of Substitute Products & Services
- 4.7.5 Intensity of Competitive Rivalry
5 Market Size & Growth Forecasts
- 5.1 By Technology
- 5.1.1 Solar Photovoltaic (Rooftop & Ground-Mounted <=5 MW)
- 5.1.2 Wind Turbines (<=5 MW)
- 5.1.3 Microturbines
- 5.1.4 Gas Turbines (<=50 MW)
- 5.1.5 Fuel Cells (PEMFC, SOFC, Others)
- 5.1.6 Diesel Gensets
- 5.1.7 Natural-Gas Gensets
- 5.1.8 Hydrokinetic and Small Hydro (<=10 MW)
- 5.1.9 Others (Biomass CHP, Stirling Engines)
- 5.2 By Power Rating
- 5.2.1 0 to 100 kW
- 5.2.2 101 to 1,000 kW
- 5.2.3 Above 1,000 kW
- 5.3 By Fuel Type
- 5.3.1 Renewable
- 5.3.2 Non-Renewable
- 5.4 By Connectivity
- 5.4.1 On-Grid
- 5.4.2 Off-Grid and Remote
- 5.5 By End-user
- 5.5.1 Residential
- 5.5.2 Commercial and Institutional
- 5.5.3 Industrial and Manufacturing
- 5.5.4 Utility and IPP Peaking/Reserve
- 5.5.5 Telecom and Data Centers
- 5.6 By Geography
- 5.6.1 North America
- 5.6.1.1 United States
- 5.6.1.2 Canada
- 5.6.1.3 Mexico
- 5.6.2 Europe
- 5.6.2.1 United Kingdom
- 5.6.2.2 Germany
- 5.6.2.3 France
- 5.6.2.4 Spain
- 5.6.2.5 Nordic Countries
- 5.6.2.6 Russia
- 5.6.2.7 Rest of Europe
- 5.6.3 Asia-Pacific
- 5.6.3.1 China
- 5.6.3.2 India
- 5.6.3.3 Japan
- 5.6.3.4 South Korea
- 5.6.3.5 Malaysia
- 5.6.3.6 Thailand
- 5.6.3.7 Indonesia
- 5.6.3.8 Vietnam
- 5.6.3.9 Australia
- 5.6.3.10 Rest of Asia-Pacific
- 5.6.4 South America
- 5.6.4.1 Brazil
- 5.6.4.2 Argentina
- 5.6.4.3 Colombia
- 5.6.4.4 Rest of South America
- 5.6.5 Middle East and Africa
- 5.6.5.1 United Arab Emirates
- 5.6.5.2 Saudi Arabia
- 5.6.5.3 South Africa
- 5.6.5.4 Egypt
- 5.6.5.5 Rest of Middle East and Africa
- 5.6.1 North America
6 Competitive Landscape
- 6.1 Market Concentration
- 6.2 Strategic Moves (M&A, Partnerships, PPAs)
- 6.3 Market Share Analysis (Market Rank/Share for key companies)
- 6.4 Company Profiles (includes Global level Overview, Market level overview, Core Segments, Financials as available, Strategic Information, Products & Services, and Recent Developments)
- 6.4.1 Caterpillar Inc.
- 6.4.2 Cummins Inc.
- 6.4.3 Siemens AG
- 6.4.4 General Electric Co.
- 6.4.5 Schneider Electric SE
- 6.4.6 Ansaldo Energia SpA
- 6.4.7 Ballard Power Systems Inc.
- 6.4.8 Bloom Energy Corp.
- 6.4.9 Capstone Turbine Corp.
- 6.4.10 FuelCell Energy Inc.
- 6.4.11 Rolls-Royce plc (mtu Onsite Energy)
- 6.4.12 Aggreko Ltd.
- 6.4.13 Yanmar Holdings Co., Ltd.
- 6.4.14 Wartsila Corp.
- 6.4.15 Kohler Co.
- 6.4.16 Canadian Solar Inc.
- 6.4.17 Sunverge Energy Inc.
- 6.4.18 MTU Aero Engines AG Microgrid Solutions
- 6.4.19 Generac Power Systems Inc.
- 6.4.20 Plug Power Inc.
7 Market Opportunities & Future Outlook
- 7.1 White-space & Unmet-Need Assessment

 全球分散式發電市場規模、佔有率、趨勢和成長分析報告(2026-2034)
 電力產業無損檢測 (NDT):市場佔有率分析、產業趨勢與統計數據、成長預測 (2026-2031)民用發電設備:市場佔有率分析、產業趨勢與統計、成長預測(2026-2031 年)
 建築一體化風力發電市場預測至2034年-按安裝類型、容量、技術、應用、最終用戶和地區分類的全球分析
 分散式發電市場:2026-2032年全球市場預測(依技術平台、電網類型、能源來源、容量、所有權、運作模式、最終用戶和安裝位置分類)微電網和社區規模能源系統市場預測至2034年:按容量範圍、所有權/營運模式、技術、應用和區域分類的全球分析商業分散式能源發電:市場佔有率分析、產業趨勢與統計及成長預測(2026-2031 年)2026年電力生產和分散式能源領域十大成長機會
 專屬式物流市場-全球產業規模、佔有率、趨勢、機會、預測:按服務、應用、區域和競爭格局分類,2021-2031年屋頂風力發電市場:全球產業規模、市場佔有率、趨勢、機會和預測(按技術、應用和地區分類)、競爭格局(2021-2031 年)