


 |
市場調查報告書
商品編碼
2113306
民用發電設備:市場佔有率分析、產業趨勢與統計、成長預測(2026-2031 年)Captive Power Plant - Market Share Analysis, Industry Trends & Statistics, Growth Forecasts (2026 - 2031) |
||||||

※ 本網頁內容可能與最新版本有所差異。詳細情況請與我們聯繫。
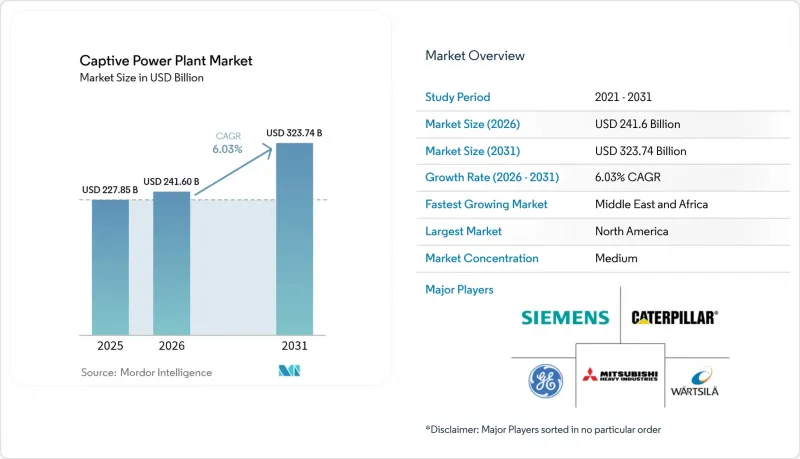
預計到 2026 年,私人發電設備市場規模將達到 2,416 億美元,高於 2025 年的 2,278.5 億美元,預計到 2031 年將達到 3,237.4 億美元。
預計從 2026 年到 2031 年,其複合年成長率將達到 6.03%。
本報告依燃料來源(煤炭、天然氣、柴油/重油、可再生能源、混合動力等)、功率輸出範圍(10 MW 以下、10-50 MW、51-150 MW、150 MW 以上)、技術(往復式引擎、熱電聯產、可再生能源微電網、燃料電池/氫能等)、技術(往復式引擎、熱電聯產、再生能源微電網、燃料電池/氫能等)、水電分類和文化產業數據(北美中心和亞礦產能微電網)。
全球私營發電市場趨勢及洞察
工業用電需求不斷成長,電網卻不穩定
製造業回歸本土、人工智慧的普及以及生產流程的電氣化,正以超過電力公司新建輸電線路速度的速度推動工業負載成長。戰略與國際研究中心(CSIS)預測,未來十年美國冬季用電高峰將增加78吉瓦,將減少電網儲備並增加發電限制的可能性。撒哈拉以南非洲也出現了類似的供應缺口。奈及利亞在2024年創下了6003兆瓦的發電量紀錄,但由於電網限制,其平均輸電量僅5700兆瓦。因此,工業營運商正在建造自己的發電廠,以避免生產損失並從價格邊際收益中獲利。在印度,私人發電設施的供電成本低於每千瓦時5印度盧比,而電網供電成本接近每千瓦時8印度盧比。這種經濟上的價格差異,加上可靠性溢價,正在推動整個私人電力市場的發展。
促進天然氣和可再生能源的脫碳
企業淨零排放承諾正在加速從煤炭和柴油向天然氣和可再生能源的轉型。美國環保署 (EPA) 正在製定的性能標準要求大型燃氣渦輪機在燃氣燃燒過程中將氮氧化物 (NOx) 排放量降低到 3 ppm 以下,這實際上強制要求在新計畫中採用選擇性催化還原 (SCR) 技術。供應商正在積極回應,開發與氫氣相容的設備。例如,GE Vernova 已成功在其 B 級和 E 級機架中展示了 100% 氫氣燃燒,與傳統系統相比,效率提高了 4% 至 7%。雪佛龍在加州進行的 60% 氫氣混合燃料測試等現場試點項目,證明了該方法的技術可行性。這些進展透過降低長期合規風險和簡化低碳專案的資金籌措流程,進一步推動了車載電源市場的發展。
高額資本支出(CAPEX)和營運費用(OPEX)需求
聯合循環和熱電聯產項目的成本在500萬美元到2億美元之間,儘管長期成本節約前景可觀,但資產負債表的限制阻礙了中小企業參與。對於可再生能源微電網至關重要的電池而言,預計到2035年,其資本成本僅能降低18%至52%,這限制了許多專案的短期投資報酬率。雖然租賃和第三方所有權模式存在,但由於其合約複雜性增加,採用這些模式的企業仍集中在信用評級為投資合格的大型企業集團中。這一財務障礙阻礙了資金匱乏地區自用電力市場的擴張。
細分市場分析
到2025年,柴油和重油將佔私人發電市場佔有率的37.15%。這是因為在燃料物流成本高於環境成本的偏遠地區,傳統發電機仍持續為這些地區的營運提供支援。然而,受太陽能發電價格下降和企業脫碳義務的推動,可再生能源正以12.05%的複合年成長率快速成長。雖然柴油發電機具有可靠性高、功率調節迅速的優點,但其高昂的營運成本和排放量意味著用戶將面臨碳排放罰款,這促使人們轉向燃氣發電和將太陽能與電池儲能結合的混合動力系統。
天然氣發電廠作為一種過渡技術,旨在彌合可靠性和排放目標之間的差距,直到氫燃料混合燃料更加普及。燃煤私營電廠正被逐步淘汰,尤其是在實施碳定價機制的市場。混合太陽能發電和儲能計畫正在加速燃料轉型,因為它們的平準化電力成本(LCOE)在島嶼和礦區已與柴油發電廠相當。這些趨勢表明,私營電廠市場正在向可再生能源方向明顯轉變,同時保持其多樣性。
到2025年,鋼鐵、鋁和石化等產業群聚的規模經濟效益將使發電單元裝置容量超過150兆瓦,佔私人發電市場佔有率的33.75%。在多軸聯合循環配置中,透過利用廢熱產生製程蒸氣,整體效率可提高到60%以上。
儘管規模較小,但10兆瓦以下的微型電站預計將實現最高的複合年成長率(CAGR),達到10.86%,這主要得益於標準化貨櫃式機組帶來的更短的前置作業時間和更低的設計成本。這些微型電站非常適合屋頂太陽能發電和能源管理系統,使工廠能夠在無需擴建電網的情況下規避電力成本風險。隨著分散式能源相關法規的不斷完善,許多小規模專案正在匯聚,共同推動企業內部電力市場的擴張。
區域分析
北美36.25%的市佔率主要得益於豐富的頁岩氣資源、成熟的企劃案融資以及資料中心樞紐的強勁需求。預計到2029年,美國電力需求將成長16%,電網連接積壓也將推動這一成長,促使工廠和伺服器集群營運商考慮建造自備電廠。大量的渦輪機訂單積壓有利於那些已預訂設備的領先進入者。同時,加拿大和墨西哥也透過在輸電能力有限的地區投資採礦業和汽車產業,為市場做出貢獻。
歐洲排名第二,其特點是嚴格的排放上限和對汽電共生的慷慨獎勵。隨著布魯塞爾致力於工業脫碳,氫能相容燃氣渦輪機的重要性日益凸顯,而熱電聯產法規也為一體化設施提供了支援。市場參與機制允許出售剩餘電力,進一步提高了專案的盈利。
中東和非洲地區正以10.25%的複合年成長率引領全球成長,這主要得益於產業多元化和零散資源項目的推動。各國政府正在礦區和工業區部署自用型太陽能發電和儲能系統,而天然氣資源豐富的海灣國家則投資建造氫能相容型燃氣渦輪機,以滿足日益成長的電力需求,同時又不影響氣候目標。亞太地區的成長動能主要由中國和印度推動,這兩個國家自發電供應了14%的工業電力消耗,而且成本通常遠低於電力公司。隨著電網負載日益增加,自發電正在填補缺口,從而擴大自發電市場。
其他好處:
- Excel格式的市場預測(ME)表
- 3個月的分析師支持
目錄
第1章:引言
- 研究假設和市場定義
- 調查範圍
第2章:調查方法
第3章執行摘要
第4章 市場狀況
- 市場概覽
- 市場促進因素
- 工業用電需求的成長和電網的不穩定性。
- 促進天然氣和可再生能源的脫碳
- 有利的開放接取和傳輸法規
- 資料中心的快速成長帶來了關鍵任務電力的需求。
- 相容氫氣的燃氣引擎可降低未來遵守監管規定的風險。
- 人工智慧驅動的預測性維護可顯著降低營運成本。
- 市場限制因素
- 需要大量的資本支出(CAPEX)和營運支出(OPEX)。
- 對石化燃料發電廠實施更嚴格的排放標準
- 公司間異地購電協議 (PPA) 的增加,降低了對現場發電的需求。
- 渦輪機和儲能系統供應鏈中的瓶頸導致前置作業時間延長。
- 供應鏈分析
- 監理情勢
- 技術展望
- 波特五力模型
第5章 市場規模與成長預測
- 按燃料來源
- 煤炭
- 天然氣
- 柴油/重質燃料油(HFO)
- 可再生能源(太陽能、風能、生質能、熱能回收)
- 混合型及其他
- 按生產能力範圍分類
- 10兆瓦或以下
- 10~50 MW
- 51~150 MW
- 150兆瓦或以上
- 透過技術
- 燃氣渦輪機
- 往復式引擎
- 熱電聯產(CHP)
- 可再生能源微電網(光伏/風能+電池儲能系統)
- 燃料電池/氫
- 按行業
- 水泥
- 金屬和礦物(包括鐵和鋼)
- 石油化學產品
- 資料中心
- 紙漿和造紙
- 其他
- 按地區
- 北美洲
- 美國
- 加拿大
- 墨西哥
- 歐洲
- 德國
- 英國
- 法國
- 義大利
- 俄羅斯
- 其他歐洲國家
- 亞太地區
- 中國
- 印度
- 日本
- 韓國
- 東南亞國協
- 其他亞太國家
- 南美洲
- 巴西
- 阿根廷
- 其他南美國家
- 中東和非洲
- 沙烏地阿拉伯
- 阿拉伯聯合大公國
- 南非
- 埃及
- 其他中東和非洲國家
- 北美洲
第6章 競爭情勢
- 市場集中度
- 策略趨勢(併購、聯盟、購電協議)
- 市場佔有率分析(主要公司的市場排名和佔有率)
- 公司簡介
- General Electric Company
- Siemens AG
- Wartsila Oyj Abp
- Caterpillar Inc.
- Mitsubishi Heavy Industries Ltd.
- Bharat Heavy Electricals Ltd.
- Kohler Co.
- Cummins Inc.
- ABB Ltd.
- Schneider Electric SE
- INNIO(GE Jenbacher)
- Capstone Green Energy Corp.
- Tata Power Renewable Energy
- AMP Solar Group Inc.
- JSW Energy Ltd.
- Vedanta Ltd.
- Jindal Steel & Power Ltd.
- ArcelorMittal SA
- Adani Power Ltd.
- Capital Power Corp.
- Rolls-Royce Holdings plc(mtu)
- Clarke Energy
- APR Energy
- MAN Energy Solutions SE
第7章 市場機會與未來展望
According to Mordor Intelligence, captive power plant market size in 2026 is estimated at USD 241.6 billion, growing from 2025 value of USD 227.85 billion with 2031 projections showing USD 323.74 billion, growing at 6.03% CAGR over 2026-2031.
This report is Segmented by Fuel Source (Coal, Natural Gas, Diesel/HFO, Renewable, and Hybrid and Others), Capacity Range ( Up To 10 MW, 10 To 50 MW, 51 To 150 MW, and Above 150 MW), Technology (Reciprocating Engine, Combined Heat and Power, Renewable Microgrid, Fuel Cells/Hydrogen, and More), Industry (Metals and Minerals, Data Centre, and More), and Geography (North America, Asia-Pacific, and More).
Global Captive Power Plant Market Trends and Insights
Growing Industrial Electricity Demand & Unreliable Grids
Manufacturing reshoring, AI deployment, and process electrification are increasing industrial loads faster than utilities can build new transmission lines. CSIS projects that U.S. winter-peak demand will climb by 78 GW within a decade, eroding grid reserves and raising the probability of curtailments. Similar supply gaps emerge in Sub-Saharan Africa, where Nigeria generated a record 6,003 MW in 2024 but could dispatch only 5,700 MW on average due to network constraints. Industrial operators, therefore, install on-site plants to avoid lost production and to arbitrage tariffs; in India, captive units deliver power at rates below INR 5/kWh, compared to grid rates of nearly INR 8/kWh. This economic spread, coupled with reliability premiums, reinforces adoption across the captive power plant market.
Carbon-Reduction Push Toward Gas & Renewables
Corporate net-zero pledges are accelerating the shift away from coal and diesel toward natural gas and renewable energy configurations. The U.S. EPA's pending performance standards require large combustion turbines to meet a 3 ppm NOx limit on gas, effectively forcing the use of selective catalytic reduction for new projects. Equipment vendors responded with hydrogen-compatible machines; GE Vernova validated 100% H2 firing on its B- and E-class frames, achieving 4%-7% efficiency gains compared to legacy systems. Field pilots, such as Chevron's 60% hydrogen blend test in California, prove the pathway's technical feasibility. These developments lower long-term compliance risks and make low-carbon project financing more accessible, giving further momentum to the captive power plant market.
High CAPEX & OPEX Requirements
Combined-cycle and CHP projects can range from USD 5 million to USD 200 million, and balance-sheet constraints deter small firms despite the attractive long-term savings. Battery storage, vital for renewable microgrids, will only see 18%-52% capital-cost relief by 2035, limiting near-term ROI for many sites. Lease and third-party ownership models exist but add contractual complexity, so penetration remains skewed toward large conglomerates with investment-grade ratings. This financial hurdle curbs the captive power plant market in capital-scarce regions.
Other drivers and restraints analyzed in the detailed report include:
- Favourable Open-Access & Wheeling Regulations
- Data-Center Boom Demanding Mission-Critical Power
- Tightening Emission Norms on Fossil CPPs
For complete list of drivers and restraints, kindly check the Table Of Contents.
Segment Analysis
Diesel and heavy fuel oil retained 37.15% of the captive power plant market share in 2025, as legacy generators continue to backstop operations in remote areas where fuel logistics outweigh environmental costs. Renewable options, however, are scaling fastest at a projected 12.05% CAGR, propelled by falling solar-PV prices and corporate decarbonization mandates. Diesel units deliver tried-and-tested reliability and rapid ramping, yet their high operating cost and emissions expose users to carbon penalties, prompting a pivot toward gas and hybrid solar-battery architectures.
Natural-gas plants serve as a transitional technology, bridging the gap between reliability and emission objectives until hydrogen blends become more commonplace. Coal-based captive assets are moving toward strategic retirement, especially in markets with carbon pricing. Hybrid solar-storage projects reach parity with diesel on a levelized-cost basis in island and mining jurisdictions, accelerating fuel switching. These dynamics keep the captive power plant market diversified yet clearly trending toward renewables.
Units above 150 MW captured 33.75% of the captive power plant market size in 2025, thanks to economies of scale that suit steel, aluminum, and petrochemical clusters. Multi-shaft combined-cycle configurations utilize exhaust heat to generate process steam, thereby increasing overall efficiencies to above 60%.
Installations under 10 MW, although smaller, will clock the fastest 10.86% CAGR as standardized, containerized sets shorten lead times and reduce engineering costs. These micro-plants pair well with rooftop solar and energy-management systems, providing factories with tariff hedges without requiring grid expansion. As distributed energy resource rules evolve, numerous small projects collectively expand the captive power plant market.
Complete Report Scope:
- By Fuel Source
- Coal
- Natural Gas
- Diesel/HFO
- Renewable (Solar, Wind, Biomass, WHR)
- Hybrid and Others
- By Capacity Range
- Up to 10 MW
- 10 to 50 MW
- 51 to 150 MW
- Above 150 MW
- By Technology
- Gas Turbine
- Reciprocating Engine
- Combined Heat and Power (CHP)
- Renewable Microgrid (PV/Wind + BESS)
- Fuel Cells/Hydrogen
- By Industry
- Cement
- Metals and Minerals (incl Steel)
- Petrochemicals
- Data Centres
- Pulp and Paper
- Others
- By Geography
- North America
- United States
- Canada
- Mexico
- Europe
- Germany
- United Kingdom
- France
- Italy
- Russia
- Rest of Europe
- Asia-Pacific
- China
- India
- Japan
- South Korea
- ASEAN Countries
- Rest of Asia-Pacific
- South America
- Brazil
- Argentina
- Rest of South America
- Middle East and Africa
- Saudi Arabia
- United Arab Emirates
- South Africa
- Egypt
- Rest of Middle East and Africa
- North America
Geography Analysis
North America's 36.25% share is based on abundant shale gas, sophisticated project finance, and robust demand from data center hubs. U.S. electricity growth of 16% by 2029, confirmed by pipeline interconnection queues, underlines why factory and server-farm operators turn to on-site plants. High turbine backlogs favor early movers with equipment reservations, while Canada and Mexico contribute via mining and automotive investments in regions with constrained transmission.
Europe ranks second, characterized by stringent emission caps and generous incentives for cogeneration. Hydrogen-ready gas turbines gain prominence as Brussels targets industrial decarbonization, and combined-heat-and-power rules support integrated sites. Market participation mechanisms allow surplus power sales, further monetizing projects.
The Middle East & Africa region heads global growth at a 10.25% CAGR, fueled by industrial diversification and isolated resource projects. Governments deploy captive solar-plus-storage systems at mining camps and industrial zones, while natural-gas-rich Gulf states invest in hydrogen-ready turbines to meet load growth without derailing climate goals. Asia-Pacific's momentum rests on China and India, where captive generation supplies 14% of total industrial consumption and often beats utility tariffs by a wide margin. As grids strain, self-generation fills the gap, enlarging the captive power plant market.
- General Electric Company
- Siemens AG
- Wartsila Oyj Abp
- Caterpillar Inc.
- Mitsubishi Heavy Industries Ltd.
- Bharat Heavy Electricals Ltd.
- Kohler Co.
- Cummins Inc.
- ABB Ltd.
- Schneider Electric SE
- INNIO (GE Jenbacher)
- Capstone Green Energy Corp.
- Tata Power Renewable Energy
- AMP Solar Group Inc.
- JSW Energy Ltd.
- Vedanta Ltd.
- Jindal Steel & Power Ltd.
- ArcelorMittal SA
- Adani Power Ltd.
- Capital Power Corp.
- Rolls-Royce Holdings plc (mtu)
- Clarke Energy
- APR Energy
- MAN Energy Solutions SE
Additional Benefits:
- The market estimate (ME) sheet in Excel format
- 3 months of analyst support
TABLE OF CONTENTS
1 Introduction
- 1.1 Study Assumptions & Market Definition
- 1.2 Scope of the Study
2 Research Methodology
3 Executive Summary
4 Market Landscape
- 4.1 Market Overview
- 4.2 Market Drivers
- 4.2.1 Growing industrial electricity demand & unreliable grids
- 4.2.2 Carbon-reduction push toward gas & renewables
- 4.2.3 Favourable open-access & wheeling regulations
- 4.2.4 Data-centre boom demanding mission-critical power
- 4.2.5 Hydrogen-ready gas engines cut future compliance risk
- 4.2.6 AI-enabled predictive maintenance slashes OPEX
- 4.3 Market Restraints
- 4.3.1 High CAPEX & OPEX requirements
- 4.3.2 Tightening emission norms on fossil CPPs
- 4.3.3 Rise of off-site corporate PPAs reduces captive need
- 4.3.4 Turbine/BESS supply-chain bottlenecks lengthen lead-times
- 4.4 Supply-Chain Analysis
- 4.5 Regulatory Landscape
- 4.6 Technological Outlook
- 4.7 Porter's Five Forces
- 4.7.1 Bargaining Power of Suppliers
- 4.7.2 Bargaining Power of Buyers
- 4.7.3 Threat of New Entrants
- 4.7.4 Threat of Substitutes
- 4.7.5 Competitive Rivalry
5 Market Size & Growth Forecasts
- 5.1 By Fuel Source
- 5.1.1 Coal
- 5.1.2 Natural Gas
- 5.1.3 Diesel/HFO
- 5.1.4 Renewable (Solar, Wind, Biomass, WHR)
- 5.1.5 Hybrid and Others
- 5.2 By Capacity Range
- 5.2.1 Up to 10 MW
- 5.2.2 10 to 50 MW
- 5.2.3 51 to 150 MW
- 5.2.4 Above 150 MW
- 5.3 By Technology
- 5.3.1 Gas Turbine
- 5.3.2 Reciprocating Engine
- 5.3.3 Combined Heat and Power (CHP)
- 5.3.4 Renewable Microgrid (PV/Wind + BESS)
- 5.3.5 Fuel Cells/Hydrogen
- 5.4 By Industry
- 5.4.1 Cement
- 5.4.2 Metals and Minerals (incl Steel)
- 5.4.3 Petrochemicals
- 5.4.4 Data Centres
- 5.4.5 Pulp and Paper
- 5.4.6 Others
- 5.5 By Geography
- 5.5.1 North America
- 5.5.1.1 United States
- 5.5.1.2 Canada
- 5.5.1.3 Mexico
- 5.5.2 Europe
- 5.5.2.1 Germany
- 5.5.2.2 United Kingdom
- 5.5.2.3 France
- 5.5.2.4 Italy
- 5.5.2.5 Russia
- 5.5.2.6 Rest of Europe
- 5.5.3 Asia-Pacific
- 5.5.3.1 China
- 5.5.3.2 India
- 5.5.3.3 Japan
- 5.5.3.4 South Korea
- 5.5.3.5 ASEAN Countries
- 5.5.3.6 Rest of Asia-Pacific
- 5.5.4 South America
- 5.5.4.1 Brazil
- 5.5.4.2 Argentina
- 5.5.4.3 Rest of South America
- 5.5.5 Middle East and Africa
- 5.5.5.1 Saudi Arabia
- 5.5.5.2 United Arab Emirates
- 5.5.5.3 South Africa
- 5.5.5.4 Egypt
- 5.5.5.5 Rest of Middle East and Africa
- 5.5.1 North America
6 Competitive Landscape
- 6.1 Market Concentration
- 6.2 Strategic Moves (M&A, Partnerships, PPAs)
- 6.3 Market Share Analysis (Market Rank/Share for key companies)
- 6.4 Company Profiles (includes Global level Overview, Market level overview, Core Segments, Financials as available, Strategic Information, Products & Services, and Recent Developments)
- 6.4.1 General Electric Company
- 6.4.2 Siemens AG
- 6.4.3 Wartsila Oyj Abp
- 6.4.4 Caterpillar Inc.
- 6.4.5 Mitsubishi Heavy Industries Ltd.
- 6.4.6 Bharat Heavy Electricals Ltd.
- 6.4.7 Kohler Co.
- 6.4.8 Cummins Inc.
- 6.4.9 ABB Ltd.
- 6.4.10 Schneider Electric SE
- 6.4.11 INNIO (GE Jenbacher)
- 6.4.12 Capstone Green Energy Corp.
- 6.4.13 Tata Power Renewable Energy
- 6.4.14 AMP Solar Group Inc.
- 6.4.15 JSW Energy Ltd.
- 6.4.16 Vedanta Ltd.
- 6.4.17 Jindal Steel & Power Ltd.
- 6.4.18 ArcelorMittal SA
- 6.4.19 Adani Power Ltd.
- 6.4.20 Capital Power Corp.
- 6.4.21 Rolls-Royce Holdings plc (mtu)
- 6.4.22 Clarke Energy
- 6.4.23 APR Energy
- 6.4.24 MAN Energy Solutions SE
7 Market Opportunities & Future Outlook
- 7.1 White-Space & Unmet-Need Assessment

 全球分散式發電市場規模、佔有率、趨勢和成長分析報告(2026-2034)
 電力產業無損檢測 (NDT):市場佔有率分析、產業趨勢與統計數據、成長預測 (2026-2031)分散式發電:市場佔有率分析、產業趨勢與統計、成長預測(2026-2031)
 建築一體化風力發電市場預測至2034年-按安裝類型、容量、技術、應用、最終用戶和地區分類的全球分析
 分散式發電市場:2026-2032年全球市場預測(依技術平台、電網類型、能源來源、容量、所有權、運作模式、最終用戶和安裝位置分類)微電網和社區規模能源系統市場預測至2034年:按容量範圍、所有權/營運模式、技術、應用和區域分類的全球分析商業分散式能源發電:市場佔有率分析、產業趨勢與統計及成長預測(2026-2031 年)2026年電力生產和分散式能源領域十大成長機會
 專屬式物流市場-全球產業規模、佔有率、趨勢、機會、預測:按服務、應用、區域和競爭格局分類,2021-2031年屋頂風力發電市場:全球產業規模、市場佔有率、趨勢、機會和預測(按技術、應用和地區分類)、競爭格局(2021-2031 年)