

 |
市場調查報告書
商品編碼
2062471
商業分散式能源發電:市場佔有率分析、產業趨勢與統計及成長預測(2026-2031 年)Commercial Distributed Energy Generation - Market Share Analysis, Industry Trends & Statistics, Growth Forecasts (2026 - 2031) |
||||||
※ 本網頁內容可能與最新版本有所差異。詳細情況請與我們聯繫。
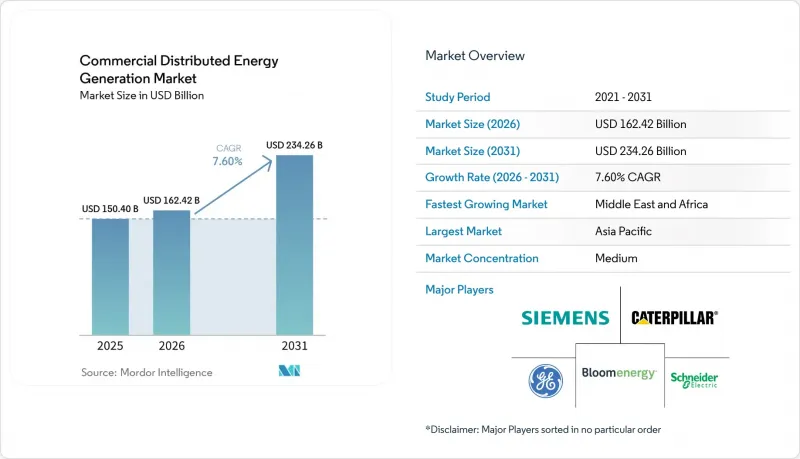
據 Mordor Intelligence 稱,2025 年商業分散式能源發電市場價值為 1504 億美元,預計到 2031 年將達到 2342.6 億美元,而 2026 年為 1624.2 億美元,預測期(2026-2031 年)複合年成長率為 7.60%。
本報告按技術(太陽能、風力發電機、燃料電池、熱電汽電共生、分散式能源與電池相結合等)、應用(辦公大樓、零售設施、資料中心、教育機構、醫院、倉庫、機場等)和地區(北美、歐洲、亞太、南美以及中東和非洲)進行細分。市場預測以美元計價。
全球商業分散式能源發電市場趨勢及洞察
太陽能和風能的平準化度電成本下降
2025年,大規模太陽能發電的平準化能源成本(LCOE)將達到每兆瓦時29美元,在日照充足的地區,商業屋頂太陽能系統的成本將達到每兆瓦時50至70美元,低於美國23個州的零售電費。儘管中國多晶矽供應過剩導致組件現貨價格跌破每瓦0.10美元,但快速切割電子元件的引入已使安裝人工成本降低了30%。因此,企業可以在固定價格購電協議(PPA)和自籌資金建設太陽能發電系統之間進行選擇,預計投資回報期為4至6年。正是由於成本的降低,太陽能發電成為商業分散式能源發電市場中成長最快的領域。
企業可再生能源購電協議及淨零排放目標
2025年底,全球企業可再生能源購電協議(PPA)累計總量將達50吉瓦,其中60%將在北美和歐洲簽訂。諸如穀歌與道達爾能源公司簽訂的1吉瓦合約以及微軟與布魯克菲爾德公司夥伴關係的10.5吉瓦項目等組合規模的交易,融合了多種技術,並要求開發商安裝2-4小時的電池儲能系統。全天候供應清潔能源的義務將間歇性風險轉移給了買方,使購電協議對專案而言更具資金籌措可行性,並促進了商業設施中分散式資產的採用。
初始投資額高,投資回收期長
在美國,商業太陽能發電成本維持在每瓦1.57美元,而燃料電池熱電汽電共生(CHP)成本則高達每瓦6美元。這相當於數百萬美元的投資,而中小企業很少能負擔得起。雖然能源即服務(EAaS)合約消除了資金壁壘,但卻將合格評級不達標的客戶拒之門外,導致60%的潛在買家無法獲得這項服務。
細分市場分析
至2025年,燃料電池將佔商業分散式能源發電市場佔有率的37.6%。這反映了燃料電池在醫院、資料中心和需要不間斷供熱供電的工業設施中的價值。 Bloom Energy已在Equinix的設施安裝了超過100兆瓦的燃料電池,並在懷俄明州獲得了一份900兆瓦的氫能發電合約。這些舉措凸顯了該公司在該領域的領先地位。太陽能發電領域正在快速擴張,預計到2031年,隨著組件價格降至每瓦0.10美元以下,其複合年成長率將達到14.4%。將屋頂太陽能發電與2-4小時的電池儲能結合,可顯著降低尖峰時段對電網的依賴,從而降低需求費用,並將投資回收期縮短至5-6年。
風力發電機仍然是一個小眾市場。這是因為分區法規限制了100-500千瓦級設備的安裝,只能在能夠確保足夠安全距離(與場地邊界的距離)的工業園區內進行。同時,採用微型渦輪機和往復式引擎的混合系統在離網採礦和農業等商業應用場景中仍然佔據主導地位。預計到2025年,電池價格將降至每千瓦時120美元,屆時,採用1-2小時儲能系統作為附加設備而非獨立系統,將鞏固太陽能作為商業分散式能源發電市場預設成長引擎的地位。同時,氫能熱電聯產(CHP)提供了一條在不犧牲可擴展性的前提下實現顯著脫碳的途徑,這一特性可能會使燃料電池在整個預測期內保持重要性。
區域分析
到2025年,亞太地區將佔全球銷售額的45.3%,成為市場的主要驅動力。光是在中國,到2025年就將新增18吉瓦的商業屋頂太陽能發電裝置容量,新建工業園區將被要求實現20%至30%的現場可再生能源發電裝置容量。印度的開放式接取改革將允許企業無需透過配電公司即可供電,預計到2025年,該國的商業分散式能源市場將以每年35%的速度成長。東南亞國協正利用當地銀行和發展金融機構填補160億美元的資金缺口,以釋放屋頂太陽能發電的潛力。
預計到2031年,中東和非洲地區的年複合成長率將達到13.1%,成為全球成長最快的地區。海灣國家正在部署太陽能發電和儲能結合的系統,以確保天然氣出口供應。同時,南非、肯亞和奈及利亞則依賴柴油和太陽能混合發電系統來維持運作,因為在這些國家,工業用電佔比不到60%。
2025年,北美仍將佔據商業分散式能源發電市場的大部分佔有率,但長達三年的併網等待時間和稅額扣抵,正在減緩市場發展勢頭。在歐洲,德國和西班牙低壓饋線的飽和導致電網升級成本高。南美洲除巴西和智利以外,其他地區仍在發展中,但阿根廷於2025年實施的放鬆管制改革可能會從2027年起加速分散式能源的普及。
其他好處:
- Excel格式的市場預測(ME)表
- 3個月的分析師支持
目錄
第1章:引言
- 研究假設和市場定義
- 調查範圍
第2章:調查方法
第3章執行摘要
第4章 市場狀況
- 市場概覽
- 市場促進因素
- 太陽能和風能的平準化度電成本下降
- 企業可再生能源購電協議及淨零排放目標
- 淨計量和擴大投資稅收抵免型獎勵
- 電力中斷風險增加,導致對電力系統韌性的需求增加。
- 基於人工智慧的分散式能源(DER)編配平台
- 利用燃料電池實現與氫氣相容的微型汽電共生
- 市場限制因素
- 初始投資額高,投資回收期長
- 不斷發展的互聯互通和日益複雜的收費系統
- 配電網路接收能力飽和
- 對太陽能和風能發電供應鏈中ESG可追溯性的審查
- 供應鏈分析
- 監理情勢
- 技術展望
- 波特五力模型
第5章 市場規模與成長預測
- 透過技術
- 太陽能
- 風力發電機
- 燃料電池
- 熱電聯產(CHP)
- 電池連接的分散式能源(DER)
- 其他
- 透過使用
- 辦公大樓
- 零售店
- 資料中心
- 教育機構
- 醫院
- 倉庫和物流中心
- 機場和交通樞紐
- 其他(包括校園和酒店)
- 按地區
- 北美洲
- 美國
- 加拿大
- 墨西哥
- 歐洲
- 英國
- 德國
- 法國
- 西班牙
- 北歐國家
- 俄羅斯
- 其他歐洲國家
- 亞太地區
- 中國
- 印度
- 日本
- 韓國
- 東南亞國協
- 澳洲和紐西蘭
- 其他亞太國家
- 南美洲
- 巴西
- 阿根廷
- 哥倫比亞
- 其他南美國家
- 中東和非洲
- 阿拉伯聯合大公國
- 沙烏地阿拉伯
- 南非
- 埃及
- 其他中東和非洲國家
- 北美洲
第6章 競爭情勢
- 市場集中度
- 策略趨勢(併購、聯盟、購電協議)
- 市場佔有率分析(主要公司的市場排名和佔有率)
- 公司簡介
- Siemens AG
- Schneider Electric
- Caterpillar Inc.
- General Electric(GE Vernova)
- Bloom Energy
- Sunnova Energy
- Enel X
- Aggreko Ltd
- Eaton Corporation
- Tesla Energy
- ABB Ltd.
- Johnson Controls
- Engie SA
- Cummins Inc.
- Wartsila Corporation
- Capstone Green Energy
- Generac Power Systems
- Vicinity Energy
- Veolia(Microgrids)
- NextEra Energy Resources
第7章 市場機會與未來展望
According to Mordor Intelligence, the commercial distributed energy generation market size was valued at USD 150.40 billion in 2025 and is estimated to grow from USD 162.42 billion in 2026 to reach USD 234.26 billion by 2031, at a CAGR of 7.60% during the forecast period (2026-2031).
This report is Segmented by Technology (Solar PV, Wind Turbines, Fuel Cells, CHP, Battery-Storage-Coupled DER, Others), Application (Office Buildings, Retail, Data Centers, Educational Institutions, Hospitals, Warehouses, Airports, Others), and Geography (North America, Europe, Asia-Pacific, South America, Middle East and Africa). Market Forecasts are Provided in Value (USD).
Global Commercial Distributed Energy Generation Market Trends and Insights
Declining LCOE of Solar PV & Wind
Utility-scale solar reached USD 29 per MWh in 2025, and commercial rooftop systems now deliver USD 50-70 per MWh in high-insolation zones, undercutting retail tariffs in 23 U.S. states. Chinese polysilicon oversupply pushed spot module prices below USD 0.10 per watt, while rapid-shutdown electronics trimmed installation labor by 30%. Companies, therefore, face a choice between fixed-rate PPAs and self-financed arrays with four-to-six-year paybacks. The fall in costs explains why solar is the fastest-growing slice of the commercial distributed energy generation market.
Corporate Renewable PPAs & Net-Zero Targets
Cumulative corporate renewable PPAs reached 50 GW worldwide by end-2025, 60% of which originated in North America and Europe. Portfolio-scale deals such as Google's 1 GW contract with TotalEnergies and Microsoft's 10.5 GW partnership with Brookfield bundle multiple technologies and oblige developers to add two-to-four-hour batteries. Because the obligation to deliver round-the-clock clean power shifts intermittency risk away from the buyer, PPAs accelerate project bankability and drive deeper penetration of distributed assets on commercial sites.
High Upfront CAPEX & Long Payback Period
Commercial solar still costs USD 1.57 per watt in the United States, and fuel-cell CHP reaches USD 6.00 per watt, translating to multi-million-dollar investments that small businesses rarely self-finance. Energy-as-a-service contracts remove capital barriers but exclude customers lacking investment-grade credit, leaving 60% of potential offtakers unserved.
Other drivers and restraints analyzed in the detailed report include:
- Extension of Net-Metering & ITC-Type Incentives
- Resilience Demand Amid Rising Grid Outage Risks
- Distribution-Grid Hosting-Capacity Saturation
For complete list of drivers and restraints, kindly check the Table Of Contents.
Segment Analysis
Fuel cells captured 37.6% of the commercial distributed energy generation market share in 2025, reflecting their value in hospitals, data centers, and industrial sites that need uninterrupted heat and power. Bloom Energy deployed more than 100 MW at Equinix facilities and lined up a 900 MW hydrogen-ready contract in Wyoming, moves that underpin its leadership. The solar segment is scaling faster, expanding at a 14.4% CAGR to 2031 as module prices dip below USD 0.10 per watt. Coupling rooftop PV with two-to-four-hour batteries slashes dependence on grid imports during evening peaks and trims demand charges, hastening payback to five to six years.
Wind turbines remain niche because zoning rules restrict 100-500 kW machines to industrial campuses with generous setbacks, while microturbine and reciprocating-engine hybrids continue to dominate off-grid mining and agribusiness use cases. Battery prices falling to USD 120 per kWh in 2025 spur adoption of one-to-two-hour storage as an add-on rather than a standalone system, reinforcing solar's position as the default growth engine in the commercial distributed energy generation market context. In parallel, hydrogen-blended CHP offers a pathway to deep decarbonization without sacrificing dispatchability, a feature that could preserve fuel-cell relevance during the forecast period.
Geography Analysis
Asia-Pacific dominated with 45.3% revenue in 2025. China alone installed 18 GW of commercial rooftop solar in 2025 and mandates 20-30% on-site renewables within new industrial parks. India's open-access reforms let corporations bypass distribution companies and have propelled the commercial distributed energy generation market in the country to 35% annual growth during 2025. ASEAN economies are filling a USD 16 billion financing gap with local banks and development finance institutions to unlock rooftop potential.
The Middle East and Africa are forecast to grow at 13.1% CAGR to 2031, the fastest worldwide. Gulf states deploy solar-plus-storage to free natural gas for export, while South Africa, Kenya, and Nigeria rely on diesel-solar hybrids to maintain uptime amid grids that serve industry less than 60% of the time.
North America retained a significant share of the commercial distributed energy generation market in 2025, but interconnection queues stretching up to three years and the scheduled sunset of federal tax credits after 2027 weigh on momentum. Europe's saturation of low-voltage feeders in Germany and Spain forces costly grid upgrades. South America remains nascent outside Brazil and Chile, though Argentina's liberalizing reforms in 2025 could accelerate adoption after 2027.
- Siemens AG
- Schneider Electric
- Caterpillar Inc.
- General Electric (GE Vernova)
- Bloom Energy
- Sunnova Energy
- Enel X
- Aggreko Ltd
- Eaton Corporation
- Tesla Energy
- ABB Ltd.
- Johnson Controls
- Engie SA
- Cummins Inc.
- Wartsila Corporation
- Capstone Green Energy
- Generac Power Systems
- Vicinity Energy
- Veolia (Microgrids)
- NextEra Energy Resources
Additional Benefits:
- The market estimate (ME) sheet in Excel format
- 3 months of analyst support
TABLE OF CONTENTS
1 Introduction
- 1.1 Study Assumptions & Market Definition
- 1.2 Scope of the Study
2 Research Methodology
3 Executive Summary
4 Market Landscape
- 4.1 Market Overview
- 4.2 Market Drivers
- 4.2.1 Declining LCOE of Solar PV & Wind
- 4.2.2 Corporate renewable PPAs & net-zero targets
- 4.2.3 Extension of net-metering & ITC-type incentives
- 4.2.4 Resilience demand amid rising grid outage risks
- 4.2.5 AI-enabled DER orchestration platforms
- 4.2.6 Hydrogen-ready micro-cogeneration with fuel cells
- 4.3 Market Restraints
- 4.3.1 High upfront CAPEX & long payback period
- 4.3.2 Evolving interconnection & tariff complexity
- 4.3.3 Distribution-grid hosting-capacity saturation
- 4.3.4 ESG traceability scrutiny for PV & wind supply chains
- 4.4 Supply-Chain Analysis
- 4.5 Regulatory Landscape
- 4.6 Technological Outlook
- 4.7 Porter's Five Forces
- 4.7.1 Threat of New Entrants
- 4.7.2 Bargaining Power of Suppliers
- 4.7.3 Bargaining Power of Buyers
- 4.7.4 Threat of Substitutes
- 4.7.5 Competitive Rivalry
5 Market Size & Growth Forecasts
- 5.1 By Technology
- 5.1.1 Solar PV
- 5.1.2 Wind Turbines
- 5.1.3 Fuel Cells
- 5.1.4 Combined Heat and Power (CHP)
- 5.1.5 Battery-Storage-Coupled DER
- 5.1.6 Others
- 5.2 By Application
- 5.2.1 Office Buildings
- 5.2.2 Retail Stores
- 5.2.3 Data Centers
- 5.2.4 Educational Institutions
- 5.2.5 Hospitals
- 5.2.6 Warehouses and Logistics Centres
- 5.2.7 Airports and Transport Hubs
- 5.2.8 Others (incl campuses, hotels)
- 5.3 By Geography
- 5.3.1 North America
- 5.3.1.1 United States
- 5.3.1.2 Canada
- 5.3.1.3 Mexico
- 5.3.2 Europe
- 5.3.2.1 United Kingdom
- 5.3.2.2 Germany
- 5.3.2.3 France
- 5.3.2.4 Spain
- 5.3.2.5 Nordic Countries
- 5.3.2.6 Russia
- 5.3.2.7 Rest of Europe
- 5.3.3 Asia-Pacific
- 5.3.3.1 China
- 5.3.3.2 India
- 5.3.3.3 Japan
- 5.3.3.4 South Korea
- 5.3.3.5 ASEAN Countries
- 5.3.3.6 Australia and New Zealand
- 5.3.3.7 Rest of Asia-Pacific
- 5.3.4 South America
- 5.3.4.1 Brazil
- 5.3.4.2 Argentina
- 5.3.4.3 Colombia
- 5.3.4.4 Rest of South America
- 5.3.5 Middle East and Africa
- 5.3.5.1 United Arab Emirates
- 5.3.5.2 Saudi Arabia
- 5.3.5.3 South Africa
- 5.3.5.4 Egypt
- 5.3.5.5 Rest of Middle East and Africa
- 5.3.1 North America
6 Competitive Landscape
- 6.1 Market Concentration
- 6.2 Strategic Moves (M&A, Partnerships, PPAs)
- 6.3 Market Share Analysis (Market Rank/Share for key companies)
- 6.4 Company Profiles (includes Global level Overview, Market level overview, Core Segments, Financials as available, Strategic Information, Products & Services, and Recent Developments)
- 6.4.1 Siemens AG
- 6.4.2 Schneider Electric
- 6.4.3 Caterpillar Inc.
- 6.4.4 General Electric (GE Vernova)
- 6.4.5 Bloom Energy
- 6.4.6 Sunnova Energy
- 6.4.7 Enel X
- 6.4.8 Aggreko Ltd
- 6.4.9 Eaton Corporation
- 6.4.10 Tesla Energy
- 6.4.11 ABB Ltd.
- 6.4.12 Johnson Controls
- 6.4.13 Engie SA
- 6.4.14 Cummins Inc.
- 6.4.15 Wartsila Corporation
- 6.4.16 Capstone Green Energy
- 6.4.17 Generac Power Systems
- 6.4.18 Vicinity Energy
- 6.4.19 Veolia (Microgrids)
- 6.4.20 NextEra Energy Resources
7 Market Opportunities & Future Outlook
- 7.1 White-space & Unmet-Need Assessment
 微電網和社區規模能源系統市場預測至2034年:按容量範圍、所有權/營運模式、技術、應用和區域分類的全球分析
 專屬式物流市場-全球產業規模、佔有率、趨勢、機會、預測:按服務、應用、區域和競爭格局分類,2021-2031年屋頂風力發電市場:全球產業規模、市場佔有率、趨勢、機會和預測(按技術、應用和地區分類)、競爭格局(2021-2031 年)分散式發電系統市場預測至2034年-按類型、輸出功率、燃料類型、安裝配置、應用、最終用戶和地區分類的全球分析
 分散式發電市場:按技術、功率輸出、電網類型、應用和最終用戶分類-2026年至2032年全球市場預測
 獨立型發電經營者 (IPP)
 2026年全球低熱水泥市場報告私人電廠市場:依技術、容量、電廠類型、營運模式、所有權模式及最終用戶分類-2026-2032年全球市場預測
 分散式能源發電市場規模、佔有率和趨勢分析報告:按技術、地區和細分市場分類(2026-2033 年)2026年全球分散式發電市場報告