


 |
市場調查報告書
商品編碼
2120551
暖通空調設備:市場佔有率分析、產業趨勢與統計、成長預測(2026-2031)HVAC Equipment - Market Share Analysis, Industry Trends & Statistics, Growth Forecasts (2026 - 2031) |
||||||

※ 本網頁內容可能與最新版本有所差異。詳細情況請與我們聯繫。
根據 Mordor Intelligence 預測,暖通空調設備市場規模將從 2025 年的 1,011.3 億美元和 2026 年的 1093.3 億美元成長到 2031 年的 1,614.6 億美元,2026 年至 2031 年的複合年成長率為 8.11%。
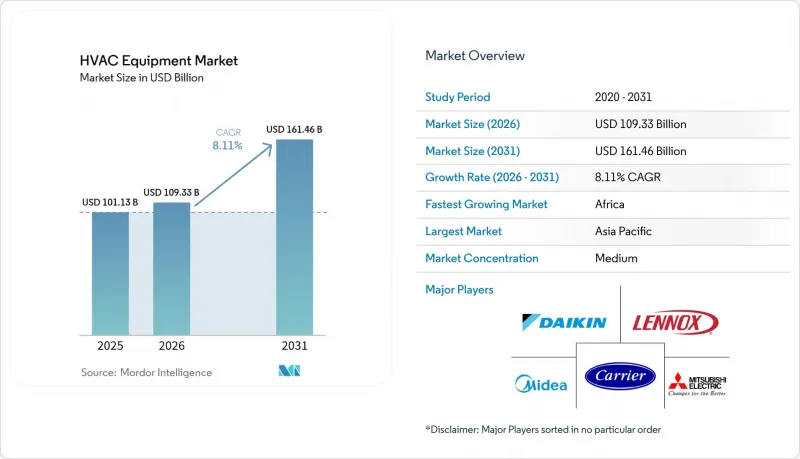
本報告按設備類型(暖氣設備、通風設備、空調設備)、安裝類型(新建、維修/更換)、最終用戶(住宅、商業、工業)、商業建築類型(辦公大樓、醫療機構、教育機構、資料中心及其他)和地區進行細分。市場預測以美元計價。
全球暖通空調設備市場趨勢與洞察
歐洲嚴格的建築節能標準正在加速熱泵的普及應用。
一項2024年生效的歐盟指令規定,自2025年起禁止使用新的石化燃料鍋爐,並強制要求能源性能最低的16%的非住宅建築在2030年前達到最低能源性能標準。這將迫使業主安裝季節能源效率係數(SPF)超過3.5的空氣源熱泵或地源熱泵。各國法規也支持這一趨勢。法國的「RE2020」將住宅的碳排放強度限制在4公斤二氧化碳當量/平方公尺/年,德國修訂後的《建築能源法》要求65%的供熱必須來自可再生能源。這兩個框架在經濟上是相容的,因為碳排放稅和天然氣採購量的減少將使投資回收期縮短至10年以內。原始設備製造商(OEM)也對此做出了積極回應。大金計劃在2027年將其在比利時的產能提高兩倍,達到每年150萬台,這表明其對政策主導的需求將持續成長充滿信心。因此,熱泵的引進是暖通空調設備市場成長前景的最大正面因素。
北歐和FLAP-D地區資料中心建設的激增,推動了對精密冷卻的需求不斷成長。
雲端超大規模資料中心業者持續將其兆瓦級設施集中在北歐國家。該地區年平均氣溫在 5°C 至 12°C 之間,使得空側節熱器能夠覆蓋高達 70% 的冷卻時間,從而將電源使用效率 (PUE) 控制在 1.2 以下。 Meta 公司位於歐登塞的 150 兆瓦園區採用海水冷卻,無需冬季機械製冷,每年可節省 1,200 萬美元的能源成本。微軟在斯德哥爾摩的擴建計畫採用了隔熱冷卻塔,運作溫度與環境溫度相差不超過 2 度C 。目前,直接晶片冷卻 (DTC) 解決方案可在熱量進入資料孔之前散發 80% 的熱量,每個機架的冷卻密度可達 30 千瓦,其價格也高於傳統的風冷設備。因此,精密冷卻已成為利潤豐厚的細分市場,推動了整個暖通空調設備市場的發展。
對於原始設備製造商 (OEM) 而言,過渡到低全球暖化潛勢 (GWP) 冷媒的初始成本很高。
歐盟的氟碳排放配額將在2030年前降至2015年基準值的2.4%,這意味著R410A冷媒必須逐步淘汰。這將需要每個製造地投入5,000萬至1億美元的資本,用於設備升級,以改用輕度易燃的A2L冷媒。大金公司估計,改造一條生產線需要1800萬美元。江森自控預計,2027年,集團整體成本將達2.5億美元,並預計在過渡期內利潤率將下降120個基點。更大的熱交換盤管、額外的洩漏感測器以及新的安全認證將導致每台設備的成本增加300至500美元,但將這些成本轉嫁給對價格敏感的客戶群將十分困難。在資本投資完全攤銷之前,盈利的負面影響將略微減緩暖通空調設備市場的擴張。
細分市場分析
預計到2031年,暖氣設備市場將以8.78%的複合年成長率成長,成長速度將超過整個暖通空調設備市場,因為在新計畫和維修項目中,熱泵將取代爐子和鍋爐。到2025年,熱泵將佔暖氣設備銷售額的58%,而鍋爐和爐子仍將佔32%。這是因為在東歐,高容量商用鍋爐在區域供熱維修中仍具有經濟效益。歐盟禁止獨立式石化燃料鍋爐的法規,以及美國透過聯邦政府和公用事業公司補貼將投資回收期從10年縮短至6年,進一步加速了這項轉變。
預計到2025年,暖通空調設備將佔據27.89%的銷售佔有率,成為最大的銷售佔有率,但由於北美和西歐家庭的普及率接近飽和,且市場關注點在於提高能源效率,因此其成長較為溫和。儘管如此,在暖通空調設備類別中,VRF系統和液冷解決方案仍實現了兩位數的成長,這主要得益於混合用途高層建築和資料中心機架密度的提高。通風產品預計在2025年將佔銷售額的22%,這主要得益於醫療教育領域對符合ASHRAE 241標準的MERV 13過濾器的升級。暖氣領域的強勁成長和冷凍領域的穩定升級,共同支撐了暖通空調設備市場的長期擴張,並證實了其需求結構的平衡。
2025年,維修和更換空調的銷售額佔總銷售額的62.33%。這反映了全球建築存量的老化,以及用變頻空調取代定速空調在節能方面具有優勢的計算結果。以一台能源效率比(SEER)為16的2025年新款空調取代一台使用20年、SEER值為10的空調,預計可大幅節省能源。老舊空調的耗電量比新款空調高出60%,這意味著商業地產業主每年可節省400至600美元。這些節省不僅能降低營運成本,也為儘早更換老舊設備提供了合理的理由。
同時,得益於北歐和FLAP-D走廊地區的資料中心園區、印度、越南和菲律賓在早期室內施工階段就指定使用VRF系統的住宅高層建築,以及中東地區需要精準冷卻的工業廠房,新建建築市場正以8.58%的複合年成長率快速擴張。開發商通常會將專案預算的8%至12%用於高性能建築的機械設備,這在專案初期階段就推動了強勁的需求。儘管隨著維修技術、模組化空調和屋頂式空調機組的融合,產業邊界日益模糊,但在可預見的未來,維修仍將是暖通空調設備市場價值的基礎。
區域分析
預計到2025年,亞太地區將佔全球空調銷售額的38.56%,這主要得益於中國8,500萬室內空調的出貨量以及印度變頻空調滲透率的快速成長(從2023年的30%成長到2025年的60%)。雖然VRF系統在東南亞的高層建築中應用日益廣泛,但日本家庭正逐漸將老舊的分離式空調更換為全球暖化潛勢(GWP)更低的型號。因此,預計該地區的成長速度將高於全球平均水平,複合年成長率(CAGR)預計為8.3%。
預計到2025年,北美將佔總銷售額的26%,複合年成長率(CAGR)為7.9%。這稅額扣抵以及維吉尼亞、德克薩斯州和奧勒岡州資料中心的建設。預計歐洲將佔總銷售額的22%,複合年成長率為8.6%。這主要歸功於鍋爐禁用後熱泵的普及,以及地熱能的主導應用(尤其是在斯堪地那維亞,其季節性能係數超過4.5)。預計中東將佔總銷售額的8%,複合年成長率為8.8%,這主要得益於沙烏地阿拉伯的NEOM新城和阿拉伯聯合大公國的資料中心等大型企劃。在這些地區,夏季氣溫高達攝氏45度,因此需要更大、更冗餘的系統。
受巴西住宅市場復甦的推動,南美洲預計到2025年將佔全球總量的6%,複合年成長率(CAGR)為7.5%,但阿根廷市場的波動將抑制其成長。同時,非洲預計到2025年市場規模將達到40億美元,並以9.12%的複合年成長率成長,引領產業發展。這主要得益於礦區採用太陽能混合封裝單元以及都市區為降低電費而對逆變器進行維修。綜合來看,這些趨勢預計將使亞太地區成為暖通空調設備市場的收入支柱,其中非洲在成長率方面領先。
其他福利
- Excel格式的市場預測(ME)表
- 3個月的分析師支持
目錄
第1章:引言
- 研究假設和市場定義
- 調查範圍
第2章:調查方法
第3章執行摘要
第4章 市場狀況
- 市場概覽
- 市場促進因素
- 歐洲嚴格的建築節能標準正在加速熱泵的普及應用。
- 北歐和FLAP-D地區資料中心建設的激增,推動了對精密冷卻的需求不斷成長。
- 亞洲高層住宅小區中變冷媒流量(VRF)系統的快速普及
- 《通貨膨脹控制法案》提供稅額扣抵,以鼓勵儘早更換暖氣設備。
- 東歐地區供熱的擴張將促進大容量鍋爐的維修。
- 在非洲離網礦區採用太陽能混合式暖通空調系統
- 市場限制因素
- 對於原始設備製造商 (OEM) 而言,過渡到低全球暖化潛勢 (GWP) 冷媒的初始成本很高。
- 成熟市場中合格的暖通空調技術人員短缺
- 由於半導體供應鏈波動,VRF逆變器的供應受到限制。
- 歐盟嚴格的氟化氣體配額制度加重了進口商的合規負擔。
- 產業價值鏈分析
- 監理展望
- 技術展望
- 宏觀經濟因素對市場的影響
- 波特五力分析
- 關鍵績效指標
第5章 市場規模與成長預測
- 依設備類型
- 加熱設備
- 鍋爐和熔爐
- 熱泵
- 整合式加熱器
- 通風設備
- 空調機組
- 加濕器/除濕器
- 空氣過濾器
- 風機盤管機組
- 空調設備
- 單元空調
- 風管分離式空調
- 無管道迷你分離式空調
- 整體式屋頂空調
- 可變冷媒流量(VRF)系統
- 室內空調
- 包裝式終端空調
- 冷卻器
- 單元空調
- 加熱設備
- 按安裝類型
- 新建工程
- 維修、安裝和更換
- 最終用戶
- 住宅
- 商業的
- 產業
- 依商業建築類型
- 辦公大樓
- 醫療機構
- 飯店及休閒
- 零售商店和購物中心
- 教育機構
- 資料中心
- 按地區
- 北美洲
- 美國
- 加拿大
- 墨西哥
- 南美洲
- 巴西
- 阿根廷
- 其他南美國家
- 歐洲
- 英國
- 德國
- 法國
- 義大利
- 其他歐洲國家
- 亞太地區
- 中國
- 日本
- 印度
- 韓國
- 其他亞太國家
- 中東和非洲
- 中東
- 阿拉伯聯合大公國
- 沙烏地阿拉伯
- 其他中東國家
- 非洲
- 南非
- 埃及
- 其他非洲地區
- 中東
- 北美洲
第6章 競爭情勢
- 市場集中度
- 策略趨勢
- 市佔率分析
- 公司簡介
- Daikin Industries Ltd.
- Carrier Global Corp.
- Trane Technologies PLC
- Johnson Controls International PLC
- Mitsubishi Electric Corp.
- Lennox International Inc.
- Rheem Manufacturing Co.
- Midea Group
- Gree Electric Appliances Inc.
- NIBE Group
- Panasonic Holdings Corporation
- Samsung Electronics Co., Ltd.
- LG Electronics Inc.
- Bosch Thermotechnology
- Vaillant Group
- Alfa Laval AB
- Stiebel Eltron GmbH and Co. KG
- Systemair AB
- Greenheck Fan Corporation
- FlaktGroup
- TROX GmbH
- Swegon Group AB
- Hitachi-Johnson Controls Air Conditioning
- Danfoss A/S
第7章 市場機會與未來展望
According to Mordor Intelligence, the HVAC equipment market size is projected to expand from USD 101.13 billion in 2025 and USD 109.33 billion in 2026 to USD 161.46 billion by 2031, registering an 8.11% CAGR between 2026 and 2031.
This report is Segmented by Equipment Type (Heating Equipment, Ventilation Equipment, Air-Conditioning Equipment), Installation Type (New Construction, and Retrofit/Replacement), End User (Residential, Commercial, Industrial), Commercial Building Type (Office Buildings, Healthcare Facilities, Educational Institutions, Data Centers, and More), and Geography. The Market Forecasts are Provided in Terms of Value (USD).
Global HVAC Equipment Market Trends and Insights
Stringent Building Energy Codes in Europe Accelerating Heat-Pump Adoption
Europe's 2024 directive outlawed new fossil-fuel boilers from 2025 and requires the worst 16% of non-residential buildings to meet minimum energy-performance thresholds by 2030, forcing owners to install air- or ground-source heat pumps that exceed seasonal performance factors of 3.5. National statutes amplify the push: France's RE2020 caps carbon intensity at 4 kg CO2 e /m2-year for homes, Germany's amended Gebaudeenergiegesetz demands 65% renewable heat, and both frameworks align economically when carbon taxes and avoided gas purchases reduce payback periods below a decade. OEMs have responded. Daikin tripled Belgian capacity to 1.5 million units per year by 2027, underscoring confidence that policy-led demand will persist. Heat-pump adoption, therefore, delivers the single-largest positive uplift to the HVAC equipment market growth outlook.
Surge in Data-Center Construction in Nordics and FLAP-D Region Elevating Precision Cooling Demand
Cloud hyperscalers continue clustering megawatt-scale facilities in the Nordics, where average annual temperatures of 5 °C-12 °C allow air-side economizers to serve up to 70% of cooling hours, cutting power-usage-effectiveness below 1.2. Meta's 150 MW campus in Odense leveraged seawater cooling to eliminate winter mechanical refrigeration and save USD 12 million per year in energy expense. Microsoft's Stockholm expansion relies on adiabatic towers operating within 2 °C of ambient. Direct-to-chip liquid solutions now pull 80% of heat before it enters data halls, permitting 30 kW-per-rack densities that command price premiums over legacy air units. Precision cooling, therefore, becomes a high-margin subsegment, pushing the overall HVAC equipment market upwards.
High Upfront Cost of Low-GWP Refrigerant Transition for OEMs
EU F-gas quotas fall to 2.4% of 2015 baselines by 2030, forcing R410A retirement and driving capital spending of USD 50 million-USD 100 million per manufacturing site to retool for mildly flammable A2L refrigerants. Daikin cites USD 18 million to convert a single line; Johnson Controls expects USD 250 million group-wide through 2027, compressing margins by 120 bp during the transition. Larger heat-exchanger coils, additional leak sensors, and new safety certifications add USD 300-USD 500 per unit, costs difficult to pass through in price-sensitive segments. Until tooling amortizes, the drag on profitability acts as a modest brake on HVAC equipment market expansion.
Other drivers and restraints analyzed in the detailed report include:
- Rapid Uptake of VRF Systems in High-Rise Asian Residential Complexes
- Inflation Reduction Act Tax Credits Catalyzing Early Furnace Replacement Cycles
- Talent Shortage of Certified HVAC Technicians in Mature Markets
For complete list of drivers and restraints, kindly check the Table Of Contents.
Segment Analysis
Heating equipment expanded at an 8.78% CAGR through 2031, outpacing the overall HVAC equipment market as heat pumps displaced furnaces and boilers in both new projects and retrofits. By 2025, heating revenue, heat pumps captured 58%, while boilers and furnaces retained 32%, because large-capacity commercial boilers remain economical for district-heating upgrades in Eastern Europe. The shift widened after EU rules banned standalone fossil-fuel boilers, and the United States, by combining federal and utility rebates, compressed payback periods from 10 to 6 years.
Air-conditioning equipment, although accounting for the largest 27.89% slice of 2025 revenue, grew more slowly because North American and Western European households operate at near-saturation and focus on efficiency-driven replacements. Nonetheless, VRF and liquid-cooling solutions posted double-digit gains inside the air-conditioning category, buoyed by mixed-use high-rises and data-center rack densities. Ventilation products accounted for 22% of 2025 sales, following upgrades in healthcare and education to MERV 13 filtration under ASHRAE 241. The blend of robust heating growth and steady cooling replacements confirms a balanced demand mix that supports the long-run expansion of the HVAC equipment market.
Retrofit and replacement accounted for 62.33% of 2025 revenue, reflecting the aging global building stock and energy-savings math that favor swapping fixed-speed units for inverter-driven models. Replacing a 20-year-old 10 SEER unit with a 2025 model featuring a 16 SEER rating can result in significant energy savings. The older unit consumes 60% more electricity compared to the newer model, leading to annual savings of USD 400 to USD 600 for commercial owners. These savings not only reduce operational costs but also justify the early replacement of outdated equipment.
New construction, however, is advancing at an 8.58% CAGR thanks to data-center campuses in the Nordics and FLAP-D corridor, residential towers in India, Vietnam, and the Philippines that specify VRF at first fit-out, and Middle-Eastern industrial plants requiring precision cooling. Developers frequently allocate 8%-12% of project budgets to mechanical systems in high-performance buildings, driving significant upfront demand. The convergence of retrofit techniques, modular AHUs, ductless minis, and rooftop packaged units blurs boundaries, yet retrofit remains the value anchor of the HVAC equipment market size in the near term.
Complete Report Scope:
- By Equipment Type
- Heating Equipment
- Boilers and Furnaces
- Heat Pumps
- Unitary Heaters
- Ventilation Equipment
- Air Handling Units
- Humidifiers and Dehumidifiers
- Air Filters
- Fan Coil Units
- Air-Conditioning Equipment
- Unitary Air Conditioners
- Ducted Splits
- Ductless Mini-Splits
- Packaged Rooftops
- Variable Refrigerant Flow (VRF) Systems
- Room Air Conditioners
- Packaged Terminal Air Conditioners
- Chillers
- Unitary Air Conditioners
- Heating Equipment
- By Installation Type
- New Construction
- Retrofit / Replacement
- By End User
- Residential
- Commercial
- Industrial
- By Commercial Building Type
- Office Buildings
- Healthcare Facilities
- Hospitality and Leisure
- Retail Stores and Malls
- Educational Institutions
- Data Centers
- By Geography
- North America
- United States
- Canada
- Mexico
- South America
- Brazil
- Argentina
- Rest of South America
- Europe
- United Kingdom
- Germany
- France
- Italy
- Rest of Europe
- Asia Pacific
- China
- Japan
- India
- South Korea
- Rest of Asia Pacific
- Middle East and Africa
- Middle East
- United Arab Emirates
- Saudi Arabia
- Rest of Middle East
- Africa
- South Africa
- Egypt
- Rest of Africa
- Middle East
- North America
Geography Analysis
Asia Pacific held 38.56% of 2025 revenue, anchored by China's 85 million room-air-conditioner shipments and India's surge in inverter-AC penetration from 30% in 2023 to 60% in 2025. Southeast Asian high-rises are increasingly adopting VRF systems, while Japanese households are swapping out their aging split systems for low-GWP models. As a result, the region is set to outpace the global average, with a projected growth rate of 8.3% CAGR.
North America delivered 26% of 2025 turnover and 7.9% CAGR, shaped by the Inflation Reduction Act's tax credits and data-center builds in Virginia, Texas, and Oregon. Europe contributed 22% of revenue, advancing at an 8.6% CAGR, as the boiler ban drives heat-pump retrofits and Scandinavia leads ground-source adoption, with seasonal performance factors above 4.5. The Middle East posted 8% share and an 8.8% CAGR on megaprojects such as Saudi Arabia's NEOM city and United Arab Emirates data hubs, where 45 °C summers require oversizing and redundancy.
South America added 6% of 2025 volume and 7.5% CAGR, buoyed by Brazil's residential rebound yet tempered by Argentine volatility, while Africa, starting from a USD 4 billion 2025 base, is forecast to expand at a leading 9.12% CAGR as mining camps adopt solar-hybrid packaged units and urban centers retrofit inverters to curb electricity costs. Together, these dynamics position Asia Pacific as the revenue anchor and Africa as the percentage-growth frontier of the HVAC equipment market.
- Daikin Industries Ltd.
- Carrier Global Corp.
- Trane Technologies PLC
- Johnson Controls International PLC
- Mitsubishi Electric Corp.
- Lennox International Inc.
- Rheem Manufacturing Co.
- Midea Group
- Gree Electric Appliances Inc.
- NIBE Group
- Panasonic Holdings Corporation
- Samsung Electronics Co., Ltd.
- LG Electronics Inc.
- Bosch Thermotechnology
- Vaillant Group
- Alfa Laval AB
- Stiebel Eltron GmbH and Co. KG
- Systemair AB
- Greenheck Fan Corporation
- FlaktGroup
- TROX GmbH
- Swegon Group AB
- Hitachi-Johnson Controls Air Conditioning
- Danfoss A/S
Additional Benefits:
- The market estimate (ME) sheet in Excel format
- 3 months of analyst support
TABLE OF CONTENTS
1 INTRODUCTION
- 1.1 Study Assumptions and Market Definition
- 1.2 Scope of the Study
2 RESEARCH METHODOLOGY
3 EXECUTIVE SUMMARY
4 MARKET LANDSCAPE
- 4.1 Market Overview
- 4.2 Market Drivers
- 4.2.1 Stringent Building Energy Codes in Europe Accelerating Heat-Pump Adoption
- 4.2.2 Surge in Data-Center Construction in Nordics and FLAP-D Region Elevating Precision Cooling Demand
- 4.2.3 Rapid Uptake of Variable-Refrigerant-Flow (VRF) Systems in High-Rise Asian Residential Complexes
- 4.2.4 Inflation Reduction Act Tax Credits Catalyzing Early Furnace Replacement Cycles
- 4.2.5 District-Heating Expansion in Eastern Europe Spurring Large-Capacity Boiler Retrofits
- 4.2.6 Solar-Hybrid HVAC Packages Gaining Traction in Off-Grid African Mining Camps
- 4.3 Market Restraints
- 4.3.1 High Up-Front Cost of Low-GWP Refrigerant Transition for OEMs
- 4.3.2 Talent Shortage of Certified HVAC Technicians in Mature Markets
- 4.3.3 Semiconductor Supply-Chain Volatility Constraining VRF Inverter Availability
- 4.3.4 Stringent F-Gas Quotas in EU Increasing Compliance Burden for Importers
- 4.4 Industry Value Chain Analysis
- 4.5 Regulatory Outlook
- 4.6 Technological Outlook
- 4.7 Impact of Macroeconomic Factors on the Market
- 4.8 Porter's Five Forces Analysis
- 4.8.1 Bargaining Power of Suppliers
- 4.8.2 Bargaining Power of Buyers
- 4.8.3 Threat of New Entrants
- 4.8.4 Threat of Substitutes
- 4.8.5 Intensity of Competitive Rivalry
- 4.9 Key Performance Indicators
5 MARKET SIZE AND GROWTH FORECASTS (VALUE)
- 5.1 By Equipment Type
- 5.1.1 Heating Equipment
- 5.1.1.1 Boilers and Furnaces
- 5.1.1.2 Heat Pumps
- 5.1.1.3 Unitary Heaters
- 5.1.2 Ventilation Equipment
- 5.1.2.1 Air Handling Units
- 5.1.2.2 Humidifiers and Dehumidifiers
- 5.1.2.3 Air Filters
- 5.1.2.4 Fan Coil Units
- 5.1.3 Air-Conditioning Equipment
- 5.1.3.1 Unitary Air Conditioners
- 5.1.3.1.1 Ducted Splits
- 5.1.3.1.2 Ductless Mini-Splits
- 5.1.3.1.3 Packaged Rooftops
- 5.1.3.1.4 Variable Refrigerant Flow (VRF) Systems
- 5.1.3.2 Room Air Conditioners
- 5.1.3.3 Packaged Terminal Air Conditioners
- 5.1.3.4 Chillers
- 5.1.3.1 Unitary Air Conditioners
- 5.1.1 Heating Equipment
- 5.2 By Installation Type
- 5.2.1 New Construction
- 5.2.2 Retrofit / Replacement
- 5.3 By End User
- 5.3.1 Residential
- 5.3.2 Commercial
- 5.3.3 Industrial
- 5.4 By Commercial Building Type
- 5.4.1 Office Buildings
- 5.4.2 Healthcare Facilities
- 5.4.3 Hospitality and Leisure
- 5.4.4 Retail Stores and Malls
- 5.4.5 Educational Institutions
- 5.4.6 Data Centers
- 5.5 By Geography
- 5.5.1 North America
- 5.5.1.1 United States
- 5.5.1.2 Canada
- 5.5.1.3 Mexico
- 5.5.2 South America
- 5.5.2.1 Brazil
- 5.5.2.2 Argentina
- 5.5.2.3 Rest of South America
- 5.5.3 Europe
- 5.5.3.1 United Kingdom
- 5.5.3.2 Germany
- 5.5.3.3 France
- 5.5.3.4 Italy
- 5.5.3.5 Rest of Europe
- 5.5.4 Asia Pacific
- 5.5.4.1 China
- 5.5.4.2 Japan
- 5.5.4.3 India
- 5.5.4.4 South Korea
- 5.5.4.5 Rest of Asia Pacific
- 5.5.5 Middle East and Africa
- 5.5.5.1 Middle East
- 5.5.5.1.1 United Arab Emirates
- 5.5.5.1.2 Saudi Arabia
- 5.5.5.1.3 Rest of Middle East
- 5.5.5.2 Africa
- 5.5.5.2.1 South Africa
- 5.5.5.2.2 Egypt
- 5.5.5.2.3 Rest of Africa
- 5.5.5.1 Middle East
- 5.5.1 North America
6 COMPETITIVE LANDSCAPE
- 6.1 Market Concentration
- 6.2 Strategic Moves
- 6.3 Market Share Analysis
- 6.4 Company Profiles (includes Global Level Overview, Market Level Overview, Core Segments, Financials as Available, Strategic Information, Market Rank/Share for Key Companies, Products and Services, Recent Developments)
- 6.4.1 Daikin Industries Ltd.
- 6.4.2 Carrier Global Corp.
- 6.4.3 Trane Technologies PLC
- 6.4.4 Johnson Controls International PLC
- 6.4.5 Mitsubishi Electric Corp.
- 6.4.6 Lennox International Inc.
- 6.4.7 Rheem Manufacturing Co.
- 6.4.8 Midea Group
- 6.4.9 Gree Electric Appliances Inc.
- 6.4.10 NIBE Group
- 6.4.11 Panasonic Holdings Corporation
- 6.4.12 Samsung Electronics Co., Ltd.
- 6.4.13 LG Electronics Inc.
- 6.4.14 Bosch Thermotechnology
- 6.4.15 Vaillant Group
- 6.4.16 Alfa Laval AB
- 6.4.17 Stiebel Eltron GmbH and Co. KG
- 6.4.18 Systemair AB
- 6.4.19 Greenheck Fan Corporation
- 6.4.20 FlaktGroup
- 6.4.21 TROX GmbH
- 6.4.22 Swegon Group AB
- 6.4.23 Hitachi-Johnson Controls Air Conditioning
- 6.4.24 Danfoss A/S
7 MARKET OPPORTUNITIES AND FUTURE OUTLOOK
- 7.1 White-Space and Unmet-Need Assessment

 美國暖通空調設備:市場佔有率分析、產業趨勢與統計及成長預測(2026-2031)歐洲暖通空調設備:市場佔有率分析、產業趨勢與統計及成長預測(2026-2031)
 暖通空調設備市場報告:趨勢、預測與競爭分析(至2035年)北美暖通空調設備:市佔率分析、產業趨勢與統計及成長預測(2026-2031 年)
 北美暖通空調設備,2023-2031年Frost Radar(TM):暖通空調設備,2026 年暖通空調馬達市場:全球產業分析、市場規模及佔有率和預測(2026-2033 年)-按馬達類型、額定功率、暖通空調設備類型、最終用途、國家和地區分類
 暖通空調設備市場:2026-2032年全球市場預測(按組件、技術、燃料類型、容量、最終用途、安裝類型和分銷管道分類)全球暖通空調設備市場(2026-2031年)暖通空調馬達:市場佔有率分析、產業趨勢與統計、成長預測(2026-2031)