


 |
市場調查報告書
商品編碼
2120549
熱敏電阻器電阻溫度感測器:市場佔有率分析、產業趨勢與統計及成長預測(2026-2031)Thermistor Temperature Sensor - Market Share Analysis, Industry Trends & Statistics, Growth Forecasts (2026 - 2031) |
||||||

※ 本網頁內容可能與最新版本有所差異。詳細情況請與我們聯繫。
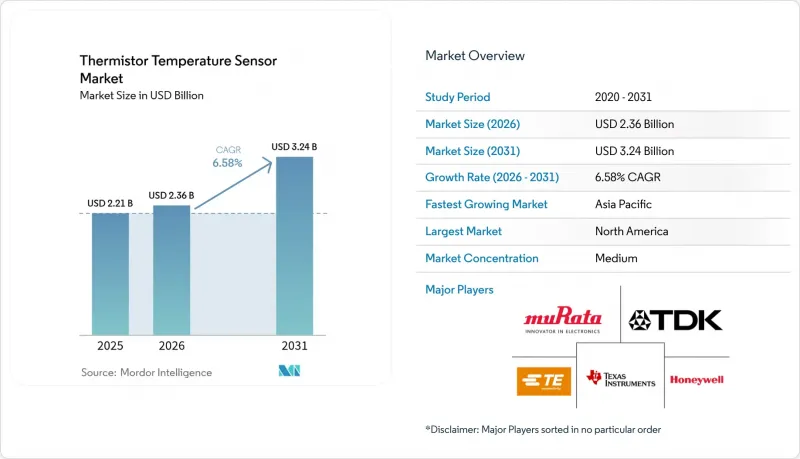
根據 Mordor Intelligence 預測,熱敏電阻器溫度感測器市場將從 2025 年的 22.1 億美元成長到 2026 年的 23.6 億美元,然後在 2031 年達到 32.4 億美元,2026 年至 2031 年的複合年成長率為 6.58%。
本報告按類型(正溫度係數 (PTC)、負溫度係數 (NTC))、溫度範圍(低溫(低於 -40°C)、中溫(-40°C 至 125°C)、其他)、終端用戶行業(汽車和電動汽車、消費電子和穿戴式設備、工業自動化和工業物聯網 (IIoT)、醫療和生命科學設備、能源和發電、航太和國防、暖通空調和建築自動化)以及地區進行細分。市場預測以美元 (USD) 為單位。
全球熱敏電阻器電阻溫度感測器市場趨勢及洞察
家用電器對成本績效高效、高精度感測器的需求
晶片級0402封裝技術,在實現±0.5 度C精度的同時,最大限度地縮小了基板面積,正在推動熱敏電阻器在智慧型手機、筆記型電腦和穿戴式裝置市場中的佔有率成長。設備製造商目前正將多點熱敏電阻器陣列整合到電池和系統晶片(SoC)散熱器上,以啟動預測性節流演算法,從而延長組件壽命並提高用戶安全性。由於應用處理器的持續小型化,熱密度不斷增加,這意味著每一代智慧型手機的發布都需要更多的溫度控管點。因此,隨著OEM廠商更傾向於選擇成本更低、供應鏈更成熟的NTC組件而非數位IC替代方案,熱敏電阻器溫度感測器市場正在穩步擴張。儘管分離式熱敏熱敏電阻器一直被視為一種通用產品,但將超小型晶片與低雜訊訊號鏈相結合的供應商正在建立起高階的平均售價(ASP)地位。
電動汽車電池的快速普及增加了對高密度熱失控監測的需求。
現代電池組每輛車都配備數百個感測器。這是因為即使電池單元之間只有 5°C 的溫差,也可能引發熱失控連鎖反應。 NTC 材料在 -40°C 至 125°C 的溫度範圍內響應速度小於 100 毫秒,使電池管理單元能夠在過熱模組發生故障之前將其隔離。第二代化學電池,例如高鎳 NMC 電池,對溫度範圍的要求更高,因此每度電池需要更多的感測器。正因如此,汽車製造商成為熱敏電阻器溫度感測器市場最大的買家。為了滿足嚴格的 AEC-Q200 可靠性測試要求,供應商採用環氧樹脂塗層引線,這種引線具有抗振動、防潮和抗電磁干擾的特性,從而確保車輛整個使用壽命期間的長期校準穩定性。
與RTD/IC感測器相比,溫度測量範圍更窄。
大多數NTC材料的耐溫上限約為125 度C ,因此不適用於航太渦輪機、石油化學反應器以及運作溫度超過200 度C的引擎排氣系統。這些領域的終端用戶更傾向於使用鉑電阻溫度檢測器(RTD)和數位矽積體電路(IC),因為它們在高溫下仍能保持穩定性,並且無需類比訊號處理即可提供線性輸出。因此,NTC材料在極端高溫環境下的應用範圍有限,限制了熱敏電阻器溫度感測器的市場佔有率成長。元件製造商正在開發耐高溫玻璃封裝珠,但低產量和高成本限制了其短期內的普及應用。
細分市場分析
至2025年,NTC元件將佔熱敏電阻溫度感測器出貨量的69.62%,憑藉其主導電阻-溫度特性,在醫療、電池和工業控制迴路中能夠檢測0.01 度C的溫度變化,從而在熱敏電阻器溫度感測器市場佔據領先地位。 NTC元件對熱敏電阻器溫度感測器市場規模的貢獻預計將從2025年的15.4億美元成長到2031年的22.2億美元。這反映了該細分市場向晶片級、探針和軟性基板等多種形式擴展的能力。 PTC產品的複合年成長率為7.38%,但目前仍主要應用於湧入電流限制和自加熱加熱器等小眾市場。
鈣鈦礦摻雜陶瓷技術的進步已將BETA係數提升至4400K以上,無需複雜的線性化處理即可進一步提高精度。此外,供應商正在聚醯亞胺和PET上沉積NTC薄膜層,為設計人員提供電子服飾的可拉伸感測器。這種穩定發展的創新步伐鞏固了NTC的長期主導地位,即使數位IC逐漸蠶食傳統插座市場,也確保了熱敏電阻器溫度感測器市場,特別是高靈敏度分立元件市場,保持穩固的基礎。
區域分析
預計到2025年,亞太地區將佔據46.08%的市場佔有率,這主要得益於中國、日本和韓國集中的垂直整合陶瓷加工和表面黏著技術組裝設施。一級供應商在零件工廠附近運作大規模燒結爐,從而降低了物流成本並縮短了前置作業時間。政府對電動車普及的獎勵正在提振區域需求,而領先的區域電池製造商則從國內供應商採購感測器,以滿足嚴格的電池組級熱設計要求。
預計到2025年,北美和歐洲合計將佔全球銷售額的約34.75%。這些地區的優勢在於高利潤率的醫療、航太和ADAS市場,在這些市場中,可追溯性和功能安全認證備受重視。德國和美國的汽車一級供應商已開始對溫度和電壓複合探頭進行認證,這些探頭可簡化800V電池架構內的佈線。即使出貨量保持不變,這一趨勢預計也將推高平均售價。
中東地區以6.98%的複合年成長率領先市場,這主要得益於超級工廠、智慧城市項目以及高能耗海水淡化廠的蓬勃發展,這些設施每個都需要數千個感測器。非洲和南美洲仍在發展中,但採礦、農業和可再生能源領域已率先站穩腳步。以出口為導向的亞洲供應商正透過與當地經銷商合作,彌補支援方面的不足,從而進一步擴大熱敏電阻器溫度感測器市場,並提升其在這些新興地區的市場佔有率。
其他福利
- Excel格式的市場預測(ME)表
- 3個月的分析師支持
目錄
第1章:引言
- 研究假設和市場定義
- 調查範圍
第2章:調查方法
第3章執行摘要
第4章 市場狀況
- 市場概覽
- 市場促進因素
- 家用電器對成本績效高效、高精度感測器的需求
- 電動汽車電池的快速普及增加了對高密度熱失控監測的需求。
- 工業IoT和智慧工廠的擴展
- 食品安全和冷鏈可追溯性的監管要求
- 用於固態電池的早期預警晶片,整合微型NTC熱敏電阻。
- 採用軟性熱敏熱敏電阻器紗線的智慧紡織穿戴式設備。
- 市場限制因素
- 與RTD/IC感測器相比,溫度測量範圍更窄。
- 錳、鈷和氧化鎳等原物料價格的波動
- 汽車ADAS中向全數位溫度感測器IC的過渡
- 超低功耗物聯網節點中的自加熱漂移
- 產業價值鏈分析
- 監理情勢
- 技術展望
- 波特五力分析
- 宏觀經濟因素的影響
第5章 市場規模與成長預測
- 按類型
- 正溫度係數(PTC)
- 負溫度係數(NTC)
- 按溫度範圍
- 低溫(-40度C或更低)
- 中溫(-40度C~125度C)
- 高溫(高於125°C)
- 按最終用途行業分類
- 汽車和電動旅行
- 家用電器和穿戴設備
- 工業自動化和工業物聯網
- 醫療和生命科學設備
- 能源和發電
- 航太/國防
- 暖通空調建築自動化
- 按地區
- 北美洲
- 美國
- 加拿大
- 墨西哥
- 南美洲
- 巴西
- 阿根廷
- 智利
- 其他南美國家
- 歐洲
- 德國
- 英國
- 法國
- 義大利
- 西班牙
- 其他歐洲國家
- 亞太地區
- 中國
- 日本
- 印度
- 韓國
- 澳洲
- 新加坡
- 馬來西亞
- 其他亞太國家
- 中東
- 沙烏地阿拉伯
- 阿拉伯聯合大公國
- 土耳其
- 其他中東國家
- 非洲
- 南非
- 奈及利亞
- 其他非洲地區
- 北美洲
第6章 競爭情勢
- 市場集中度
- 策略趨勢
- 市佔率分析
- 公司簡介
- Texas Instruments Inc.
- Murata Manufacturing Co. Ltd.
- TDK Corporation(EPCOS)
- TE Connectivity
- Honeywell International Inc.
- Panasonic Corp.
- Vishay Intertechnology Inc.
- Mitsubishi Materials Corp.
- Shibaura Electronics Co. Ltd.
- Littelfuse Inc.(Ametherm)
- SEMITEC Corp.
- KOA Corporation
- Ohizumi Manufacturing Co. Ltd.
- Molex LLC
- Analog Devices Inc.
- Amphenol Advanced Sensors
- Sensata Technologies
- Heraeus Nexensos
- Vishay BC Components
- AVX Corp.(KYOCERA)
第7章 市場機會與未來展望
According to Mordor Intelligence, the thermistor temperature sensor market size is expected to grow from USD 2.21 billion in 2025 to USD 2.36 billion in 2026 and is forecast to reach USD 3.24 billion by 2031 at 6.58% CAGR over 2026-2031.
This report is Segmented by Type (Positive Temperature Coefficient (PTC), Negative Temperature Coefficient (NTC)), Temperature Range (Low Temperature (Below -40 C), Medium Temperature (-40 C To 125 C) and More), End-Use Industry (Automotive, Consumer Electronics, Industrial, Medical, Energy, Aerospace, HVAC), and Geography. The Market Forecasts are Provided in Terms of Value (USD).
Global Thermistor Temperature Sensor Market Trends and Insights
Demand for Cost-Effective, High-Accuracy Sensors in Consumer Electronics
Thermistors are winning socket share in smartphones, laptops, and wearables because chip-scale 0402 packages occupy minimal board real estate while still achieving +-0.5 °C accuracy. Device makers now embed multi-point thermistor arrays across batteries and system-on-chip heat spreaders to trigger predictive throttling algorithms that lengthen component life and improve user safety. Continuous shrinkage of application processors lifts waste-heat density, so every new smartphone generation adds incremental thermal nodes. The result is a steady rise in the thermistor temperature sensor market as OEMs favor the low cost and mature supply chains of NTC parts over digital IC alternatives. Suppliers that combine ultra-small die with low-noise signal chains are carving out premium ASP positions despite the commodity reputation of discrete thermistors.
Rapid EV-Battery Deployment Requiring Dense Thermal-Runaway Monitoring
Modern battery packs mount hundreds of sensing beads per vehicle because a 5 °C cell-to-cell gradient can cascade into runaway failures. NTC materials deliver sub-100 millisecond response across -40 °C to 125 °C ranges, allowing battery-management units to isolate overheating modules before venting occurs. Second-generation chemistries such as high-nickel NMC require even tighter temperature envelopes, enlarging sensor counts per kilowatt-hour. Automakers have therefore become the largest volume buyers in the thermistor temperature sensor market. To meet stringent AEC-Q200 reliability tests, vendors are introducing epoxy-coated leads that resist vibration, humidity, and electromagnetic interference, ensuring long-term calibration stability over the vehicle's service life.
Limited Temperature Span Versus RTDs and IC Sensors
Most NTC formulations top out near 125 °C, which rules them out for aerospace turbines, petrochemical reactors, and engine-exhaust systems that run beyond 200 °C. End users in these sectors prefer platinum RTDs or digital silicon ICs that remain stable at elevated ranges and provide linear outputs without analog conditioning. The resulting application ceiling trims the obtainable share of the thermistor temperature sensor market in extreme-temperature verticals. Component makers are pursuing high-temperature glass-encapsulated beads, but production yields remain low and costs high, limiting near-term adoption.
Other drivers and restraints analyzed in the detailed report include:
- Expansion of Industrial IoT and Smart Factories
- Regulatory Mandates on Food Safety and Cold-Chain Traceability
- Volatility in Manganese, Cobalt, and Nickel-Oxide Feedstock Prices
For complete list of drivers and restraints, kindly check the Table Of Contents.
Segment Analysis
NTC devices captured 69.62% of the 2025 volume, establishing clear leadership in the thermistor temperature sensor market share thanks to exponential resistance-temperature slopes that resolve 0.01 °C changes in medical, battery, and industrial control loops. The thermistor temperature sensor market size contribution from NTC parts is forecast to grow from USD 1.54 billion in 2025 to USD 2.22 billion by 2031, reflecting the segment's ability to scale into chip-scale, probe, and flexible-substrate formats. PTC products, while rising at a 7.38% CAGR, remain niche for inrush current limiting and self-heating heaters.
The evolution of perovskite-doped ceramics is amplifying beta coefficients above 4,400 K, further tightening accuracy without complex linearization. Vendors also deposit thin-film NTC layers on polyimide and PET, giving designers stretchable sensors for e-textile garments. This steady innovation cadence underpins long-term NTC dominance even as digital ICs nibble at legacy sockets, ensuring the thermistor temperature sensor market retains a robust core around high-sensitivity discrete components.
Complete Report Scope:
- By Type
- Positive Temperature Coefficient (PTC)
- Negative Temperature Coefficient (NTC)
- By Temperature Range
- Low Temperature (Below -40 C)
- Medium Temperature (-40 C to 125 C)
- High Temperature (Above 125 C)
- By End-Use Industry
- Automotive and E-Mobility
- Consumer Electronics and Wearables
- Industrial Automation and IIoT
- Medical and Life-Sciences Equipment
- Energy and Power Generation
- Aerospace and Defense
- HVAC and Building Automation
- By Geography
- North America
- United States
- Canada
- Mexico
- South America
- Brazil
- Argentina
- Chile
- Rest of South America
- Europe
- Germany
- United Kingdom
- France
- Italy
- Spain
- Rest of Europe
- Asia-Pacific
- China
- Japan
- India
- South Korea
- Australia
- Singapore
- Malaysia
- Rest of Asia-Pacific
- Middle East
- Saudi Arabia
- United Arab Emirates
- Turkey
- Rest of Middle East
- Africa
- South Africa
- Nigeria
- Rest of Africa
- North America
Geography Analysis
Asia-Pacific's 46.08% share in 2025 stems from its vertically integrated ceramic processing and surface-mount assembly hubs concentrated in China, Japan, and South Korea. Tier-one suppliers operate large-scale kilns near component plants, cutting logistics costs and shortening lead times. Government incentives for EV adoption amplify local demand, while regional giant battery makers source sensors from domestic vendors to comply with tight pack-level thermal budgets.
North America and Europe combine for roughly 34.75% of 2025 revenue. Their advantage lies in high-margin medical, aerospace, and ADAS markets that prize traceability and functional-safety certification. Automotive Tier-1s in Germany and the United States have begun qualifying combined temperature-voltage probes that simplify wiring inside 800-V battery architectures, a trend expected to lift average selling prices even if unit counts plateau.
The Middle East tops growth tables at 6.98% CAGR as giga-factories, smart-city programs, and energy-intensive desalination plants demand thousands of sensors per facility. Africa and South America remain nascent, but mining, agriculture, and renewables create early footholds. Export-oriented Asian vendors are partnering with local distributors to bridge support gaps and capture incremental share in these frontier regions, further broadening the thermistor temperature sensor market.
- Texas Instruments Inc.
- Murata Manufacturing Co. Ltd.
- TDK Corporation (EPCOS)
- TE Connectivity
- Honeywell International Inc.
- Panasonic Corp.
- Vishay Intertechnology Inc.
- Mitsubishi Materials Corp.
- Shibaura Electronics Co. Ltd.
- Littelfuse Inc. (Ametherm)
- SEMITEC Corp.
- KOA Corporation
- Ohizumi Manufacturing Co. Ltd.
- Molex LLC
- Analog Devices Inc.
- Amphenol Advanced Sensors
- Sensata Technologies
- Heraeus Nexensos
- Vishay BC Components
- AVX Corp. (KYOCERA)
Additional Benefits:
- The market estimate (ME) sheet in Excel format
- 3 months of analyst support
TABLE OF CONTENTS
1 INTRODUCTION
- 1.1 Study Assumptions and Market Definition
- 1.2 Scope of the Study
2 RESEARCH METHODOLOGY
3 EXECUTIVE SUMMARY
4 MARKET LANDSCAPE
- 4.1 Market Overview
- 4.2 Market Drivers
- 4.2.1 Demand for cost-effective, high-accuracy sensors in consumer electronics
- 4.2.2 Rapid EV-battery deployment requiring dense thermal-runaway monitoring
- 4.2.3 Expansion of industrial IoT and smart factories
- 4.2.4 Regulatory mandates on food-safety and cold-chain traceability
- 4.2.5 Solid-state battery early-warning chips integrating micro-NTC beads
- 4.2.6 Smart-textile wearables embedding flexible thermistor yarns
- 4.3 Market Restraints
- 4.3.1 Limited temperature span versus RTDs and IC sensors
- 4.3.2 Volatility in manganese, cobalt, and nickel-oxide feedstock prices
- 4.3.3 Shift toward fully-digital temperature-sensor ICs in automotive ADAS
- 4.3.4 Self-heating drift in ultra-low-power IoT nodes
- 4.4 Industry Value Chain Analysis
- 4.5 Regulatory Landscape
- 4.6 Technological Outlook
- 4.7 Porter's Five Forces Analysis
- 4.7.1 Threat of New Entrants
- 4.7.2 Bargaining Power of Buyers
- 4.7.3 Bargaining Power of Suppliers
- 4.7.4 Threat of Substitutes
- 4.7.5 Intensity of Rivalry
- 4.8 Impact of Macroeconomic Factors
5 MARKET SIZE AND GROWTH FORECASTS (VALUE)
- 5.1 By Type
- 5.1.1 Positive Temperature Coefficient (PTC)
- 5.1.2 Negative Temperature Coefficient (NTC)
- 5.2 By Temperature Range
- 5.2.1 Low Temperature (Below -40 C)
- 5.2.2 Medium Temperature (-40 C to 125 C)
- 5.2.3 High Temperature (Above 125 C)
- 5.3 By End-Use Industry
- 5.3.1 Automotive and E-Mobility
- 5.3.2 Consumer Electronics and Wearables
- 5.3.3 Industrial Automation and IIoT
- 5.3.4 Medical and Life-Sciences Equipment
- 5.3.5 Energy and Power Generation
- 5.3.6 Aerospace and Defense
- 5.3.7 HVAC and Building Automation
- 5.4 By Geography
- 5.4.1 North America
- 5.4.1.1 United States
- 5.4.1.2 Canada
- 5.4.1.3 Mexico
- 5.4.2 South America
- 5.4.2.1 Brazil
- 5.4.2.2 Argentina
- 5.4.2.3 Chile
- 5.4.2.4 Rest of South America
- 5.4.3 Europe
- 5.4.3.1 Germany
- 5.4.3.2 United Kingdom
- 5.4.3.3 France
- 5.4.3.4 Italy
- 5.4.3.5 Spain
- 5.4.3.6 Rest of Europe
- 5.4.4 Asia-Pacific
- 5.4.4.1 China
- 5.4.4.2 Japan
- 5.4.4.3 India
- 5.4.4.4 South Korea
- 5.4.4.5 Australia
- 5.4.4.6 Singapore
- 5.4.4.7 Malaysia
- 5.4.4.8 Rest of Asia-Pacific
- 5.4.5 Middle East
- 5.4.5.1 Saudi Arabia
- 5.4.5.2 United Arab Emirates
- 5.4.5.3 Turkey
- 5.4.5.4 Rest of Middle East
- 5.4.6 Africa
- 5.4.6.1 South Africa
- 5.4.6.2 Nigeria
- 5.4.6.3 Rest of Africa
- 5.4.1 North America
6 COMPETITIVE LANDSCAPE
- 6.1 Market Concentration
- 6.2 Strategic Moves
- 6.3 Market Share Analysis
- 6.4 Company Profiles (includes Global level Overview, Market level overview, Core Segments, Financials as available, Strategic Information, Market Rank/Share, Products and Services, Recent Developments)
- 6.4.1 Texas Instruments Inc.
- 6.4.2 Murata Manufacturing Co. Ltd.
- 6.4.3 TDK Corporation (EPCOS)
- 6.4.4 TE Connectivity
- 6.4.5 Honeywell International Inc.
- 6.4.6 Panasonic Corp.
- 6.4.7 Vishay Intertechnology Inc.
- 6.4.8 Mitsubishi Materials Corp.
- 6.4.9 Shibaura Electronics Co. Ltd.
- 6.4.10 Littelfuse Inc. (Ametherm)
- 6.4.11 SEMITEC Corp.
- 6.4.12 KOA Corporation
- 6.4.13 Ohizumi Manufacturing Co. Ltd.
- 6.4.14 Molex LLC
- 6.4.15 Analog Devices Inc.
- 6.4.16 Amphenol Advanced Sensors
- 6.4.17 Sensata Technologies
- 6.4.18 Heraeus Nexensos
- 6.4.19 Vishay BC Components
- 6.4.20 AVX Corp. (KYOCERA)
7 MARKET OPPORTUNITIES AND FUTURE OUTLOOK
- 7.1 White-space and Unmet-need Assessment

 液態氮溫度感測器市場報告:趨勢、預測和競爭分析(至2035年)
 美國溫度感測器:市場佔有率分析、行業趨勢和統計數據、成長預測(2026-2031)溫度感測器:市場佔有率分析、產業趨勢與統計、成長預測(2026-2031)
 溫度感測器市場-全球市場預測(2026-2032年)
 無線溫度鉗市場規模、佔有率和成長分析:按連接方式、顯示配置、鉗口寬度、應用、分銷管道和地區分類-2026-2033年產業預測
 體溫偵測螢幕市場規模、佔有率和成長分析:按類型、應用、精確度、最終用戶、通路和地區分類-2026-2033年產業預測
 城市氣候監測系統市場預測至2034年—按組件、部署模式、技術、應用、最終用戶和地區分類的全球分析
 溫度感測器市場:按類型和地區分類雙感測器模組市場:按模組類型、感測器類型、技術、應用、終端用戶產業和分銷管道分類,全球預測,2026-2032年
 體溫篩檢系統市場規模、佔有率和成長分析:按產品類型、技術、最終用戶和地區分類-2026-2033年產業預測