


 |
市場調查報告書
商品編碼
2120394
美國生物農藥:市場佔有率分析、行業趨勢和統計數據、成長預測(2026-2031 年)United States Biopesticides - Market Share Analysis, Industry Trends & Statistics, Growth Forecasts (2026 - 2031) |
||||||

※ 本網頁內容可能與最新版本有所差異。詳細情況請與我們聯繫。
據 Mordor Intelligence 稱,2025 年美國生物農藥市值為 18.6 億美元,預計在預測期(2026-2031 年)內將以 12.7% 的複合年成長率成長,從 2026 年的 21 億美元成長到 2031 年的 38.2 億美元。
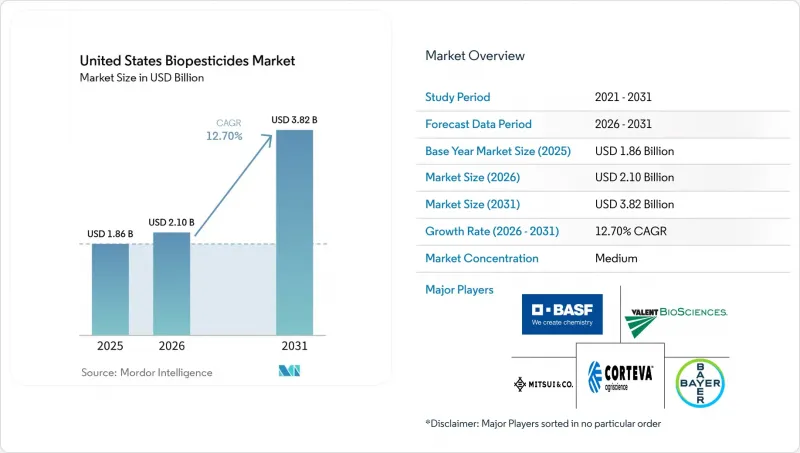
本報告按形態(生物真菌、生物除草劑等)和作物類型(經濟作物、園藝作物、大田作物)進行分類。市場預測以價值(美元)和數量(公噸)表示。
美國生物農藥市場趨勢與洞察
美國有機農業和符合殘留物標準的作物生產的擴張
有機農業的擴張以及消費者對符合殘留物標準的農產品日益成長的需求,正在推動美國生物農藥的普及。儘管有機生產標準禁止使用大多數合成農藥,但水果、蔬菜、堅果和出口特種作物的生產商正擴大採用生物農藥,以符合最大殘留限量(MRL)要求和零售商的永續發展計劃。生物農藥也被納入傳統農業系統,作為綜合蟲害管理(IPM)策略的一部分,以在保持作物產量的同時減少化學殘留。根據美國農業部經濟研究局(ERS)的數據顯示,2024年美國有機食品銷售額達到創紀錄的654億美元。這反映了消費者對有機食品需求的持續成長,並支持了有機生產系統的擴張。這一趨勢正在推動高價值作物整體生物農藥,從而鞏固美國生物農藥市場的長期成長。
在玉米、大豆、特種作物和棉花種植中引入生技藥品。
美國生物農藥市場的發展主要得益於主流種植系統中生技藥品的日益普及。發表在《昆蟲科學前沿》(Frontiers in Insect Science)上的一項2025年調查顯示,2024年有45%的農作物種植戶使用生技藥品,比前兩年成長了8個百分點。該調查還顯示,63%的主要農業零售商報告稱,2024年生技藥品的銷售額有所成長。在受抗Bt玉米根蟲影響的地區,種子處理和針對大豆銹病的葉面噴布方案表明,生物來源產品的作用正在有機農業之外不斷擴大。在東南部的棉花種植計畫中,生物來源殺菌劑被用來防治幼苗病害,生物來源殺蟲劑被用來防治抗擬除蟲菊酯類殺蟲劑的小菜蛾。獲准在多種作物上註冊的芽孢桿菌類產品,只需一個標籤即可,這可以降低每英畝的註冊成本,並擴大產品在玉米、大豆和特種作物系統中的應用範圍。
與傳統農藥相比,每英畝成本較高
與傳統化學農藥相比,生物農藥較高的單位面積成本是其推廣應用的主要障礙,尤其是在利潤率相對較低的大規模田間作物。微生物生物農藥通常需要專門的發酵、配製和品管流程,這增加了生產成本。此外,某些生物來源產品在特定的田間條件下可能需要更頻繁地施用才能維持藥效。因此,除非能夠證明其具有明顯的經濟效益,否則種植玉米、大豆和小麥等作物的種植者可能不願意放棄成本較低的合成農藥。雖然預計未來國內發酵能力、菌株開發和生產效率的提高將降低生產成本,但價格競爭力仍然是一項挑戰。因此,美國生物農藥市場的供應商需要透過證明其產品具有可衡量的價值來證明其高昂的加工成本是合理的,例如提高產量、控制抗藥性、符合殘留標準或進入高階市場。
細分市場分析
到2025年,生物殺菌劑將占美國生物農藥市場佔有率的49.0%,成為最大的產品類別。其應用主要集中在種子處理、土壤灌溉以及作物、果樹、蔬菜和特種作物的葉部病害防治等領域。生物殺菌劑在認證有機農業中已廣泛應用,並且擴大被引入傳統農業系統,用於防治病害,同時確保符合殘留限量和抗性管理策略。它們在控制大豆猝死症候群、玉米苗期枯萎病和棉花立枯絲核菌症方面的顯著作用鞏固了其市場地位。相較之下,生物除草劑和其他產品類型的市場規模仍然較小,因為在不同的氣候和農業條件下實現穩定的雜草控制仍然是一項技術挑戰。
預計2026年至2031年間,生物農藥細分市場將以15.0%的複合年成長率成長,成為美國生物農藥市場中成長最快的細分市場。這一成長主要得益於市場對新型作用機制產品的需求不斷成長,以應對殺蟲劑抗藥性問題並支持綜合蟲害管理(IPM)項目。產品創新和法規核准的持續推進也增強了該細分市場的商業性潛力。 2026年2月,Vestaron公司的BASIN產品獲得美國環保署(EPA)批准,可用於戶外農業,防治鱗翅目昆蟲和軟體動物。這項進展拓展了生物防治的選擇範圍,並將推動美國生物農藥市場的持續成長。
其他好處:
- Excel格式的市場預測(ME)表
- 3個月的分析師支持
目錄
第1章:引言
- 研究假設和市場定義
- 調查範圍
- 調查方法
第2章:本報告的內容
第3章:執行摘要和主要發現
第4章:主要產業趨勢
- 有機耕作面積
- 人均有機產品支出
- 法律規範
- 價值鍊和通路分析
- 市場促進因素
- 在美國擴大有機農業和無農藥殘留作物生產
- 在玉米、大豆、特種作物和棉花計畫中引入生技藥品
- 零售和食品加工行業的殘留物控制要求
- 國內發酵生產能力和供應鏈的在地化
- 美國各地大學、推廣機構和農場建立的檢測設施網路正在增強種植者的信心。
- 抗藥性管理計畫中對傳統農藥替代方案的需求
- 市場限制因素
- 與傳統農藥相比,每英畝成本更高。
- 在美國,產品性能會因氣候帶和種植區域而異。
- 活微生物產品的冷鏈和保存期限限制
- 美國在實際效果和投資報酬率 (ROI) 指標的標準化方面還不夠完善。
第5章 市場規模與成長預測
- 按形式
- 生物來源的消毒劑
- 生物除草劑
- 生物來源殺蟲劑
- 其他生物農藥
- 按作物類型
- 經濟作物
- 園藝作物
- 大田作物
第6章 競爭情勢
- 市場集中度
- 策略趨勢
- 市佔率分析
- 公司簡介
- Bayer AG
- BASF SE
- Corteva Agriscience LLC(Corteva, Inc.)
- FMC Corporation
- Sumitomo Biorational Company LLC(Sumitomo Chemical Co., Ltd.)
- Certis USA LLC(Mitsui & Co., Ltd.)
- Syngenta Group Co., Ltd.(Sinochem Holdings Corporation Ltd.)
- Koppert BV
- Andermatt Group AG
- Valent BioSciences LLC
- BioWorks Inc.(Biobest Group NV)
- AgBiome, Inc.
- AMVAC Chemical Corporation(American Vanguard Corporation)
- Nufarm Limited
- Novonesis A/S
第7章相關人員的關鍵策略問題
According to Mordor Intelligence, the United States biopesticides market size was valued at USD 1.86 billion in 2025 and is estimated to grow from USD 2.10 billion in 2026 to USD 3.82 billion by 2031, at a CAGR of 12.7% during the forecast period (2026-2031).
This report is Segmented by Form (Biofungicides, Bioherbicides, and More) and by Crop Type (Cash Crops, Horticultural Crops, and Row Crops). The Market Forecasts are Provided in Terms of Value (USD) and Volume (Metric Tons).
United States Biopesticides Market Trends and Insights
Expansion of United States Organic and Residue-Sensitive Crop Production
The expansion of organic farming and increasing demand for residue-compliant agricultural products are driving the adoption of biopesticides in the United States. Organic production standards prohibit most synthetic pesticides, while export-oriented fruit, vegetable, tree nut, and specialty crop growers are increasingly incorporating biological crop protection products to comply with maximum residue limit (MRL) requirements and retailer sustainability programs. Biopesticides are also being integrated into conventional farming systems as part of integrated pest management (IPM) strategies to reduce chemical residues while maintaining crop productivity. According to the United States Department of Agriculture (USDA) Economic Research Service (ERS), United States organic food sales reached a record USD 65.4 billion in 2024, reflecting continued growth in consumer demand for organically produced food and supporting the expansion of organic production systems. This trend is encouraging wider adoption of biopesticides across high-value crops, strengthening long-term growth in the United States biopesticides market.
Adoption of Biologicals in Corn, Soybean, Specialty-Crop, and Cotton Programs
The United States biopesticides market is supported by broader adoption of biological products across mainstream cropping systems. A 2025 Frontiers study in Insect Science reported that 45% of row-crop producers used biologicals in 2024, an increase of 8 percentage points from past 2 years. The same study found that 63% of leading agricultural retailers reported biological product sales growth during 2024. Seed treatments for Bt-resistant corn rootworm areas and foliar programs for soybean rust indicate that biological products are gaining roles beyond organic production. Southeast cotton programs are incorporating biofungicides for seedling disease management and bioinsecticides for bollworm populations with pyrethroid resistance. Bacillus-based products registered for multiple crops under a single label can reduce registration costs per acre and expand product access across corn, soybean, and specialty-crop systems.
Higher Per-Acre Cost Compared with Conventional Pesticides
The higher per-acre cost of biopesticides compared with conventional chemical pesticides remains a key barrier to adoption, particularly in broad-acre row crops where profit margins are relatively low. Microbial biopesticides often require specialized fermentation, formulation, and quality-control processes that increase production costs, while certain biological products also require more frequent applications to maintain efficacy under field conditions. As a result, growers in crops such as corn, soybean, and wheat may be reluctant to replace lower-cost synthetic pesticides unless clear economic benefits are demonstrated. Although improvements in domestic fermentation capacity, strain development, and manufacturing efficiency are anticipated to reduce production costs over time, price competitiveness remains a challenge. Consequently, suppliers in the United States biopesticides market must demonstrate measurable value through yield protection, resistance management, residue compliance, or premium market access to justify the higher treatment cost.
Other drivers and restraints analyzed in the detailed report include:
- Retail and Food-Processor Requirements for Residue Management
- Demand for Alternatives to Conventional Pesticides in Resistance-Management Programs
- Cold-Chain and Shelf-Life Constraints for Living Microbial Products
For complete list of drivers and restraints, kindly check the Table Of Contents.
Segment Analysis
Biofungicides accounted for 49.0% of the United States biopesticides market share in 2025, making them the largest product segment. Their widespread adoption is driven by applications in seed treatment, soil drench, and foliar disease management across row crops, fruits, vegetables, and specialty crops. Biofungicides are widely used in certified organic production and increasingly integrated into conventional farming systems to manage diseases while supporting residue compliance and resistance-management strategies. Their established role in controlling soybean sudden death syndrome, corn seedling diseases, and cotton Rhizoctonia has reinforced their commercial position. By contrast, bioherbicides and other product categories remain smaller because achieving consistent weed control under diverse climatic and agronomic conditions continues to be a technical challenge.
Bioinsecticides are projected to expand at a 15.0% CAGR between 2026 and 2031, making them the fastest-growing product segment in the United States biopesticides market. Growth is driven by increasing demand for alternative modes of action to address insecticide resistance and support integrated pest management (IPM) programs. Product innovation and regulatory approvals continue to strengthen the segment's commercial potential. In February 2026, Vestaron received United States Environmental Protection Agency (EPA) approval for BASIN for outdoor agricultural use against lepidopteran pests and soft-bodied insects. This development expands biological insect-control options and supports the continued growth of the United States biopesticides market.
Complete Report Scope:
- By Form
- Biofungicides
- Bioherbicides
- Bioinsecticides
- Other Biopesticides
- By Crop Type
- Cash Crops
- Horticultural Crops
- Row Crops
List of Companies Covered in this Report:
- Bayer AG
- BASF SE
- Corteva Agriscience LLC (Corteva, Inc.)
- FMC Corporation
- Sumitomo Biorational Company LLC (Sumitomo Chemical Co., Ltd.)
- Certis USA LLC (Mitsui & Co., Ltd.)
- Syngenta Group Co., Ltd. (Sinochem Holdings Corporation Ltd.)
- Koppert B.V.
- Andermatt Group AG
- Valent BioSciences LLC
- BioWorks Inc. (Biobest Group NV)
- AgBiome, Inc.
- AMVAC Chemical Corporation (American Vanguard Corporation)
- Nufarm Limited
- Novonesis A/S
Additional Benefits:
- The market estimate (ME) sheet in Excel format
- 3 months of analyst support
TABLE OF CONTENTS
1 INTRODUCTION
- 1.1 Study Assumptions and Market Definition
- 1.2 Scope of the Study
- 1.3 Research Methodology
2 REPORT OFFERS
3 EXECUTIVE SUMMARY AND KEY FINDINGS
4 KEY INDUSTRY TRENDS
- 4.1 Area Under Organic Cultivation
- 4.2 Per Capita Spending on Organic Products
- 4.3 Regulatory Framework
- 4.4 Value Chain and Distribution Channel Analysis
- 4.5 Market Drivers
- 4.5.1 Expansion of United States organic and residue-sensitive crop production
- 4.5.2 Adoption of biologicals in corn, soybean, specialty-crop, and cotton programs
- 4.5.3 Retail and food-processor requirements for residue management
- 4.5.4 Domestic fermentation capacity and supply-chain localization
- 4.5.5 United States university, extension, and on-farm trial networks improving grower confidence
- 4.5.6 Demand for alternatives to conventional pesticides in resistance-management programs
- 4.6 Market Restraints
- 4.6.1 Higher per-acre cost compared with conventional pesticides
- 4.6.2 Variable product performance across United States climatic and cropping zones
- 4.6.3 Cold-chain and shelf-life constraints for living microbial products
- 4.6.4 Limited standardization of United States field-efficacy and return-on-investment metrics
5 MARKET SIZE AND GROWTH FORECASTS (VALUE AND VOLUME)
- 5.1 By Form
- 5.1.1 Biofungicides
- 5.1.2 Bioherbicides
- 5.1.3 Bioinsecticides
- 5.1.4 Other Biopesticides
- 5.2 By Crop Type
- 5.2.1 Cash Crops
- 5.2.2 Horticultural Crops
- 5.2.3 Row Crops
6 COMPETITIVE LANDSCAPE
- 6.1 Market Concentration
- 6.2 Strategic Moves
- 6.3 Market Share Analysis
- 6.4 Company Profiles (Includes Global Level Overview, Market Level Overview, Core Segments, Financials as Available, Strategic Information, Market Rank/Share for Key Companies, Products and Services, and Recent Developments)
- 6.4.1 Bayer AG
- 6.4.2 BASF SE
- 6.4.3 Corteva Agriscience LLC (Corteva, Inc.)
- 6.4.4 FMC Corporation
- 6.4.5 Sumitomo Biorational Company LLC (Sumitomo Chemical Co., Ltd.)
- 6.4.6 Certis USA LLC (Mitsui & Co., Ltd.)
- 6.4.7 Syngenta Group Co., Ltd. (Sinochem Holdings Corporation Ltd.)
- 6.4.8 Koppert B.V.
- 6.4.9 Andermatt Group AG
- 6.4.10 Valent BioSciences LLC
- 6.4.11 BioWorks Inc. (Biobest Group NV)
- 6.4.12 AgBiome, Inc.
- 6.4.13 AMVAC Chemical Corporation (American Vanguard Corporation)
- 6.4.14 Nufarm Limited
- 6.4.15 Novonesis A/S
7 KEY STRATEGIC QUESTIONS FOR STAKEHOLDERS

 生物農藥市場規模、佔有率、成長、全球產業分析、區域趨勢及2026年至2034年預測。
 細菌生物農藥:市場佔有率分析、產業趨勢與統計、成長預測(2026-2031)日本生物農藥:市場佔有率分析、產業趨勢與統計、成長預測(2026-2031)中國生物農藥市場:市場佔有率分析、產業趨勢與統計及成長預測(2026-2031年)
 生物農藥市場:2026-2032年全球市場預測(按類型、作物、製劑形式、生物來源、應用、銷售管道和最終用戶分類)
 生物農藥市場預測至2034年-按產品類型、作物類型、原料、配方、應用方式和地區分類的全球分析
 液體生物農藥市場規模、佔有率和成長分析:按產品類型、原料、應用方法、作物、配方類型、最終用戶、配銷通路和地區分類——2026-2033年行業預測
 生物殺蟲劑市場報告:按產品、配方、原料、應用方法、作物類型和地區分類(2026-2034 年)全球生物農藥市場規模、佔有率、趨勢和成長分析報告(2026-2034年)
 2026年全球生物農藥市場報告