


 |
市場調查報告書
商品編碼
2120373
水耕法:市佔率分析、產業趨勢與統計、成長預測(2026-2031)Hydroponics - Market Share Analysis, Industry Trends & Statistics, Growth Forecasts (2026 - 2031) |
||||||

※ 本網頁內容可能與最新版本有所差異。詳細情況請與我們聯繫。
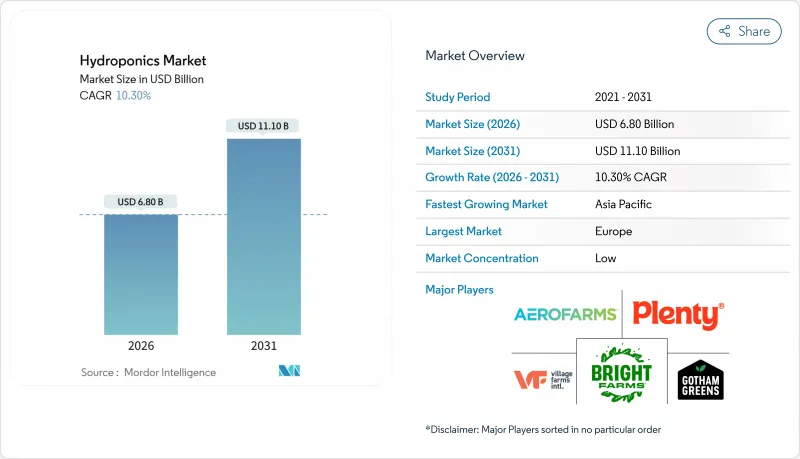
據 Mordor Intelligence 稱,水耕市場預計在 2026 年達到 68 億美元,預計到 2031 年將達到 111 億美元,預測期內複合年成長率為 10.30%。
本報告按生產系統(溫室水耕、室內垂直農業等)、作物類型(綠葉類、番茄、黃瓜等)、設備(照明系統、灌溉組件、水泵等)、生產規模(大型、中型、小規模)和地區(北美、南美、歐洲等)進行細分。市場預測以美元計價。
全球水耕市場趨勢及洞察
受控環境下的糧食安全措施
目前,水耕技術已被納入全球多個項目中,作為緩解氣候變遷影響的關鍵基礎設施策略的一部分。美國農業部(USDA)根據《美國法典》第7篇第5925g條,資助城市和室內農業發展,並利用研究津貼建設試點設施,以驗證其商業性可行性。日本農林水產省(MAFF)的目標是到2030年實現50%的智慧農業普及率,優先發展可控環境,以在颱風季節穩定生產。中國的《國家智慧農業行動計畫》要求在保護性農業試點計畫中應用物聯網(IoT)和人工智慧(AI)技術,從而加速國內對該領域的投資。印度的「數位農業計畫」已撥款281.7億盧比(約3.38億美元)用於精密農業基礎建設,同時其「清潔植物計畫」也投資176.567億盧比(約2.12億美元)用於無病種苗。這些政策降低了資金籌措成本,規範了法律規範,加速了水耕技術在商業種植者中的普及,而這些種植者以前認為水耕技術在經濟上負擔不起。
人均可耕種面積減少
土地稀缺進一步增強了無土栽培的經濟合理性。根據聯合國糧食及農業組織(糧農組織)的紀錄,2000年至2024年間,全球人均可耕種面積減少了20%,從0.24公頃減少到0.20公頃。亞太地區無序的城市擴張和中東的水資源限制了土壤耕作的擴張空間。水耕技術可透過垂直堆疊生產設施或在屋頂、倉庫等未耕地上安裝系統,將可用耕地面積增加多達80倍。在荷蘭,儘管耕地有限,但溫室叢集正被用於出口高產量蔬菜,這表明當土地不再是阻礙因素時,無土栽培能夠帶來巨大的潛在效益。隨著人均可耕種面積日益稀缺,垂直基礎設施的成本效益正在超過土地購置,尤其是在人口稠密的城市地區。
大型系統的高資本投入
承包的垂直農業系統建設成本可能超過每平方公尺1000美元,對於小規模投資者而言,投資回收期超過七年並不罕見。雖然一些大型營運商歷來依賴大量創業投資資金來為自動化設施資金籌措,但正如Kalera PLC申請破產保護所表明的那樣,高資本密集度對槓桿擴大策略構成了挑戰。 Village Farms International決定在2025年以4000萬美元和37.9%的股份將其生鮮食品部門私有化,這表明企業面臨著精簡資產負債表的結構性壓力。為了降低初始投資風險,小規模生產商越來越傾向於採用模組化或租賃式農業模式,將資本支出重新分配到營運成本上,從而提高柔軟性並降低財務風險。
細分市場分析
預計到2025年,溫室水耕將佔銷售額的68.3%,主要得益於Village Farms International在德克薩斯州佔地550萬平方英尺的綜合設施,以及荷蘭一個結合太陽能和餘熱回收的大型叢集。隨著市政當局在追求更具韌性的「最後一公里」供應鏈的同時,盡可能減少冷藏運輸,預計到2031年,室內垂直農業將以13.4%的複合年成長率成長。貨櫃式水耕系統雖然仍屬於小眾市場,但其模組化、可快速部署的單元使其能夠滿足偏遠地區和分散式種植的需求,適用於機構、研究機構和緊急應變場所。
自動化正在降低人事費用,縮小垂直種植設施與傳統溫室之間的成本差距。昕諾飛(Signify)最新的LED燈具降低了能耗,提高了在電力消耗量高的地區部署高層種植塔的可行性。 Plenty Unlimited Inc.與Mawarid成立的6.8億美元合資企業表明,在傳統溫室冷卻成本過高的地區,中東資本正湧入垂直種植平台。隨著照明技術和機器人技術的日益成熟,水耕市場可能會進一步轉向多層結構,從而更有效地利用有限的城市土地。
到2025年,綠葉蔬菜將佔水耕市場規模的47.2%。這主要得益於其30-45天的短收穫週期,從而最大限度地提高了水耕種植者的周轉率和現金流。預計到2031年,香草和微型菜苗的複合年成長率將達到12.6%,因為醫藥和保健品買家需要不含農藥且植物化學成分可追溯的生質能。番茄、黃瓜和辣椒合計佔據第二大市場佔有率,它們利用高架溫室系統來確保全年生產,以滿足超級市場的供貨合約。
製藥業的廣泛應用正在重新定義收入潛力。 AeroFarms正與製藥研發公司合作生產特殊萃取物,這表明生產商可以將業務從供應普通作物轉向提供活性成分。在靠近大規模消費市場的地區,綠葉作物預計仍將佔據主導地位。這是因為較短的種植週期可以抵消營運成本,而高價值草藥帶來的更高利潤率可以緩衝能源價格波動的影響。未來,鼓勵減少水和能源消耗的碳定價機制可能會促使生產轉向更有效率的作物。
區域分析
預計到2025年,歐洲將佔水耕市場銷售額的34.3%。這主要得益於荷蘭溫室蔬菜出口以及歐盟嚴格的廢水排放法規,這些法規促進了水資源再利用技術的創新。儘管區域成長勢頭明顯,但其成長速度正受到產能過剩和電力成本上漲的限制。德國、英國、法國和西班牙正致力於透過LED維修和流程自動化來提高效率,而不是擴大種植面積。俄羅斯在取得這項技術方面面臨挑戰,而斯堪地那維亞國家正在進行利用地熱和水力發電建設碳中和溫室的試點計畫。
亞太地區預計將引領市場,以12.2%的複合年成長率超越其他主要地區。中國在2024年11月制定的「智慧農業行動計畫」中,重點發展水耕技術,並撥出國家資金用於物聯網賦能的環境控制系統。印度的「數位農業計畫」已撥款281.7億盧比(約3.38億美元)用於精密農業和環境控制系統,以推廣水耕技術,提高用水效率和產量穩定性。日本的目標是到2030年實現50%的智慧農業普及率,並著重發展水耕技術,以實現抗颱風和氣候可控的生產。在澳大利亞,沿海城市附近正在擴大水耕溫室,以確保都市區生鮮食品的穩定供應。同時,東南亞的都市區正在進行垂直水耕示範項目,以減少對進口農產品的依賴。
在北美,市場成長主要得益於美國農業部的資金支持,以及Village Farms International Inc.和Plenty Unlimited Inc.等推廣大規模、環境可控農業的公司的投資。在中東,阿拉伯聯合大公國和沙烏地阿拉伯等國正在投資水耕系統,以降低進口成本並節省地下水,阿布達比佔地10公頃的「農業科技園區」舉措就是一個例證。在南美,巴西和阿根廷的城市水耕計畫正在推動產業發展。同時,在非洲,儘管面臨電網可靠性方面的挑戰,南非和肯亞等國也在有針對性地部署水耕技術,以減少收穫後的損失。
其他好處:
- Excel格式的市場預測(ME)表
- 3個月的分析師支持
目錄
第1章:引言
- 研究假設和市場定義
- 調查範圍
第2章:調查方法
第3章執行摘要
第4章 市場狀況
- 市場概覽
- 市場促進因素
- 受控環境下的糧食安全措施
- 人均可耕種面積減少
- 全年生產優勢
- 排碳權收入的積累
- 醫藥級原料的需求
- 關於都市污水再利用的規定
- 市場限制因素
- 對大型系統進行大量資本投資
- 人工照明中的能源成本敏感性
- 加強微量營養素排泄法規
- 水耕栽培材料所用種子缺乏遺傳多樣性。
- 監理情勢
- 技術展望
- 波特五力分析
第5章 市場規模與成長預測
- 透過生產系統
- 溫室水耕
- 室內垂直農場
- 貨櫃農場
- 按作物類型
- 綠葉蔬菜
- 番茄
- 黃瓜
- 青椒
- 香草和微型菜苗
- 透過裝置
- 照明系統
- 灌溉組件和水泵
- 氣候系統
- 自動化和控制系統
- 結構構件
- 按生產規模
- 大規模
- 中號
- 小規模
- 按地區
- 北美洲
- 美國
- 加拿大
- 其他北美國家
- 南美洲
- 巴西
- 阿根廷
- 其他南美國家
- 歐洲
- 德國
- 荷蘭
- 英國
- 法國
- 西班牙
- 其他歐洲國家
- 亞太地區
- 中國
- 日本
- 印度
- 澳洲
- 其他亞太國家
- 中東
- 阿拉伯聯合大公國
- 沙烏地阿拉伯
- 其他中東國家
- 非洲
- 南非
- 肯亞
- 其他非洲國家
- 北美洲
第6章 競爭情勢
- 市場集中度
- 策略趨勢
- 市佔率分析
- 公司簡介
- BrightFarms(Cox Enterprises)
- Plenty Unlimited Inc.
- Crop One Holdings Inc.
- 80 Acres Urban Agriculture Inc.
- Little Leaf Farms Inc.
- GoodLeaf Farms(McCain Foods Ltd.)
- Pure Harvest Smart Farms Holding
- Green Sense Farms Holdings Inc.
- Nordic Harvest A/S
- Oishii Farm Corporation
- Gotham Greens Inc.
- AeroFarms Inc.
- Village Farms International Inc.
- Sundrop Farms(Centuria Capital Group)
- GrowUp Farms(Sun Capital Partners)
第7章 市場機會與未來展望
According to Mordor Intelligence, the hydroponics market size is estimated to be USD 6.80 billion in 2026 and is projected to reach USD 11.10 billion by 2031, supported by a 10.30% CAGR through the forecast period.
This report is Segmented by Production System (Greenhouse Hydroponics, Indoor Vertical Farms, and More), by Crop Type (Leafy Greens, Tomatoes, Cucumbers, and More), by Equipment (Lighting Systems, Irrigation Components and Pumps, and More) by Production Scale (Large, Medium, and Small), and by Geography (North America, South America, Europe, and More). The Market Forecasts are Provided in Terms of Value (USD).
Global Hydroponics Market Trends and Insights
Controlled-Environment Food-Security Initiatives
National programs now position hydroponics within critical-infrastructure strategies that mitigate climate shocks. The United States Department of Agriculture (USDA) funds urban and indoor agriculture under 7 USC 5925g, turning research grants into pilot facilities that demonstrate commercial viability. Japan's Ministry of Agriculture, Forestry and Fisheries (MAFF) targets 50% smart-agriculture adoption by 2030, prioritizing controlled environments that stabilize output during typhoon seasons. China's National Smart Agriculture Action Plan mandates the use of the Internet of Things (IoT) and artificial intelligence in facility agriculture pilots, thereby accelerating domestic investment in this sector. India's Digital Agriculture Mission earmarked Rs 2,817 crore (USD 338 million) for precision-farming infrastructure, while the Clean Plant Programme channels Rs 1,765.67 crore (USD 212 million) into disease-free nursery material. These policies compress financing costs and standardize regulatory pathways, speeding adoption among commercial growers who once viewed hydroponics as capital-prohibitive.
Declining Arable Land per Capita
Land scarcity intensifies the economic rationale for soilless cultivation. The Food and Agriculture Organization (FAO) recorded a 20% drop in global arable land per person, from 0.24 to 0.20 hectares between 2000 and 2024. Urban sprawl in the Asia-Pacific and water constraints in the Middle East leave limited expansion room for soil farming. Hydroponics multiplies usable growing area up to 80 times by stacking production vertically or fitting systems onto non-arable sites, such as rooftops and warehouses. The Netherlands utilizes greenhouse clusters to export high-yield vegetables, despite having scarce farmland, illustrating the potential leverage when land is no longer the limiting factor. As per-capita arable acreage becomes increasingly scarce, the cost-benefit of vertical infrastructure outweighs land acquisition, especially near high-density cities.
High Capital Expenditure for Large Systems
Turnkey vertical farming systems can exceed USD 1,000 per square meter, often extending payback periods beyond seven years for smaller investors. While several large-scale operators historically relied on substantial venture funding to finance automated facilities, capital intensity has proven challenging for highly leveraged expansion strategies, as evidenced by the Chapter 11 filing of Kalera PLC. Village Farms International Inc. opted to privatize its fresh-produce unit for USD 40 million and a 37.9% equity stake in 2025, illustrating structural pressure to streamline its balance sheet. To mitigate upfront investment risk, smaller growers are increasingly favoring modular or leased cultivation formats that shift capital expenditures toward operating expenses, thereby improving flexibility and reducing financial exposure.
Other drivers and restraints analyzed in the detailed report include:
- Year-Round Output Advantages
- Pharmaceutical-Grade Ingredient Demand
- Energy-Cost Sensitivity for Artificial Lighting
For complete list of drivers and restraints, kindly check the Table Of Contents.
Segment Analysis
Greenhouse hydroponics generated 68.3% of 2025 revenue, supported by the 5.5 million-square-foot Village Farms International Inc. complex in Texas and extensive Dutch clusters that combine sunlight with waste-heat capture. Indoor vertical farms are projected to grow at a 13.4% CAGR through 2031, as municipalities pursue resilient last-mile supply chains while minimizing refrigerated freight. Container-based hydroponic systems, although representing a niche market, continue to address remote and decentralized demand through modular, rapidly deployable units suited for institutional, research, and emergency-response settings.
Automation compresses labor costs, narrowing the historical cost gap between vertical structures and greenhouses. Signify's newest LEDs reduce energy draw, making high-rise grow towers more viable in power-intensive regions. Plenty Unlimited Inc.'s USD 680 million joint venture with Mawarid signals that Middle Eastern capital is gravitating toward vertical platforms where conventional greenhouse cooling is cost-prohibitive. As lighting and robotics mature, the hydroponics market will shift further toward multi-tier formats that capitalize on scarce urban land.
Leafy greens accounted for 47.2% of the hydroponics market size in 2025, driven by 30-45 day harvest cycles that maximize turns and cash flow for hydroponic growers. Herbs and microgreens are anticipated to post a 12.6% CAGR through 2031, as pharmaceutical and nutraceutical buyers demand pesticide-free biomass with traceable phytochemical profiles. Tomatoes, cucumbers, and peppers collectively form the second-largest value block, utilizing high-wire greenhouse systems to produce year-round volumes in line with supermarket contracts.
Pharmaceutical uptake redefines revenue potential. AeroFarms Inc. partners with drug developers to produce specialty extracts, illustrating how growers can pivot from commodity produce to active-ingredient supply. Leaf-crop dominance will continue near large consumer bases because rapid cycles offset operating expenses, yet the margin upside in high-value herbs acts as a buffer against energy volatility. Over time, carbon-pricing schemes that reward lower water and energy footprints may further shift production toward crops with superior efficiency metrics.
Complete Report Scope:
- By Production System
- Greenhouse Hydroponics
- Indoor Vertical Farms
- Container Farms
- By Crop Type
- Leafy Greens
- Tomatoes
- Cucumbers
- Peppers
- Herbs and Microgreens
- By Equipment
- Lighting Systems
- Irrigation Components and Pumps
- Climate Systems
- Automation and Control Systems
- Structural Components
- By Production Scale
- Large
- Medium
- Small
- By Geography
- North America
- United States
- Canada
- Rest of North America
- South America
- Brazil
- Argentina
- Rest of South America
- Europe
- Germany
- Netherlands
- United Kingdom
- France
- Spain
- Rest of Europe
- Asia-Pacific
- China
- Japan
- India
- Australia
- Rest of Asia-Pacific
- Middle East
- United Arab Emirates
- Saudi Arabia
- Rest of Middle East
- Africa
- South Africa
- Kenya
- Rest of Africa
- North America
Geography Analysis
Europe accounted for 34.3% of the hydroponics market revenue in 2025, driven by Dutch greenhouse exports and stringent European Union (EU) discharge regulations that have spurred innovations in water reuse. While regional growth is evident, it's tempered by already high capacities and rising electricity costs. Instead of expanding acreage, Germany, the United Kingdom, France, and Spain focus on retrofitting with LEDs and automating processes to enhance efficiency. Russia faces technological access challenges, whereas Scandinavian nations experiment with carbon-neutral greenhouses, harnessing geothermal and hydropower.
Asia-Pacific is set to lead with a 12.2% CAGR, outpacing other major regions. China's "Smart Agriculture Action Plan" for November 2024 allocates state funds to IoT-driven controlled environments, with a particular focus on hydroponics. India's Digital Agriculture Mission has allocated Rs 2,817 crore (approximately USD 338 million) to precision and controlled-environment systems, fostering the adoption of hydroponics to enhance water efficiency and yield stability. Japan aims for a 50% adoption rate of smart agriculture by 2030, with a focus on hydroponics for typhoon-resilient and climate-controlled production. In Australia, hydroponic greenhouse sites are being expanded near coastal cities to ensure a steady supply of fresh produce to urban areas. Meanwhile, Southeast Asian urban centers are experimenting with vertical hydroponics to reduce their dependence on imported produce.
In North America, the market growth is driven by funding from the United States Department of Agriculture, as well as investments from companies such as Village Farms International Inc. and Plenty Unlimited Inc., which are advancing large-scale, controlled-environment farming. In the Middle East, countries such as the United Arab Emirates and Saudi Arabia are investing in hydroponic systems to reduce import costs and conserve groundwater, as demonstrated by Abu Dhabi's 10-hectare AgTech Park initiative. In South America, urban hydroponic projects in Brazil and Argentina are driving progress. Meanwhile, in Africa, targeted deployments in South Africa and Kenya are leveraging hydroponics to address post-harvest losses, despite challenges related to power grid reliability.
- BrightFarms (Cox Enterprises)
- Plenty Unlimited Inc.
- Crop One Holdings Inc.
- 80 Acres Urban Agriculture Inc.
- Little Leaf Farms Inc.
- GoodLeaf Farms (McCain Foods Ltd.)
- Pure Harvest Smart Farms Holding
- Green Sense Farms Holdings Inc.
- Nordic Harvest A/S
- Oishii Farm Corporation
- Gotham Greens Inc.
- AeroFarms Inc.
- Village Farms International Inc.
- Sundrop Farms (Centuria Capital Group)
- GrowUp Farms (Sun Capital Partners)
Additional Benefits:
- The market estimate (ME) sheet in Excel format
- 3 months of analyst support
TABLE OF CONTENTS
1 Introduction
- 1.1 Study Assumptions and Market Definition
- 1.2 Scope of the Study
2 Research Methodology
3 Executive Summary
4 Market Landscape
- 4.1 Market Overview
- 4.2 Market Drivers
- 4.2.1 Controlled-environment food-security initiatives
- 4.2.2 Declining arable land per capita
- 4.2.3 Year-round output advantages
- 4.2.4 Carbon-credit revenue stacking
- 4.2.5 Pharmaceutical-grade ingredient demand
- 4.2.6 Urban wastewater-reuse regulations
- 4.3 Market Restraints
- 4.3.1 High capital expenditure for large systems
- 4.3.2 Energy-cost sensitivity for artificial lighting
- 4.3.3 Tightening micronutrient-discharge regulations
- 4.3.4 Limited seed genetics for hydroponic inputs
- 4.4 Regulatory Landscape
- 4.5 Technological Outlook
- 4.6 Porter's Five Forces Analysis
- 4.6.1 Threat of New Entrants
- 4.6.2 Bargaining Power of Buyers
- 4.6.3 Bargaining Power of Suppliers
- 4.6.4 Threat of Substitutes
- 4.6.5 Intensity of Competitive Rivalry
5 Market Size and Growth Forecasts (Value)
- 5.1 By Production System
- 5.1.1 Greenhouse Hydroponics
- 5.1.2 Indoor Vertical Farms
- 5.1.3 Container Farms
- 5.2 By Crop Type
- 5.2.1 Leafy Greens
- 5.2.2 Tomatoes
- 5.2.3 Cucumbers
- 5.2.4 Peppers
- 5.2.5 Herbs and Microgreens
- 5.3 By Equipment
- 5.3.1 Lighting Systems
- 5.3.2 Irrigation Components and Pumps
- 5.3.3 Climate Systems
- 5.3.4 Automation and Control Systems
- 5.3.5 Structural Components
- 5.4 By Production Scale
- 5.4.1 Large
- 5.4.2 Medium
- 5.4.3 Small
- 5.5 By Geography
- 5.5.1 North America
- 5.5.1.1 United States
- 5.5.1.2 Canada
- 5.5.1.3 Rest of North America
- 5.5.2 South America
- 5.5.2.1 Brazil
- 5.5.2.2 Argentina
- 5.5.2.3 Rest of South America
- 5.5.3 Europe
- 5.5.3.1 Germany
- 5.5.3.2 Netherlands
- 5.5.3.3 United Kingdom
- 5.5.3.4 France
- 5.5.3.5 Spain
- 5.5.3.6 Rest of Europe
- 5.5.4 Asia-Pacific
- 5.5.4.1 China
- 5.5.4.2 Japan
- 5.5.4.3 India
- 5.5.4.4 Australia
- 5.5.4.5 Rest of Asia-Pacific
- 5.5.5 Middle East
- 5.5.5.1 United Arab Emirates
- 5.5.5.2 Saudi Arabia
- 5.5.5.3 Rest of Middle East
- 5.5.6 Africa
- 5.5.6.1 South Africa
- 5.5.6.2 Kenya
- 5.5.6.3 Rest of Africa
- 5.5.1 North America
6 Competitive Landscape
- 6.1 Market Concentration
- 6.2 Strategic Moves
- 6.3 Market Share Analysis
- 6.4 Company Profiles (Includes Global level Overview, Market Level Overview, Core Segments, Financials as Available, Strategic Information, Market Rank/Share for Key Companies, Products and Services, and Recent Developments)
- 6.4.1 BrightFarms (Cox Enterprises)
- 6.4.2 Plenty Unlimited Inc.
- 6.4.3 Crop One Holdings Inc.
- 6.4.4 80 Acres Urban Agriculture Inc.
- 6.4.5 Little Leaf Farms Inc.
- 6.4.6 GoodLeaf Farms (McCain Foods Ltd.)
- 6.4.7 Pure Harvest Smart Farms Holding
- 6.4.8 Green Sense Farms Holdings Inc.
- 6.4.9 Nordic Harvest A/S
- 6.4.10 Oishii Farm Corporation
- 6.4.11 Gotham Greens Inc.
- 6.4.12 AeroFarms Inc.
- 6.4.13 Village Farms International Inc.
- 6.4.14 Sundrop Farms (Centuria Capital Group)
- 6.4.15 GrowUp Farms (Sun Capital Partners)
7 Market Opportunities and Future Outlook

 水耕家庭園藝市場預測至2034年-按組件、系統類型、作物類型、通路、最終用戶和地區分類的全球分析
 被動式水耕全球市場規模、佔有率、趨勢和成長分析報告(2026-2034)
 南美洲水耕技術:市場佔有率分析、產業趨勢與統計、成長預測(2026-2031)
 無土栽培基質市場-2026-2032年全球市場預測無土栽培市場預測至2034年-按栽培系統、生長介質、設施類型、應用、最終用戶和地區分類的全球分析
 水耕市場:依類型、作物、種植面積及地區分類
 2026年全球水耕市場報告全球水耕種植介質市場規模、佔有率、趨勢和成長分析報告(2026-2034)
 被動式水耕市場規模、佔有率和趨勢分析報告:按類型、應用、地區和細分市場預測(2026-2033 年)全球水耕栽培系統市場預測(至2032年):依系統類型、組件、結構類型、作物類型、技術、最終用戶及地區分類