


 |
市場調查報告書
商品編碼
2119908
結構化佈線:市場佔有率分析、行業趨勢和統計數據、成長預測(2026-2031 年)Structured Cabling - Market Share Analysis, Industry Trends & Statistics, Growth Forecasts (2026 - 2031) |
||||||

※ 本網頁內容可能與最新版本有所差異。詳細情況請與我們聯繫。
根據 Mordor Intelligence 預測,結構化佈線市場規模預計將在 2025 年達到 120.8 億美元,2026 年達到 134.5 億美元,到 2031 年達到 212.6 億美元,2026 年至 2031 年的複合年成長率為 9.59%。
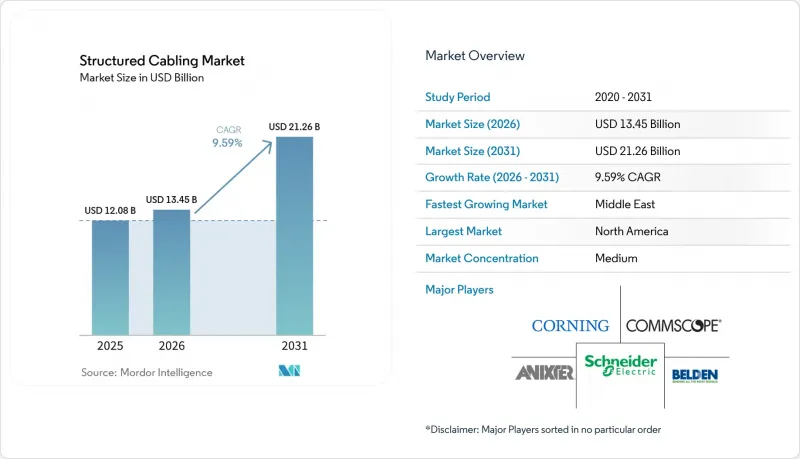
本報告按產品(硬體、服務、軟體)、線纜類型(銅纜、光纖)、線纜標準(Cat 5e、Cat 6、Cat 6A、Cat 7/7A、Cat 8)、應用領域(區域網路、資料中心、FTTx、工業自動化)、最終用戶(IT與電信市場預測以美元 (USD) 為單位。
全球結構化電纜市場趨勢與洞察
超大規模和邊緣資料中心的建設正在加速。
印度的資料中心容量預計將從2026年的約1.8吉瓦增加到2030年的4.5吉瓦,光是孟買一地的裝置容量預計就接近2吉瓦。二、三線城市的邊緣資料中心專案激增,需要預先端接主幹光纜在短週期內完成部署。 80-200千瓦的機架密度以及繞過聚合層的AI流量正在推動對高密度光纖、多芯推入式連接器和液冷式電纜配線架的需求。超大規模資料中心業者現在明確規定了延遲預算和光損耗裕度,而只有超低損耗光纖才能滿足這些要求。遵守印度《數位個人資料保護法》以及國家資料中心政策草案中的獎勵正在加速認證體系的普及。
PoE和遠端供電需求激增
IEEE 802.3bt 透過雙絞線電纜提供高達 90W 的功率,因此可透過單一電纜同時網路基地台、攝影機和感測器提供資料通訊和電源。隨著功率的增加,導體溫度也會升高,迫使安裝人員使用更粗的銅線或縮短佈線長度,以滿足 TIA 和 ISO/IEC 的溫度限制。採用支援 PoE 的光纖網路單元的被動光區域網路 (PON) 可集中供電,並降低危險工業區域發生火花的風險。 ETSI 的工業 PON 規範還強制要求採用擴展的溫度等級,雖然會增加成本,但可以擴大部署場景。在智慧建築營運中,PoE 預算軟體對於減少停機時間和確保符合設施能源法規變得越來越重要。
擴大企業無線區域網路和5G固定無線存取的部署。
Wi-Fi 7 在 6 GHz 頻段提供千兆Gigabit速度,從而徹底淘汰了辦公室中連接各個辦公桌的水平銅纜線路。專用中頻段 5G 網路覆蓋倉庫和醫院,每個基地台的涵蓋範圍積約為 15,000 平方米,有效緩解了移動性限制。整合式小型基地台設計降低了去程傳輸延遲,並允許重複利用現有 LAN 線纜,同時提高了 PoE回程傳輸的密度。這種權衡降低了對銅纜的需求,但增加了對高容量光纖上行鏈路和 PoE 預算管理軟體的需求。區域差異顯著。在歐洲,歷史悠久的石砌建築中仍保留著有線佈線,而美國的科技園區則呈現無線優先的趨勢。
細分市場分析
到2025年,硬體將佔據結構化佈線市場57.48%的佔有率,主要驅動力來自光纖主幹網路、連接器和高密度機架。緊隨其後的是服務領域,其成長主要得益於安裝人員利用預端接組件加速園區升級。儘管結構化佈線市場的軟體領域目前規模仍然較小,但預計到2031年,其複合年成長率將達到10.04%,超過所有其他產品領域,這反映出市場對數位化文件和PoE預算工具的需求日益成長。超大規模資料中心業者公司正在將實體層遙測技術整合到資料中心基礎設施管理(DCIM)套件中,以縮短平均修復時間(MTTR),而醫療保健和金融業的公司則專注於自動化合規性報告。
基於軟體的預測性維護演算法利用機器學習模型來預警輕微彎曲和連接器污染,從而確保人工智慧叢集的運作。一種新的授權模式將雲端控制面板與連接器保固捆綁在一起,將收入來源轉向經常性訂閱。同時,業務收益正從直接安裝轉向維修諮詢和搬遷、擴建及改造 (MAC) 的管理服務。主要整合商正在將維護合約與光纖幹線交叉銷售,從而擴大其客戶收入佔有率。未能整合硬體、服務和軟體的供應商將面臨利潤率下降的風險,因為買家需要「單一管理平台」。
預計到2025年,光纖將佔64.12%的市場佔有率,年複合成長率達10.34%,鞏固其作為結構化光纜市場骨幹的地位。單模光纖在長距離連接中佔據主導地位,而多模光纖則在500公尺以下的短距離連結中佔據主導地位。隨著主動光纜和線性光學技術的出現,每位元成本不斷降低,支出正進一步轉移到光纖。
在注重成本的維修工程中,銅線仍扮演著至關重要的角色;在屏蔽雙絞線能有效降低電磁干擾的嚴苛工業環境中,銅線更是不可或缺。對於某些機架頂部鏈路而言,長度超過30公尺的8類電纜仍然比光纖更經濟,這延緩了完全替換為光纖的進程。永續性政策正推動銅線和光纖採用低煙、無鹵護套,這略微增加了材料成本。光纖混合線纜因其在單層護套內同時提供光纖頻寬和PoE供電功能而備受關注,從而縮短了智慧建築維修的安裝時間。
區域分析
到2025年,亞太地區將佔據結構化光纜市場30.59%的佔有率,主要得益於印度資料中心和中國人工智慧園區的快速擴張。模組化邊緣設施正在印度二線城市(如科欽和維沙卡帕特南)部署,這些城市非常適合預先連接主幹光纜。日本的工業自動化和韓國的電子產業叢集推動了工廠光纜需求的成長,而東協地區光纖到戶(FTTH)的部署則帶動了戶外光纜的需求。
北美市場依然成熟且充滿活力,超大規模資料中心業者主要集中在維吉尼亞、奧勒岡州和德克薩斯州。智慧建築維修正在為現有辦公室增加支援PoE供電的鏈路,而Cat 8線則被用於託管機房的短距離連接。聯邦政府的永續性目標正在推動政府所有物業採用低煙無鹵(LSZH)線纜,規範制定負責人也在選擇經過認證的供應商。
歐洲的成長主要得益於低菸無鹵 (LSZH) 法規、為提高能源效率而維修,以及德國和法國向工業 4.0 的升級。由於在歷史建築中鋪設新的管道線路難度較大,微型光纜和氣吹光纖正日益受到關注。中東市場雖然規模較小,但其複合年成長率 (CAGR) 最高,達 10.56%。沙烏地阿拉伯的 NEOM 和阿拉伯聯合大公國的國家人工智慧中心都需要Terabit網路結構和吉瓦級電源。
拉丁美洲和非洲由於高度依賴進口和經濟波動而落後,但需求集中在特定產業,這主要得益於巴西的雲端運算基礎設施發展和奈及利亞的金融科技繁榮。政治穩定和低電價正日益成為超大規模資料中心業者位置選址的重要因素,新增容量正從傳統的歐美中心重新分配到亞洲和中東。
其他好處:
- Excel格式的市場預測(ME)表
- 3個月的分析師支持
目錄
第1章:引言
- 研究假設和市場定義
- 調查範圍
第2章:調查方法
第3章執行摘要
第4章 市場狀況
- 市場概覽
- 市場促進因素
- 超大規模和邊緣資料中心的建設正在加速。
- 對 PoE 和遠端供電的需求激增
- 智慧建築及園區維修工程增加
- 在人工智慧叢集引入400G/800G主動式光纜
- 推廣低煙、無鹵電纜的永續性要求
- 以工業4.0時間敏感型網路的OT/IT整合佈線
- 市場限制因素
- 擴大WLAN和5G固定無線存取在企業中的部署。
- 銅纜和光纖供應鏈的波動性
- 新興的矽光電技術無需高速銅線佈線。
- 模組化插頭端子的連接器使用日益普及,導致對配線架的需求下降。
- 產業價值鏈分析
- 監理情勢
- 技術展望
- 波特五力分析
- 宏觀經濟因素對市場的影響
- 主要用例和案例研究
- 投資分析
第5章 市場規模與成長預測
- 報價
- 硬體
- 電纜(銅線、光纖電纜)
- 連接設備(連接器、配線架、插座、電纜)
- 機架、機櫃和線管理
- 服務
- 設計與諮詢
- 安裝與整合
- 維護和支援
- 軟體
- 硬體
- 按電纜類型
- 銅
- 銅纜
- 銅連接器
- 光纖
- 單模電纜
- 多模電纜
- 光纖連接
- 銅
- 電纜分類標準
- Cat 5e
- Cat 6
- Cat 6A
- Cat 7/7A
- Cat 8
- 透過使用
- LAN
- 資料中心
- FTTx,校園骨幹網
- 工業自動化網路
- 按最終用戶行業分類
- IT和電信服務供應商
- 雲端和託管資料中心
- 銀行、金融服務和保險 (BFSI) 以及公司辦公室
- 醫療機構
- 政府/國防
- 製造業和工業
- 教育
- 按地區
- 北美洲
- 美國
- 加拿大
- 墨西哥
- 南美洲
- 巴西
- 阿根廷
- 其他南美國家
- 歐洲
- 英國
- 德國
- 法國
- 義大利
- 西班牙
- 北歐的
- 俄羅斯
- 其他歐洲國家
- 亞太地區
- 中國
- 印度
- 日本
- 韓國
- ASEAN
- 澳洲
- 紐西蘭
- 其他亞太國家
- 中東和非洲
- 中東
- 沙烏地阿拉伯
- 阿拉伯聯合大公國
- 土耳其
- 其他中東國家
- 非洲
- 南非
- 埃及
- 奈及利亞
- 其他非洲國家
- 中東
- 北美洲
第6章 競爭情勢
- 市場集中度
- 策略趨勢
- 市佔率分析
- 公司簡介
- CommScope Holding Company Inc.
- Corning Incorporated
- Belden Inc.
- Legrand SA
- Nexans SA
- Panduit Corp.
- Prysmian Group
- Schneider Electric SE
- The Siemon Company
- TE Connectivity Ltd.
- Furukawa Electric Co. Ltd.
- Hubbell Incorporated
- Rosenberger Hochfrequenztechnik GmbH & Co. KG
- Datwyler Cabling Solutions AG
- LS Cable & System Ltd.
- Reichle & De-Massari AG(R&M)
- Superior Essex Inc.
- Anixter International Inc.(WESCO International)
- AFL(AFL Global)
- Black Box Corporation
第7章 市場機會與未來展望
According to Mordor Intelligence, the structured cabling market size is projected to be USD 12.08 billion in 2025, USD 13.45 billion in 2026, and reach USD 21.26 billion by 2031, growing at a CAGR of 9.59% from 2026 to 2031.
This report is Segmented by Offering (Hardware, Services, and Software), Cable Type (Copper, and Fiber), Cable Category Standard (Cat 5e, Cat 6, Cat 6A, Cat 7/7A, and Cat 8), Application (LAN, Data Center, Fttx, and Industrial Automation), End-User (IT and Telecom, Cloud and Colocation, BFSI, Healthcare, Government, Manufacturing, and Education), and Geography. Market Forecasts are in Value (USD).
Global Structured Cabling Market Trends and Insights
Accelerating Hyperscale and Edge Data Center Build-Outs
India's capacity is forecast to climb from roughly 1.8 GW in 2026 to up to 4.5 GW by 2030, with Mumbai alone approaching 2 GW of installed load. Edge facilities in Tier 2 and Tier 3 cities multiply project counts and require pre-terminated trunks to hit short deployment windows. Rack densities of 80-200 kW and AI traffic that bypass aggregation layers drive dense fiber counts, multi-fiber push-on connectors, and liquid-cooling-friendly cable trays. Hyperscalers now specify deterministic latency budgets and optical-loss margins that only ultra-low-loss fiber can meet. Compliance with India's Digital Personal Data Protection Act and incentives under the draft National Data Center Policy accelerate certified-system adoption.
Surge in PoE and Remote Powering Requirements
IEEE 802.3bt delivers up to 90 W over twisted pair, enabling a single cable to support data and power for access points, cameras, and sensors. Higher wattage raises conductor temperature, pushing installers toward larger-gauge copper or shorter run lengths to meet TIA and ISO/IEC thermal limits. Passive optical LAN with PoE-capable optical network units centralizes power and mitigates spark risk in hazardous industrial zones. ETSI's industrial PON spec also mandates extended temperature classes, adding cost but widening deployment scenarios. Smart-building plays increasingly treat PoE budgeting software as critical to reduce downtime and comply with facility energy codes.
Rising Adoption of Enterprise WLAN and 5G Fixed Wireless Access
Wi-Fi 7 delivers multi-gigabit speeds in the 6 GHz band, prompting offices to drop horizontal copper links at every desk. Private mid-band 5G covers warehouses and hospitals with roughly 15,000 ft2 per cell, easing mobility constraints. Integrated small-cell designs relax fronthaul latency, allowing reuse of existing LAN wiring, yet they increase PoE backhaul density. The trade-off slows copper volumes but lifts demand for high-capacity fiber uplinks and PoE budgeting software. Regional variance is strong: Europe's historic stone buildings retain wired runs, while U.S. tech campuses lean wireless-first.
Other drivers and restraints analyzed in the detailed report include:
- Increasing Retrofits for Smart Buildings and Campuses
- Adoption of 400 G / 800 G Active Optical Cables in AI Clusters
- Supply-Chain Volatility in Copper and Optical Fiber
For complete list of drivers and restraints, kindly check the Table Of Contents.
Segment Analysis
Hardware held 57.48% of structured cabling market share in 2025, driven by fiber trunks, connectors, and high-density racks. Services followed, as installers accelerate campus upgrades using pre-terminated assemblies. The structured cabling market size for software remains small but its 10.04% CAGR through 2031 outpaces all other offerings, reflecting growing demand for digital documentation and PoE budgeting tools. Hyperscalers integrate physical-layer telemetry into DCIM suites to trim mean-time-to-repair, while healthcare and finance entities value automated compliance reports.
Software's predictive-maintenance algorithms leverage machine-learning models to warn of micro-bends and connector contamination, protecting uptime in AI clusters. New license models bundle cloud dashboards with connector warranties, shifting revenue toward recurring subscriptions. Meanwhile, services revenue pivots from bulk installation toward retrofit consulting and moves-adds-changes managed services. Larger integrators cross-sell maintenance contracts alongside fiber trunks, deepening wallet share. Vendors that fail to unify hardware, services, and software risk margin squeeze as buyers seek single-pane-of-glass platforms.
Fiber captured 64.12% share in 2025 and is poised to expand at a 10.34% CAGR, reinforcing its status as backbone of the structured cabling market. Single-mode dominates long runs, while multi-mode holds short-reach links below 500 m. Active optical cables and linear optics compress cost per bit, further tilting spend toward fiber.
Copper retains relevance in cost-sensitive retrofits and in harsh industrial environments where shielded twisted-pair mitigates electromagnetic interference. Category 8 over 30 m remains cheaper than optics for some top-of-rack links, delaying full fiber displacement. Sustainability policies push both copper and fiber to adopt low-smoke zero-halogen jackets, marginally inflating material costs. Hybrid optical-electrical cables gain mindshare because they deliver fiber bandwidth plus PoE power in a single sheath, cutting pull time in smart-building retrofits.
Complete Report Scope:
- By Offering
- Hardware
- Cabling (Copper, Fiber)
- Connectivity (Connectors, Patch-Panels, Jacks, Cords)
- Racks, Cabinets and Cable Management
- Services
- Design and Consulting
- Installation and Integration
- Maintenance and Support
- Software
- Hardware
- By Cable Type
- Copper
- Copper Cable
- Copper Connectivity
- Fiber
- Single-Mode Cable
- Multi-Mode Cable
- Fiber Connectivity
- Copper
- By Cable Category Standard
- Cat 5e
- Cat 6
- Cat 6A
- Cat 7/7A
- Cat 8
- By Application
- LAN
- Data Center
- FTTx, Campus Backbone
- Industrial Automation Networks
- By End-User Industry
- IT and Telecom Service Providers
- Cloud and Colocation Data Centers
- BFSI and Enterprise Offices
- Healthcare Facilities
- Government and Defense
- Manufacturing and Industrial
- Education
- By Geography
- North America
- United States
- Canada
- Mexico
- South America
- Brazil
- Argentina
- Rest of South America
- Europe
- United Kingdom
- Germany
- France
- Italy
- Spain
- Nordics
- Russia
- Rest of Europe
- Asia Pacific
- China
- India
- Japan
- South Korea
- ASEAN
- Australia
- New Zealand
- Rest of Asia Pacific
- Middle East and Africa
- Middle East
- Saudi Arabia
- United Arab Emirates
- Turkey
- Rest of Middle East
- Africa
- South Africa
- Egypt
- Nigeria
- Rest of Africa
- Middle East
- North America
Geography Analysis
Asia Pacific accounted for 30.59% of structured cabling market share in 2025, energized by India's rapid data-center additions and China's AI parks. Tier-2 Indian cities such as Kochi and Visakhapatnam invite modular edge facilities that favor pre-connectorized trunks. Japanese industrial automation and South Korean electronics clusters sustain factory cabling uptick, while ASEAN fiber-to-the-home rollouts drive outdoor cable demand.
North America remains a mature yet dynamic pocket as hyperscalers cluster in Virginia, Oregon, and Texas. Smart-building retrofits add PoE-rich links in legacy offices, whereas colocation cages adopt Cat 8 for short reach. Federal sustainability targets encourage LSZH adoption in government properties, pushing specifiers toward certified suppliers.
Europe's growth stems from low-smoke zero-halogen mandates, energy-efficiency retrofits, and Industry 4.0 upgrades in Germany and France. Historic structures complicate new duct routes, making micro-cables and air-blown fiber attractive. The Middle East, though smaller in base, posts the highest 10.56% CAGR as Saudi Arabia's NEOM and UAE sovereign AI centers demand terabit fabrics and gigawatt power envelopes.
Latin America and Africa lag because of import dependency and economic volatility, yet Brazil's cloud build-outs and Nigeria's fintech boom create focused demand pockets. Political stability and low electricity pricing increasingly dictate hyperscaler site selection, redistributing new capacity away from legacy Western hubs toward Asia and the Middle East.
- CommScope Holding Company Inc.
- Corning Incorporated
- Belden Inc.
- Legrand SA
- Nexans SA
- Panduit Corp.
- Prysmian Group
- Schneider Electric SE
- The Siemon Company
- TE Connectivity Ltd.
- Furukawa Electric Co. Ltd.
- Hubbell Incorporated
- Rosenberger Hochfrequenztechnik GmbH & Co. KG
- Datwyler Cabling Solutions AG
- LS Cable & System Ltd.
- Reichle & De-Massari AG (R&M)
- Superior Essex Inc.
- Anixter International Inc. (WESCO International)
- AFL (AFL Global)
- Black Box Corporation
Additional Benefits:
- The market estimate (ME) sheet in Excel format
- 3 months of analyst support
TABLE OF CONTENTS
1 INTRODUCTION
- 1.1 Study Assumptions and Market Definition
- 1.2 Scope of the Study
2 RESEARCH METHODOLOGY
3 EXECUTIVE SUMMARY
4 MARKET LANDSCAPE
- 4.1 Market Overview
- 4.2 Market Drivers
- 4.2.1 Accelerating Hyperscale and Edge Data Center Build-Outs
- 4.2.2 Surge in PoE and Remote Powering Requirements
- 4.2.3 Increasing Retrofits for Smart Buildings and Campuses
- 4.2.4 Adoption of 400G/800G Active Optical Cables in AI Clusters
- 4.2.5 Sustainability Mandates Driving Low-Smoke Zero-Halogen Cabling
- 4.2.6 Converged OT/IT Cabling for Industry 4.0 Time-Sensitive Networking
- 4.3 Market Restraints
- 4.3.1 Rising Adoption of Enterprise WLAN and 5G Fixed Wireless Access
- 4.3.2 Supply-Chain Volatility in Copper and Optical Fiber
- 4.3.3 Emerging Silicon Photonics Eliminating High-Speed Copper Runs
- 4.3.4 Increasing Use of Modular Plug-Terminated Links Reducing Patch-Panel Demand
- 4.4 Industry Value Chain Analysis
- 4.5 Regulatory Landscape
- 4.6 Technological Outlook
- 4.7 Porter's Five Forces Analysis
- 4.7.1 Bargaining Power of Suppliers
- 4.7.2 Bargaining Power of Buyers
- 4.7.3 Threat of New Entrants
- 4.7.4 Threat of Substitutes
- 4.7.5 Competitive Rivalry
- 4.8 Impact of Macroeconomic Factors on the Market
- 4.9 Key Use Cases and Case Studies
- 4.10 Investment Analysis
5 MARKET SIZE AND GROWTH FORECASTS (VALUE)
- 5.1 By Offering
- 5.1.1 Hardware
- 5.1.1.1 Cabling (Copper, Fiber)
- 5.1.1.2 Connectivity (Connectors, Patch-Panels, Jacks, Cords)
- 5.1.1.3 Racks, Cabinets and Cable Management
- 5.1.2 Services
- 5.1.2.1 Design and Consulting
- 5.1.2.2 Installation and Integration
- 5.1.2.3 Maintenance and Support
- 5.1.3 Software
- 5.1.1 Hardware
- 5.2 By Cable Type
- 5.2.1 Copper
- 5.2.1.1 Copper Cable
- 5.2.1.2 Copper Connectivity
- 5.2.2 Fiber
- 5.2.2.1 Single-Mode Cable
- 5.2.2.2 Multi-Mode Cable
- 5.2.2.3 Fiber Connectivity
- 5.2.1 Copper
- 5.3 By Cable Category Standard
- 5.3.1 Cat 5e
- 5.3.2 Cat 6
- 5.3.3 Cat 6A
- 5.3.4 Cat 7/7A
- 5.3.5 Cat 8
- 5.4 By Application
- 5.4.1 LAN
- 5.4.2 Data Center
- 5.4.3 FTTx, Campus Backbone
- 5.4.4 Industrial Automation Networks
- 5.5 By End-User Industry
- 5.5.1 IT and Telecom Service Providers
- 5.5.2 Cloud and Colocation Data Centers
- 5.5.3 BFSI and Enterprise Offices
- 5.5.4 Healthcare Facilities
- 5.5.5 Government and Defense
- 5.5.6 Manufacturing and Industrial
- 5.5.7 Education
- 5.6 By Geography
- 5.6.1 North America
- 5.6.1.1 United States
- 5.6.1.2 Canada
- 5.6.1.3 Mexico
- 5.6.2 South America
- 5.6.2.1 Brazil
- 5.6.2.2 Argentina
- 5.6.2.3 Rest of South America
- 5.6.3 Europe
- 5.6.3.1 United Kingdom
- 5.6.3.2 Germany
- 5.6.3.3 France
- 5.6.3.4 Italy
- 5.6.3.5 Spain
- 5.6.3.6 Nordics
- 5.6.3.7 Russia
- 5.6.3.8 Rest of Europe
- 5.6.4 Asia Pacific
- 5.6.4.1 China
- 5.6.4.2 India
- 5.6.4.3 Japan
- 5.6.4.4 South Korea
- 5.6.4.5 ASEAN
- 5.6.4.6 Australia
- 5.6.4.7 New Zealand
- 5.6.4.8 Rest of Asia Pacific
- 5.6.5 Middle East and Africa
- 5.6.5.1 Middle East
- 5.6.5.1.1 Saudi Arabia
- 5.6.5.1.2 United Arab Emirates
- 5.6.5.1.3 Turkey
- 5.6.5.1.4 Rest of Middle East
- 5.6.5.2 Africa
- 5.6.5.2.1 South Africa
- 5.6.5.2.2 Egypt
- 5.6.5.2.3 Nigeria
- 5.6.5.2.4 Rest of Africa
- 5.6.5.1 Middle East
- 5.6.1 North America
6 COMPETITIVE LANDSCAPE
- 6.1 Market Concentration
- 6.2 Strategic Moves
- 6.3 Market Share Analysis
- 6.4 Company Profiles (includes Global Level Overview, Market Level Overview, Core Segments, Financials as Available, Strategic Information, Market Rank/Share for Key Companies, Products and Services, and Recent Developments)
- 6.4.1 CommScope Holding Company Inc.
- 6.4.2 Corning Incorporated
- 6.4.3 Belden Inc.
- 6.4.4 Legrand SA
- 6.4.5 Nexans SA
- 6.4.6 Panduit Corp.
- 6.4.7 Prysmian Group
- 6.4.8 Schneider Electric SE
- 6.4.9 The Siemon Company
- 6.4.10 TE Connectivity Ltd.
- 6.4.11 Furukawa Electric Co. Ltd.
- 6.4.12 Hubbell Incorporated
- 6.4.13 Rosenberger Hochfrequenztechnik GmbH & Co. KG
- 6.4.14 Datwyler Cabling Solutions AG
- 6.4.15 LS Cable & System Ltd.
- 6.4.16 Reichle & De-Massari AG (R&M)
- 6.4.17 Superior Essex Inc.
- 6.4.18 Anixter International Inc. (WESCO International)
- 6.4.19 AFL (AFL Global)
- 6.4.20 Black Box Corporation
7 MARKET OPPORTUNITIES AND FUTURE OUTLOOK
- 7.1 White-Space and Unmet-Need Assessment

 亞太地區結構化佈線:市場佔有率分析、產業趨勢與統計、成長預測(2026-2031)北美結構化佈線:市場佔有率分析、產業趨勢與統計及成長預測(2026-2031 年)歐洲結構化佈線:市場佔有率分析、產業趨勢與統計及成長預測(2026-2031 年)
 結構化佈線市場-2026-2032年全球市場預測
 結構化佈線市場規模、佔有率、成長及全球產業分析:按類型、應用和地區分類的洞察,2026-2034 年預測
 2026年全球結構化佈線市場報告建築整合佈線解決方案市場:按電纜類型、系統元件、安裝類型、應用和最終用戶分類 - 全球預測 2026-2032 年
 結構化佈線市場分析及預測(至2035年):按類型、產品、服務、技術、組件、應用、部署模式、最終用戶和安裝類型分類全球結構化佈線市場規模、佔有率、趨勢和成長分析報告(2026-2034年)
 結構化佈線市場 - 全球產業規模、佔有率、趨勢、機會及預測(按產品類型、應用、線材類別、最終用戶產業、地區和競爭格局分類,2021-2031)