


 |
市場調查報告書
商品編碼
2117251
亞太地區結構化佈線:市場佔有率分析、產業趨勢與統計、成長預測(2026-2031)Asia-Pacific Structured Cabling - Market Share Analysis, Industry Trends & Statistics, Growth Forecasts (2026 - 2031) |
||||||

※ 本網頁內容可能與最新版本有所差異。詳細情況請與我們聯繫。
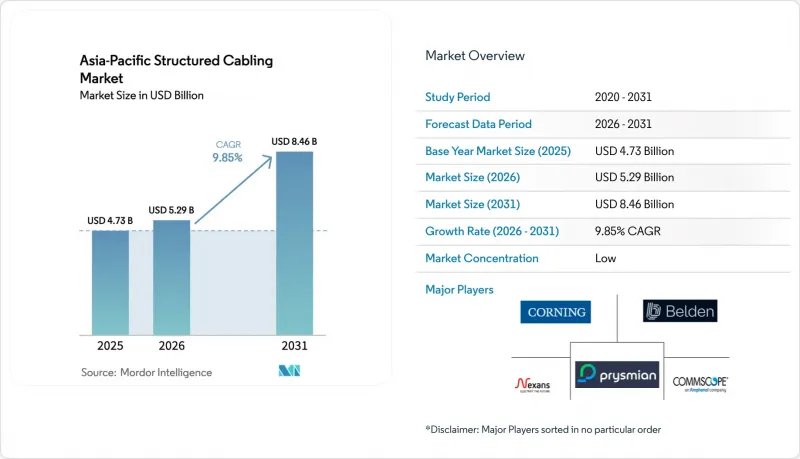
根據 Mordor Intelligence 預測,亞太地區結構化電纜市場規模將從 2025 年的 47.3 億美元成長到 2026 年的 52.9 億美元,然後在 2031 年達到 84.6 億美元,2026 年至 2031 年的複合年成長率為 9.85%。
本報告按產品類型(硬體、服務、軟體)、線纜類型(銅纜、光纖)、線纜類別標準(Cat 5e、Cat 6)、應用領域(區域網路、資料中心、FTTx/園區骨幹網路、工業自動化網路)、終端用戶產業(IT和電信、雲端和託管資料中心、銀行、金融服務和保險等地區進行細分。市場預測以美元計價。
亞太地區結構化佈線市場趨勢及洞察
超大規模和邊緣資料中心的建設正在加速。
超大規模資料中心供應商已在東南亞、印度和澳洲投資超過500億美元。 AWS、Google、微軟、阿里雲和甲骨文等公司均運作千兆瓦級的資料中心園區,分別採用MPO主幹網路和144芯或288芯的Cat 6機架頂部鏈路。海德拉巴、成都和胡志明市等二線城市的建設熱潮正在降低串流媒體和遊戲應用的延遲,並擴大供應商的企業發展。對於5兆瓦以下的邊緣設施,預端接解決方案可將安裝時間縮短高達40%,因此整合商更傾向於選擇工廠組裝的盒式模組而非現場端接。預計到2025年,新加坡和雪梨的人事費用將上漲3.8%,承包商正在積極尋求能夠在不犧牲性能的前提下減少現場施工時間的設計方案。提供線纜、機架和線纜管理一體化解決方案的組件供應商正在透過降低超大規模租戶的專案風險來贏得市場佔有率,這些租戶要求保證按時完工。
政府主導的FTTH(光纖到府)舉措
印度的BharatNet計畫預算為2,200億印度盧比(約26億美元),計畫在2025年12月前鋪設692,676公里光纖電纜,連接214,323個鄉村自治機構(Gham Panchayat)網路。泰國、印尼和越南也正在採取類似的規劃,將普及服務基金與國內採購法規結合,鼓勵與能夠在易受颶風侵襲地區按時完成交付的當地製造商簽訂合約。這些政策正在提振對單模光纖的需求,推動熔接機的銷售,並迫使當地電信業者實施能夠抵禦季風洪水的堅固的封堵措施。隨著各國政府的寬頻計畫延伸至2030年後,結構化佈線供應商正在確保未來十年的收入前景,並對沖資料中心投資的周期性波動。這些措施也促進了官民合作關係,將暗纖租賃與智慧城市應用案例結合,加速了農村城市園區骨幹網路的升級改造。
擴大企業無線區域網路和5G固定無線存取解決方案的部署
Wi-Fi聯盟已認證超過2500款Wi-Fi 6E設備,現場測試顯示其平均吞吐量超過1.7 Gbps。這負責人許多辦公空間設計師採用「無線優先」策略,從而減少對新增水平佈線的需求。印度、印尼和菲律賓的營運商目前正在銷售100-300 Mbps的5G固定無線套餐,光是Reliance Jio就計劃在2025年投入運作11.5萬個FWA終端。這將使用戶能夠在成本敏感地區繞過最後一公里銅纜和光纖線路。思科基準測試顯示,Wi-Fi 6E網路基地台的功耗約為28瓦,需要一個90瓦的PoE交換器端口,但每層樓的佈線數量仍然很少,這限制了中小型辦公室對Cat 6電纜的需求。根據系統整合商報告,在維修專案中,分配給銅纜終端的佈線預算比例已從2022年的45%下降到目前的25%,這部分預算被重新分配給了匯聚鏈路和網路服務。雖然資料中心和超大規模環境由於依賴光纖主幹網實現高密度機架而受到的影響較小,但辦公室採用率的下降對澳大利亞、泰國和印度等都市區的結構化佈線供應商來說是一個主要的阻力。
細分市場分析
預計2025年,亞太地區結構化佈線硬體市場規模將達33.4億美元,佔總支出的63.12%。這主要歸因於新建設(待開發區)預算中銅纜對、光纖主幹、模組化面板和佈線管理系統的主導地位。同時,設計和安裝服務正以10.22%的複合年成長率成長。這是因為企業需要升級傳統佈線以支援90瓦PoE供電、10GBASE-T吞吐量和Wi-Fi 6E回程傳輸。服務的快速成長使BICSI Installer 2認證的承包商受益,他們的資格正在縮短超大規模租戶的採購週期。供應商正在將測量圖紙和熱模擬納入維護契約,合約期限現已延長至七年。這反映了印尼和印度機架密度的增加以及熟練技術人員的短缺。
儘管軟體銷售額在總銷售額中所佔比例仍然很小,但隨著超大規模企業實現線纜庫存自動化並力求將平均維修時間 (MTTR) 縮短高達 40%,其重要性日益凸顯。一些平台能夠直接整合來自 Fluke 和 Viavi 認證設備的測試結果,從而在幾分鐘內產生符合 ISO 標準的交接包,減輕管理負擔。混合式施工和營運合約正在興起,確保即使在安裝完成後也能持續獲得收入,整合商將負責五年內的運轉率時間。在亞太結構化佈線市場,增值轉售商透過將數位孿生功能疊加到佈線圖上,看到了商機,從而能夠基於 PoE 交換機連接埠和光纖通道的使用情況實現預測性維護。
預計到2025年,光纖將佔市場總值的56.41%,年複合成長率(CAGR)為10.97%。這主要得益於人工智慧叢集集中脊葉式架構對400G+光學模組和單模主幹網路的需求,這些模組和主幹網路能夠維持超過300公尺的連結預算。雖然OM4和OM5多模光纖仍然用於伺服器叢集內的短距離鏈路,但超大規模資料中心業者正擴大轉向單模光纖以實現備件標準化。銅纜在水平佈線和工業廠房中仍然發揮著至關重要的作用,其中Cat 6屏蔽電纜具有良好的抗電磁干擾性能。由於智利、秘魯和剛果民主共和國的銅礦開採集中,銅價上漲且波動較大,因此鋁包銅纜對於預算有限的區域網路來說是一個頗具吸引力的選擇。
連接器技術也隨之不斷發展。雖然LC雙工連接器在資料中心配線中仍佔據主導地位,但16芯MPO和新興的SN介面正在減少800G交換器的連接埠數量,從而提高交換器的密度。預端接組件可將安裝工作量減少25%至35%,鑑於東南亞地區持續存在的勞動力短缺問題,這無疑是一項關鍵優勢。由於光纖原料價格波動性低於銅纜,具有長期規劃的電信業者往往傾向於選擇單模光纖來規避成本風險,這進一步鞏固了光纖連接在亞太地區結構化佈線市場的佔有率優勢。
其他好處:
- Excel格式的市場預測(ME)表
- 3個月的分析師支持
目錄
第1章:引言
- 研究假設和市場定義
- 調查範圍
第2章:調查方法
第3章執行摘要
第4章 市場狀況
- 市場概覽
- 市場促進因素
- 超大規模和邊緣資料中心的建設正在加速。
- 對 PoE 和遠端供電的需求激增
- 智慧建築及園區維修工程增加
- 政府光纖到府(FTTH)計劃
- 對人工智慧/機器學習集群互連低延遲的需求
- 工業4.0工廠中OT/IT佈線的整合
- 市場限制因素
- 擴大企業 WLAN/5G FWA 解決方案的部署
- 與遵守複雜標準和測試相關的成本。
- 銅和光纖供應鏈的波動
- 由於遷移到雲端託管,資本投資被推遲。
- 產業價值鏈分析
- 監理情勢
- 技術展望
- 波特五力分析
- 對關鍵相關人員的影響評估
- 主要用例和案例研究
- 宏觀經濟因素對市場的影響
- 投資分析
第5章 市場規模與成長預測
- 報價
- 硬體
- 電纜(銅線、光纖電纜)
- 連接設備(連接器、配線架、插座、電纜)
- 機架、機櫃和線管理
- 服務
- 設計與諮詢
- 安裝與整合
- 維護和支援
- 軟體
- 硬體
- 按電纜類型
- 銅
- 銅纜
- 銅連接器
- 光纖
- 單模電纜
- 多模電纜
- 光纖連接
- 銅
- 電纜分類標準
- Cat 5e
- Cat 6
- 透過使用
- LAN
- 資料中心
- FTTx/校園主幹網
- 工業自動化網路
- 按最終用戶行業分類
- IT和電信服務供應商
- 雲端和託管資料中心
- 銀行、金融服務和保險 (BFSI) 以及公司辦公室
- 醫療機構
- 政府/國防
- 製造業和工業
- 教育
- 按地區
- 亞太地區
- 中國
- 印度
- 日本
- 韓國
- ASEAN
- 澳洲
- 紐西蘭
- 其他亞太國家
- 亞太地區
第6章 競爭情勢
- 市場集中度
- 策略趨勢
- 市佔率分析
- 公司簡介
- CommScope Holding Company Inc.
- Corning Incorporated
- Nexans SA
- Prysmian Group SpA
- Belden Inc.
- Legrand SA
- Schneider Electric SE
- Panduit Corp.
- TE Connectivity Ltd.
- Furukawa Electric Co. Ltd.
- Superior Essex Inc.
- The Siemon Company
- Datwyler IT Infra AG
- Reichle & De-Massari AG
- LS Cable & System Ltd.
- Sumitomo Electric Industries Ltd.
- ABB Ltd.
- Rosenberger Hochfrequenztechnik GmbH & Co. KG
- Molex LLC(Koch Industries Inc.)
- General Cable Corporation
第7章 市場機會與未來展望
According to Mordor Intelligence, the Asia-Pacific structured cabling market size is expected to grow from USD 4.73 billion in 2025 to USD 5.29 billion in 2026 and is forecast to reach USD 8.46 billion by 2031 at 9.85% CAGR over 2026-2031.
This report is Segmented by Offering (Hardware, Services, and Software), Cable Type (Copper, and Fiber), Cable Category Standard (Cat 5e, and Cat 6), Application (LAN, Data Center, FTTx/Campus Backbone, and Industrial Automation Networks), End-User Industry (IT and Telecom, Cloud and Colocation Data Centers, BFSI, and More), and Geography. Market Forecasts are Provided in Terms of Value (USD).
Asia-Pacific Structured Cabling Market Trends and Insights
Accelerating Hyperscale And Edge Data-Center Build-Outs
Investments from hyperscale providers exceed USD 50 billion across Southeast Asia, India, and Australia, with AWS, Google, Microsoft, Alibaba Cloud, and Oracle each commissioning multigigawatt campuses that rely on 144- or 288-fiber MPO trunks and Cat 6 top-of-rack links. Rising construction in secondary cities such as Hyderabad, Chengdu, and Ho Chi Minh City shortens latency for streaming and gaming applications and enlarges the addressable footprint for vendors. Edge facilities under 5 MW use pre-terminated solutions to cut installation time by up to 40%, leading integrators to favor factory-assembled cassettes over field terminations. Because labor costs in Singapore and Sydney rose 3.8% in 2025, contractors actively seek designs that trim onsite hours without sacrificing performance. Component suppliers that bundle cabling, racks, and cable management gain share by mitigating project risk for hyperscale tenants that demand reliable completion schedules.
Government Fiber-To-The-Home Initiatives
India's BharatNet installed 692,676 km of optical fiber and connected 214,323 gram panchayats by December 2025 under a INR 220 billion (USD 2.6 billion) allocation. Thailand, Indonesia, and Vietnam follow similar blueprints that pair universal service funds with domestic-content rules, steering contracts toward local manufacturers that meet delivery windows in cyclone-prone regions. These mandates elevate single-mode fiber demand, spur fusion splicer sales, and push rural operators to adopt hardened closures that withstand monsoon flooding. Because sovereign broadband plans stretch to 2030 and beyond, structured cabling vendors lock in decade-long revenue visibility and hedge against cyclical data-center spending. The initiatives also foster public-private partnerships that bundle dark-fiber leases with smart-city use cases, accelerating campus backbone upgrades in provincial towns.
Rising Adoption Of Enterprise WLAN And 5G FWA Solutions
Wi-Fi Alliance has certified more than 2,500 Wi-Fi 6E devices, and field trials show average throughputs above 1.7 Gbps, prompting many office planners to adopt a wireless-first strategy that trims the need for new horizontal cable drops. Telcos in India, Indonesia, and the Philippines now market 100-300 Mbps 5G fixed wireless packages, with Reliance Jio alone activating 115,000 FWA terminals during 2025, thereby bypassing last-mile copper or fiber in cost-sensitive locations. Cisco benchmarks indicate that Wi-Fi 6E access points draw roughly 28 watts, requiring 90-watt PoE switch ports but still fewer cable runs per floor, which compresses demand for Cat 6 in small and midsize offices. Systems integrators report that renovation projects now devote only 25% of cabling budgets to copper endpoints compared with 45% in 2022, redirecting spend toward aggregation links and network services. While data-center and hyperscale environments remain insulated because high-density racks depend on fiber trunks, reduced office installations constitute a meaningful headwind for structured-cabling vendors in Australia, Thailand, and urban India.
Other drivers and restraints analyzed in the detailed report include:
- Surge In PoE And Remote Powering Requirements
- Low-Latency Demand For AI And ML Cluster Interconnects
- Supply-Chain Volatility In Copper And Optical Fiber
For complete list of drivers and restraints, kindly check the Table Of Contents.
Segment Analysis
The Asia-Pacific structured cabling market size for hardware reached USD 3.34 billion in 2025, equal to 63.12% of total spend, thanks to copper pairs, fiber trunks, modular panels, and cable management systems that dominate greenfield budgets. Design and installation services, however, are growing at a 10.22% CAGR because enterprises must upgrade legacy cabling to support 90-watt PoE, 10GBASE-T throughput, and Wi-Fi 6E backhaul. This service boom benefits contractors certified under BICSI Installer 2, whose credentials shorten procurement cycles for hyperscale tenants. Vendors bundle as-built documentation and thermal simulation into maintenance contracts that now stretch seven years, reflecting higher rack densities and the scarcity of skilled technicians in Indonesia and India.
Software remains a sliver of revenue but is ascending as hyperscalers automate cable inventories to lower mean-time-to-repair by up to 40%. Platforms that ingest test results directly from Fluke or Viavi certifiers produce ISO-compliant handover packs in minutes, trimming administrative labor. Hybrid build-operate agreements are emerging, where integrators assume responsibility for uptime over a five-year horizon, thus embedding recurring revenue during the post-installation phase. The Asia-Pacific structured cabling market creates room for value-added resellers that overlay digital twin capabilities onto cabling blueprints, enabling predictive maintenance on PoE switch ports and fiber-channel utilization.
Fiber captured 56.41% of 2025 value and is expanding at a 10.97% CAGR because spine-leaf architectures inside AI clusters demand 400G-plus optics and single-mode trunks that sustain link budgets beyond 300 meters. OM4 and OM5 multimode still serve short-reach links inside server rows, yet hyperscalers increasingly leapfrog to single-mode to standardize spares. Copper retains relevance in horizontal runs and industrial plants where Cat 6 shielded cable tolerates electromagnetic interference. Rising copper prices and mining concentration in Chile, Peru, and the Democratic Republic of the Congo amplify price swings, making aluminum-clad copper attractive for budget-constrained LANs.
Connector technology evolves in tandem: LC duplex still dominates data-center patching, but 16-fiber MPO and emerging SN interfaces shrink port counts on 800G switches, driving density gains. Pre-terminated assemblies reduce installer labor by 25-35%, a key selling point amid chronic talent shortages in Southeast Asia. Because fiber boasts lower raw-material volatility than copper, telcos with long planning horizons prefer single-mode to hedge cost risk, reinforcing the Asia-Pacific structured cabling market share advantage for optical connectivity.
Complete Report Scope:
- By Offering
- Hardware
- Cabling (Copper, Fiber)
- Connectivity (Connectors, Patch-Panels, Jacks, Cords)
- Racks, Cabinets and Cable Management
- Services
- Design and Consulting
- Installation and Integration
- Maintenance and Support
- Software
- Hardware
- By Cable Type
- Copper
- Copper Cable
- Copper Connectivity
- Fiber
- Single-Mode Cable
- Multi-Mode Cable
- Fiber Connectivity
- Copper
- By Cable Category Standard
- Cat 5e
- Cat 6
- By Application
- LAN
- Data Center
- FTTx / Campus Backbone
- Industrial Automation Networks
- By End-User Industry
- IT and Telecom Service Providers
- Cloud and Colocation Data Centers
- BFSI and Enterprise Offices
- Healthcare Facilities
- Government and Defense
- Manufacturing and Industrial
- Education
- By Geography
- Asia-Pacific
- China
- India
- Japan
- South Korea
- ASEAN
- Australia
- New Zealand
- Rest of Asia-Pacific
- Asia-Pacific
List of Companies Covered in this Report:
- CommScope Holding Company Inc.
- Corning Incorporated
- Nexans SA
- Prysmian Group SpA
- Belden Inc.
- Legrand SA
- Schneider Electric SE
- Panduit Corp.
- TE Connectivity Ltd.
- Furukawa Electric Co. Ltd.
- Superior Essex Inc.
- The Siemon Company
- Datwyler IT Infra AG
- Reichle & De-Massari AG
- LS Cable & System Ltd.
- Sumitomo Electric Industries Ltd.
- ABB Ltd.
- Rosenberger Hochfrequenztechnik GmbH & Co. KG
- Molex LLC (Koch Industries Inc.)
- General Cable Corporation
Additional Benefits:
- The market estimate (ME) sheet in Excel format
- 3 months of analyst support
TABLE OF CONTENTS
1 INTRODUCTION
- 1.1 Study Assumptions and Market Definition
- 1.2 Scope of the Study
2 RESEARCH METHODOLOGY
3 EXECUTIVE SUMMARY
4 MARKET LANDSCAPE
- 4.1 Market Overview
- 4.2 Market Drivers
- 4.2.1 Accelerating Hyperscale and Edge Data-Center Build-Outs
- 4.2.2 Surge in PoE and Remote Powering Requirements
- 4.2.3 Increasing Retrofits for Smart Buildings and Campuses
- 4.2.4 Government Fiber-to-the-Home (FTTH) Initiatives
- 4.2.5 Low-Latency Demand for AI/ML Cluster Interconnects
- 4.2.6 Convergence of OT/IT Cabling in Industry 4.0 Factories
- 4.3 Market Restraints
- 4.3.1 Rising Adoption of Enterprise WLAN/5G FWA Solutions
- 4.3.2 Complex Standards Compliance and Testing Costs
- 4.3.3 Supply-Chain Volatility in Copper and Optical Fiber
- 4.3.4 Cap-Ex Deferrals Due to Cloud Colocation Shift
- 4.4 Industry Value-Chain Analysis
- 4.5 Regulatory Landscape
- 4.6 Technological Outlook
- 4.7 Porter's Five Forces Analysis
- 4.7.1 Bargaining Power of Suppliers
- 4.7.2 Bargaining Power of Buyers
- 4.7.3 Threat of New Entrants
- 4.7.4 Threat of Substitutes
- 4.7.5 Competitive Rivalry
- 4.8 Impact Assessment of Key Stakeholders
- 4.9 Key Use Cases and Case Studies
- 4.10 Impact of Macroeconomic Factors on the Market
- 4.11 Investment Analysis
5 MARKET SIZE AND GROWTH FORECASTS
- 5.1 By Offering
- 5.1.1 Hardware
- 5.1.1.1 Cabling (Copper, Fiber)
- 5.1.1.2 Connectivity (Connectors, Patch-Panels, Jacks, Cords)
- 5.1.1.3 Racks, Cabinets and Cable Management
- 5.1.2 Services
- 5.1.2.1 Design and Consulting
- 5.1.2.2 Installation and Integration
- 5.1.2.3 Maintenance and Support
- 5.1.3 Software
- 5.1.1 Hardware
- 5.2 By Cable Type
- 5.2.1 Copper
- 5.2.1.1 Copper Cable
- 5.2.1.2 Copper Connectivity
- 5.2.2 Fiber
- 5.2.2.1 Single-Mode Cable
- 5.2.2.2 Multi-Mode Cable
- 5.2.2.3 Fiber Connectivity
- 5.2.1 Copper
- 5.3 By Cable Category Standard
- 5.3.1 Cat 5e
- 5.3.2 Cat 6
- 5.4 By Application
- 5.4.1 LAN
- 5.4.2 Data Center
- 5.4.3 FTTx / Campus Backbone
- 5.4.4 Industrial Automation Networks
- 5.5 By End-User Industry
- 5.5.1 IT and Telecom Service Providers
- 5.5.2 Cloud and Colocation Data Centers
- 5.5.3 BFSI and Enterprise Offices
- 5.5.4 Healthcare Facilities
- 5.5.5 Government and Defense
- 5.5.6 Manufacturing and Industrial
- 5.5.7 Education
- 5.6 By Geography
- 5.6.1 Asia-Pacific
- 5.6.1.1 China
- 5.6.1.2 India
- 5.6.1.3 Japan
- 5.6.1.4 South Korea
- 5.6.1.5 ASEAN
- 5.6.1.6 Australia
- 5.6.1.7 New Zealand
- 5.6.1.8 Rest of Asia-Pacific
- 5.6.1 Asia-Pacific
6 COMPETITIVE LANDSCAPE
- 6.1 Market Concentration
- 6.2 Strategic Moves
- 6.3 Market Share Analysis
- 6.4 Company Profiles (includes Global Level Overview, Market Level Overview, Core Segments, Financials As Available, Strategic Information, Market Rank/Share For Key Companies, Products and Services, and Recent Developments)
- 6.4.1 CommScope Holding Company Inc.
- 6.4.2 Corning Incorporated
- 6.4.3 Nexans SA
- 6.4.4 Prysmian Group SpA
- 6.4.5 Belden Inc.
- 6.4.6 Legrand SA
- 6.4.7 Schneider Electric SE
- 6.4.8 Panduit Corp.
- 6.4.9 TE Connectivity Ltd.
- 6.4.10 Furukawa Electric Co. Ltd.
- 6.4.11 Superior Essex Inc.
- 6.4.12 The Siemon Company
- 6.4.13 Datwyler IT Infra AG
- 6.4.14 Reichle & De-Massari AG
- 6.4.15 LS Cable & System Ltd.
- 6.4.16 Sumitomo Electric Industries Ltd.
- 6.4.17 ABB Ltd.
- 6.4.18 Rosenberger Hochfrequenztechnik GmbH & Co. KG
- 6.4.19 Molex LLC (Koch Industries Inc.)
- 6.4.20 General Cable Corporation
7 MARKET OPPORTUNITIES AND FUTURE OUTLOOK
- 7.1 White-Space and Unmet-Need Assessment

 北美結構化佈線:市場佔有率分析、產業趨勢與統計及成長預測(2026-2031 年)歐洲結構化佈線:市場佔有率分析、產業趨勢與統計及成長預測(2026-2031 年)結構化佈線:市場佔有率分析、行業趨勢和統計數據、成長預測(2026-2031 年)
 結構化佈線市場-2026-2032年全球市場預測
 結構化佈線市場規模、佔有率、成長及全球產業分析:按類型、應用和地區分類的洞察,2026-2034 年預測
 2026年全球結構化佈線市場報告建築整合佈線解決方案市場:按電纜類型、系統元件、安裝類型、應用和最終用戶分類 - 全球預測 2026-2032 年
 結構化佈線市場分析及預測(至2035年):按類型、產品、服務、技術、組件、應用、部署模式、最終用戶和安裝類型分類全球結構化佈線市場規模、佔有率、趨勢和成長分析報告(2026-2034年)
 結構化佈線市場 - 全球產業規模、佔有率、趨勢、機會及預測(按產品類型、應用、線材類別、最終用戶產業、地區和競爭格局分類,2021-2031)