


 |
市場調查報告書
商品編碼
2119780
非洲資料中心網路:市場佔有率分析、產業趨勢與統計及成長預測(2026-2031 年)Africa Data Center Networking - Market Share Analysis, Industry Trends & Statistics, Growth Forecasts (2026 - 2031) |
||||||

※ 本網頁內容可能與最新版本有所差異。詳細情況請與我們聯繫。
根據 Mordor Intelligence 預測,非洲資料中心網路市場規模預計將從 2025 年的 21 億美元成長到 2026 年的 23.8 億美元,然後從 2026 年到 2031 年以 13.18% 的複合年成長率成長,到 2031 年達到 44.1 億美元。
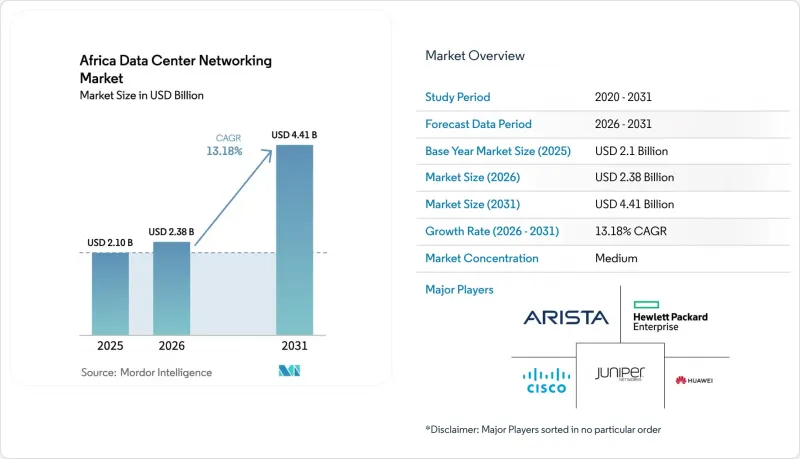
本報告按組件(按產品、按服務)、最終用戶(IT和電信、銀行、金融服務和保險、其他最終用戶)、資料中心類型(託管、超大規模資料中心業者/雲端服務供應商等)和頻寬(10 GbE或以下、25-40 GbE等)對產業進行細分。市場預測以美元計價。
非洲資料中心網路市場趨勢與洞察
超大規模和雲端運算採用率的快速成長
隨著微軟、谷歌和亞馬遜網路服務 (AWS) 向其全球各地的雲端區域投入新的資金,超大規模資料中心業者中心正在重塑非洲的資料中心網路市場。微軟在南非投資 2.98 億美元,在其核心建立了一個支援人工智慧的架構,該架構採用 25 GbE 葉層和 100 GbE 脊層,以支援大規模語言模型的訓練。谷歌的約翰內斯堡雲端區域自 2024 年初運作以來,與阿姆斯特丹的線路相比,延遲降低了 80 毫秒,從而推動了當地 SaaS 公司的工作負載遷移。每個新的雲端可用區開放都促使各方同時投資建造營運商中立的連網機房、暗纖線路以及連接到新園區的 400G 開放式橋接光纖上行鏈路。在塞內加爾,AWS 與 Sonatel 合作,為金融科技工作負載提供低於 5 毫秒的服務,這凸顯了主權雲端區域如何在交換、路由和互連方面的投資中創造協同效應。
擴大網路攻擊面並加強合規要求
更嚴格的隱私法規正推動企業加大對安全交換架構和微隔離葉層的資本投入。南非的《個人資料保護法》(POPIA) 強制要求企業部署新一代防火牆、零信任疊加網路以及能夠匯出流量資料以進行稽核追蹤的遙測路由器。奈及利亞和南非的銀行率先採用者了安全 SD-WAN,非洲銀行部署的 Fortinet 系統就是一個典型的例子。這使他們在滿足 PCI DSS 法規要求的同時,將廣域網路成本降低了一半。合規性要求不僅限於金融領域,還擴展到醫療保健和公共部門雲端平台,在這些領域,維護加密的東西向路由和證明確定性資料居住應用程式至關重要。因此,市場需求正轉向基於意圖的架構,這些架構整合了加密引擎和人工智慧驅動的異常檢測功能,將平均檢測時間 (MTD) 從數小時縮短到數分鐘。
多重雲端架構中網路複雜性的日益增加
採用多重雲端策略的非洲企業面臨效能不一致、工具繁雜和營運成本上升等挑戰。南非一家零售銀行需要五個不同的控制平面來保障兩個本地雲端和一個歐洲區域的流量安全,導致配置不符和變更視窗延長。由於內部專業知識有限,該機構被迫遷移到託管疊加網路,雖然彌補了技能缺口,但也增加了營運成本。這種情況延緩了軟體定義架構的採用,並阻礙了對延遲敏感的應用(例如數位交易平台)的遷移。
細分市場分析
2025年,我們的產品在非洲資料中心網路市場維持了67.45%的市場佔有率。這是因為每個資料中心仍需要實體交換器、路由器和光纖傳輸設備等基礎設備。乙太網路切換器仍然是最大的收入來源,因為葉脊式架構需要高階口密度的TOR單元和低延遲的脊模組。連接園區核心、網際網路閘道和城域節點到海底登陸站的資料中心互連中,路由需求預計將持續旺盛。隨著零信任和SSL卸載技術的日益普及,對安全設備和應用傳遞控制器(ADC)的需求也日益成長。
隨著參與企業尋求彌補營運技能缺口,服務業正以驚人的速度擴張,預計到2031年將以14.08%的複合年成長率成長。對於力求快速上市的新興超大規模資料中心業者而言,實施和整合專案是首選。託管網路服務提供持續的營運支持,幫助本地IT團隊專注於應用程式的利用。隨著大型跨國公司致力於建立區域卓越中心,最終實現內部葉脊式網路營運管理,培訓和諮詢業務也蓬勃發展。同樣,隨著金融和醫療保健等對服務等級協定(SLA)要求極高的產業需要「四個九」(99.99%)的正常運轉率,支援和維護收入也在不斷成長。
IT 和電信業者正在部署高密度網路架構,用於託管客戶虛擬機器、OTT 快取和 5G 核心功能,預計到 2025 年,這些架構將佔據非洲資料中心網路市場 32.65% 的佔有率。電信業者正在將其邊緣聚合站點從 10 GbE 升級到 25 GbE,以應對超高可靠性和低延遲的流量需求,同時也投資於分段路由以控制城際路由。雲端原生 ISP 正在採用運行 SONiC 的白盒設備,與品牌產品相比,這可以幫助他們降低 40% 的資本支出,並在全球供應緊張的情況下縮短前置作業時間。
政府和國防工作負載成長最快,複合年成長率 (CAGR) 達 14.72%。國家雲端、電子健康儲存庫和智慧城市遙測需要冗餘可用區之間加密的 100 GbE 連結。政府機構正在採用私有接取服務邊緣 (PASE),將檢查功能置於核心網路而非邊界網路,從而改變了流量模式並增加了東西向頻寬需求。國防機構也在優先考慮使用本地 AI 推理來分析無人機拍攝的影像,這推動了對支援 GPU 的網路拓撲的需求。
其他好處:
- Excel格式的市場預測(ME)表
- 3個月的分析師支持
目錄
第1章:引言
- 研究假設和市場定義
- 調查範圍
第2章:調查方法
第3章執行摘要
第4章 市場狀況
- 市場概覽
- 市場促進因素
- 超大規模和雲端運算採用率的快速成長
- 擴大網路攻擊範圍並加強合規要求
- 行動資料通訊和OTT內容激增
- 政府支持的國內數據居住政策
- 海底電纜的登陸實現了低延遲互聯。
- 引入白盒/開放式網路以降低整體擁有成本
- 市場限制因素
- 多重雲端架構中網路複雜性的日益增加
- 熟練的資料中心網路專家短缺
- 電網長期不穩定導致停電。
- 網路設備的進口關稅和清關延誤
- 價值供應鏈分析
- 監理情勢
- 技術展望
- 投資和資金籌措分析
- 波特五力模型
- 評估宏觀經濟趨勢對市場的影響
第5章 市場規模與成長預測
- 按組件
- 產品
- 乙太網路切換器
- 路由器
- 儲存區域網路(SAN)
- 應用傳遞控制器(ADC)
- 網路安全設備
- 軟體定義網路 (SDN) 控制器
- 光連接模組
- 服務
- 安裝與整合
- 培訓和諮詢
- 支援與維護
- 主機服務
- 產品
- 最終用戶
- IT/通訊
- 銀行、金融服務和保險(BFSI)
- 政府/國防
- 媒體與娛樂
- 醫療保健和生命科學
- 製造業和工業
- 其他最終用戶
- 依資料中心類型
- 搭配
- 超大規模資料中心業者雲端服務供應商/雲端服務供應商
- 邊緣/微型資料中心
- 頻寬
- 10 GbE 或更低
- 25~40 GbE
- 50~100 GbE
- 超過 100 GbE
- 國家
- 南非
- 奈及利亞
- 肯亞
- 埃及
- 摩洛哥
- 其他非洲國家
第6章 競爭情勢
- 市場集中度
- 策略趨勢
- 市佔率分析
- 公司簡介
- Huawei Technologies Co. Ltd.
- Cisco Systems, Inc.
- F5, Inc.
- H3C Holding Limited
- NEC Corporation
- Juniper Networks, Inc.
- VMware, Inc.
- A10 Networks, Inc.
- Extreme Networks, Inc.
- Dell Technologies Inc.
- Array Networks, Inc.
- Radware Ltd.
- TP-Link Corporation Limited
- Moxa Inc.
- Arista Networks, Inc.
- Hewlett Packard Enterprise Company
- Nokia Corporation
- Ciena Corporation
- Fortinet, Inc.
- Check Point Software Technologies Ltd.
第7章 市場機會與未來展望
According to Mordor Intelligence, the Africa data center networking market size is expected to grow from USD 2.1 billion in 2025 to USD 2.38 billion in 2026 and is forecast to reach USD 4.41 billion by 2031 at 13.18% CAGR over 2026-2031.
This report Segments the Industry Into Components (By Product, by Services), End-Users (IT & Telecommunication, BFSI, Other End-Users). By Data-Center Type(Colocation, Hyperscalers/Cloud Service Providers, and More). And Bandwidth( <=10 GbE, 25-40 GbE, and More). The Market Forecasts are Provided in Terms of Value (USD).
Africa Data Center Networking Market Trends and Insights
Rapid Expansion of Hyperscale and Cloud Deployments
Hyperscalers are reshaping the Africa data center networking market as Microsoft, Google, and Amazon Web Services commit fresh capital for sovereign cloud zones. Microsoft's USD 298 million South African program delivers AI-ready fabrics built around 25 GbE leaf and 100 GbE spine layers that support large-language-model training. Google's Johannesburg cloud region, live since early 2024, shows latency reductions of 80 milliseconds compared with Amsterdam routes, prompting regional SaaS firms to migrate workloads. Each new cloud availability zone triggers parallel investments in carrier-neutral meet-me rooms, dark-fiber routes, and open-bridged 400G optical uplinks that feed the new campuses. In Senegal, AWS partners with Sonatel to deliver sub-5 millisecond services for fintech workloads, underlining how sovereign cloud regions spur a multiplier effect on switching, routing, and interconnection spending.
Rising Cyber-Attack Surface and Compliance Mandates
Tighter privacy statutes increase capital allocation toward secure switching fabrics and micro-segmented leaf layers. South Africa's POPIA forces enterprises to deploy next-generation firewalls, zero-trust overlays, and telemetry-rich routers able to export flow data for audit trails.Banks in Nigeria and South Africa are early adopters of secure SD-WAN, illustrated by African Bank's Fortinet rollout that halved WAN expense while meeting PCI DSS rules. Compliance extends beyond finance as healthcare and public-sector clouds must maintain encrypted east-west pathways and demonstrate deterministic data-residency enforcement. Demand therefore migrates toward intent-based fabrics with embedded crypto engines and AI-driven anomaly detection that shortens mean-time-to-detect from hours to minutes.
Escalating Network Complexity in Multi-Cloud Fabric
African enterprises adopting multi-cloud strategies face inconsistent performance, tool sprawl, and higher operational costs. A South African retail bank needed five different control planes to secure traffic across two local clouds and one European zone, resulting in configuration drift and extended change windows. Limited in-house expertise pushes organisations toward managed overlay networks that raise opex even while solving skill gaps. The situation delays the adoption of software-defined fabrics and stalls the migration of latency-sensitive apps such as digital trading platforms.
Other drivers and restraints analyzed in the detailed report include:
- Surge in Mobile Data Traffic and OTT Content
- Government-Backed National Data-Residency Policies
- Scarcity of Skilled DC Networking Professionals
For complete list of drivers and restraints, kindly check the Table Of Contents.
Segment Analysis
Products retained 67.45% of the Africa data center networking market share in 2025, as every facility still requires a baseline of physical switches, routers, and optical transport gear. Ethernet switches remain the largest revenue contributor because leaf-spine designs rely on high-port-density TOR units coupled with low-latency spine blocks. Routing continues to find purchase within campus cores, internet gateways, and data-center interconnects that link metro nodes to subsea landing stations. Security appliances and ADCs are gaining momentum as zero-trust and SSL offload proliferate.
Services are scaling faster at a 14.08% CAGR through 2031 as enterprises aim to bridge operational skill deficiencies. Installation and integration engagements are the first port of call for hyperscaler newcomers that want assured time-to-market. Managed network services deliver continuous operations support, freeing local IT teams to focus on application enablement. Training and consulting lines are growing because large multinationals attempt to build regional centres of excellence that can eventually own leaf-spine operations internally. Support and maintenance revenues likewise climb as SLA-sensitive sectors such as finance and healthcare demand four-nines uptime.
IT and telecommunications players accounted for 32.65% of the Africa data center networking market size in 2025 as they deploy dense fabrics to host customer VMs, OTT caches, and 5G core functions. Telcos are refreshing edge aggregation sites from 10 GbE to 25 GbE in preparation for ultra-reliable low-latency traffic while also investing in segment routing to control inter-city paths. Cloud-native ISPs embrace white-box units running SONiC, which lowers capital spending by 40% relative to branded stacks and shortens lead times amid global supply constraints.
Government and defence workloads exhibit the swiftest growth at 14.72% CAGR. National clouds, e-health repositories, and smart-city telemetry demand encrypted 100 GbE links across redundant availability zones. Ministries adopt private access service edges that place inspection functions inside the core rather than at the perimeter, which changes traffic flow patterns and increases east-west bandwidth needs. Defence agencies also prioritise on-premise AI inference to analyse drone footage, thereby driving requests for GPU-aware network topologies.
Complete Report Scope:
- By Component
- Products
- Ethernet Switches
- Routers
- Storage Area Network (SAN)
- Application Delivery Controllers (ADC)
- Network Security Appliances
- Software-Defined Networking (SDN) Controllers
- Optical Interconnects
- Services
- Installation and Integration
- Training and Consulting
- Support and Maintenance
- Managed Network Services
- Products
- By End-User
- IT and Telecommunications
- Banking, Financial Services and Insurance (BFSI)
- Government and Defense
- Media and Entertainment
- Healthcare and Life Sciences
- Manufacturing and Industrial
- Other End-Users
- By Data-Center Type
- Colocation
- Hyperscalers/Cloud Service Providers
- Edge/Micro Data Centers
- By Bandwidth
- Less Than or equals to 10 GbE
- 25-40 GbE
- 50-100 GbE
- Greater than 100 GbE
- By Country
- South Africa
- Nigeria
- Kenya
- Egypt
- Morocco
- Rest of Africa
List of Companies Covered in this Report:
- Huawei Technologies Co. Ltd.
- Cisco Systems, Inc.
- F5, Inc.
- H3C Holding Limited
- NEC Corporation
- Juniper Networks, Inc.
- VMware, Inc.
- A10 Networks, Inc.
- Extreme Networks, Inc.
- Dell Technologies Inc.
- Array Networks, Inc.
- Radware Ltd.
- TP-Link Corporation Limited
- Moxa Inc.
- Arista Networks, Inc.
- Hewlett Packard Enterprise Company
- Nokia Corporation
- Ciena Corporation
- Fortinet, Inc.
- Check Point Software Technologies Ltd.
Additional Benefits:
- The market estimate (ME) sheet in Excel format
- 3 months of analyst support
TABLE OF CONTENTS
1 INTRODUCTION
- 1.1 Study Assumptions and Market Definition
- 1.2 Scope of the Study
2 RESEARCH METHODOLOGY
3 EXECUTIVE SUMMARY
4 MARKET LANDSCAPE
- 4.1 Market Overview
- 4.2 Market Drivers
- 4.2.1 Rapid expansion of hyperscale and cloud deployments
- 4.2.2 Rising cyber-attack surface and compliance mandates
- 4.2.3 Surge in mobile data traffic and OTT content
- 4.2.4 Government backed national data-residency policies
- 4.2.5 Sub-sea cable landings enabling low-latency peering
- 4.2.6 Adoption of white-box/open networking to cut TCO
- 4.3 Market Restraints
- 4.3.1 Escalating network complexity in multi-cloud fabric
- 4.3.2 Scarcity of skilled DC networking professionals
- 4.3.3 Chronic power-grid instability causing downtime
- 4.3.4 Import tariffs and customs delays on networking gear
- 4.4 Value / Supply-Chain Analysis
- 4.5 Regulatory Landscape
- 4.6 Technological Outlook
- 4.7 Investment and Funding Analysis
- 4.8 Porters Five Forces
- 4.8.1 Threat of New Entrants
- 4.8.2 Bargaining Power of Buyers
- 4.8.3 Bargaining Power of Suppliers
- 4.8.4 Threat of Substitutes
- 4.8.5 Intensity of Competitive Rivalry
- 4.9 Assessment of the impact of Macro Economic Trends on the Market
5 MARKET SIZE and GROWTH FORECASTS (VALUE)
- 5.1 By Component
- 5.1.1 Products
- 5.1.1.1 Ethernet Switches
- 5.1.1.2 Routers
- 5.1.1.3 Storage Area Network (SAN)
- 5.1.1.4 Application Delivery Controllers (ADC)
- 5.1.1.5 Network Security Appliances
- 5.1.1.6 Software-Defined Networking (SDN) Controllers
- 5.1.1.7 Optical Interconnects
- 5.1.2 Services
- 5.1.2.1 Installation and Integration
- 5.1.2.2 Training and Consulting
- 5.1.2.3 Support and Maintenance
- 5.1.2.4 Managed Network Services
- 5.1.1 Products
- 5.2 By End-User
- 5.2.1 IT and Telecommunications
- 5.2.2 Banking, Financial Services and Insurance (BFSI)
- 5.2.3 Government and Defense
- 5.2.4 Media and Entertainment
- 5.2.5 Healthcare and Life Sciences
- 5.2.6 Manufacturing and Industrial
- 5.2.7 Other End-Users
- 5.3 By Data-Center Type
- 5.3.1 Colocation
- 5.3.2 Hyperscalers/Cloud Service Providers
- 5.3.3 Edge/Micro Data Centers
- 5.4 By Bandwidth
- 5.4.1 Less Than or equals to 10 GbE
- 5.4.2 25-40 GbE
- 5.4.3 50-100 GbE
- 5.4.4 Greater than 100 GbE
- 5.5 By Country
- 5.5.1 South Africa
- 5.5.2 Nigeria
- 5.5.3 Kenya
- 5.5.4 Egypt
- 5.5.5 Morocco
- 5.5.6 Rest of Africa
6 COMPETITIVE LANDSCAPE
- 6.1 Market Concentration
- 6.2 Strategic Moves
- 6.3 Market Share Analysis
- 6.4 Company Profiles (includes Global level Overview, Market level overview, Core Segments, Financials as available, Strategic Information, Market Rank/Share for key companies, Products and Services, and Recent Developments)
- 6.4.1 Huawei Technologies Co. Ltd.
- 6.4.2 Cisco Systems, Inc.
- 6.4.3 F5, Inc.
- 6.4.4 H3C Holding Limited
- 6.4.5 NEC Corporation
- 6.4.6 Juniper Networks, Inc.
- 6.4.7 VMware, Inc.
- 6.4.8 A10 Networks, Inc.
- 6.4.9 Extreme Networks, Inc.
- 6.4.10 Dell Technologies Inc.
- 6.4.11 Array Networks, Inc.
- 6.4.12 Radware Ltd.
- 6.4.13 TP-Link Corporation Limited
- 6.4.14 Moxa Inc.
- 6.4.15 Arista Networks, Inc.
- 6.4.16 Hewlett Packard Enterprise Company
- 6.4.17 Nokia Corporation
- 6.4.18 Ciena Corporation
- 6.4.19 Fortinet, Inc.
- 6.4.20 Check Point Software Technologies Ltd.
7 MARKET OPPORTUNITIES and FUTURE OUTLOOK
- 7.1 White-space and Unmet-Need Assessment

 資料中心水冷連接器:全球市場佔有率和排名,2026-2032年總收入和需求預測
 全球資料中心網路市場規模、佔有率、趨勢和成長分析報告(2026-2034)
 北美資料中心網路:市場佔有率分析、產業趨勢與統計及成長預測(2026-2031 年)南美洲資料中心網路:市場佔有率分析、產業趨勢與統計及成長預測(2026-2031 年)印度資料中心網路:市場佔有率分析、產業趨勢與統計及成長預測(2026-2031 年)德國資料中心網路:市場佔有率分析、產業趨勢與統計及成長預測(2026-2031 年)歐洲資料中心網路:市場佔有率分析、產業趨勢與統計及成長預測(2026-2031 年)泰國資料中心網路:市場佔有率分析、產業趨勢與統計及成長預測(2026-2031)美國資料中心網路:市場佔有率分析、產業趨勢與統計及成長預測(2026-2031 年)義大利資料中心網路:市場佔有率分析、產業趨勢與統計及成長預測(2026-2031 年)