


 |
市場調查報告書
商品編碼
2119554
跨境光纖線路:市場佔有率分析、行業趨勢和統計數據以及成長預測(2026-2031 年)Cross-Border Fiber Route - Market Share Analysis, Industry Trends & Statistics, Growth Forecasts (2026 - 2031) |
||||||

※ 本網頁內容可能與最新版本有所差異。詳細情況請與我們聯繫。
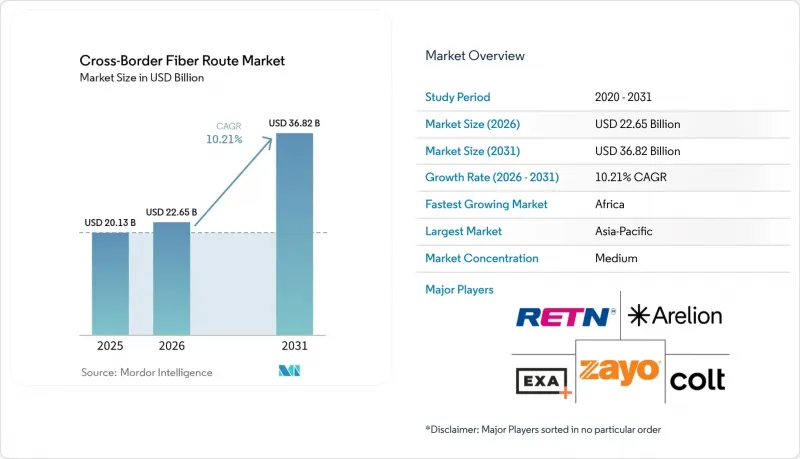
據 Mordor Intelligence 稱,2025 年跨境光纖線路市場規模為 201.3 億美元,預計到 2031 年將從 2026 年的 226.5 億美元成長至 368.2 億美元,預測期(2026-2031 年)複合年成長率為 10.21%。
本報告按網路類型(陸基跨境光纖骨幹網路、海底光纖骨幹網路和陸基/海底混合骨幹網路)、所有權類型(獨資、聯合體等)、服務類型(暗纖和光纖對IRU等)、應用(例如,電信業者傳輸)和地區進行細分。市場預測以美元(USD)為單位。
全球跨境光纖線路市場趨勢與洞察。
對超大規模資料中心業者和人工智慧叢集之間互聯互通的需求
超大規模資料中心業者在2010年僅佔很小的市場佔有率,預計到2025年將佔據國際海底頻寬的75%。它們也將參與2025年規劃的海底光纜鋪設工程的三分之二以上。人工智慧訓練和推理工作負載需要在位於不同司法管轄區的資料中心之間傳輸極其大規模的資料集。這種需求促使用戶選擇具有可預測延遲和低丟包率的專用光纖對和路由。跨境光纖路由市場正從傳統消費者網際網路的城際連接轉向GPU密集區域之間的連結。 EXA Infrastructure在2026年報告中指出,隨著金融服務客戶將資料輸入人工智慧模型,訂單已從1G和10G轉向100G和400G。
內容提供者直接擁有專用電纜
內容提供者正從租賃容量轉向直接擁有海底和陸基光纖資產。這種方式使他們能夠更好地控制用於雲端和人工智慧流量的路由的容量、安全性和升級決策。跨境光纖路由市場中大規模私人系統的出現也正在改變批發業者的需求平衡。一些共同建造的系統為私人營運商提供光纖對和頻段的接入,但隨著內部需求的成長,這些容量可能無法持續供應。在跨境光纖路由市場,能夠將陸基、海底和登陸站資產整合到單一服務設計中的營運商優勢日益凸顯。在高優先級國際線路上,當客戶要求從單一供應商獲得端到端容量時,小規模的批發業者可能會面臨顯著劣勢。
對海底電纜、登陸站和跨境回程傳輸。
海底光纜系統、登陸站和陸上回程傳輸都需要大量的前期投資。由於少數光纜系統供應商的產能受限,到2026年,光纜鋪設前置作業時間已從18個月延長至48個月。這項變更要求投資人在獲得回報保障之前,持續投入資金的時間更長。這也加劇了擁有內部資金籌措柔軟性的超大規模資料中心業者與依賴企劃案融資的小規模業者之間的差距。 EXA Infrastructure於2025年7月部署的倫敦-法蘭克福-阿姆斯特丹-布魯塞爾線路包含了其第21和第22個海底光纜登陸站。土木工程、電力供應、監管擔保、海洋規劃費以及沿海國接入費等成本推高了跨境光纖線路市場新線路的總成本。
細分市場分析
至2025年,陸基跨境光纖骨幹網路將佔跨國光纖線路市場市佔率的46.58%。其市場地位反映了陸基線路已確立的通行權、較低的維護複雜性以及與陸上走廊沿線成熟電信業者建立的穩固合作關係。這些系統在連接美洲、歐洲和中亞的大都會圈和國際電話交換機繼續發揮著至關重要的作用。海底骨幹網路系統則提供連接這些陸上網路的洲際連結。由於跨境光纖線路市場在高容量海上交通中扮演關鍵角色,因此它依賴陸上和海上資源,而不是單一的基礎設施形式。
預計到2031年,陸基-海底混合骨幹網的複合年成長率將達到11.59%。這種骨幹網路結合了海底和陸地部分,彌補了單一基礎設施類型無法提供足夠多樣性、延遲連貫或容錯能力的不足。在2026年的一項技術展示中,利用相干插入式光學模組,在5682公里長的海底光纜上成功實現了每波長400G的傳輸。這一結果表明,即使在長距離海底光纜段上,無需單一轉發器進行再生,也能支援高容量服務。 2025年,GEANT也展示了在3403公里長的陸地鏈路上無需再生即可實現400G傳輸。這些進展進一步凸顯了混合路由設計對於滿足面向人工智慧的連接需求的重要性。
到2025年,該行業43.93%的股份由財團持有。這種模式允許多家電信業者分擔關鍵海上走廊系統的資本風險。當線路服務於多家具有共同策略需求的營運商時,這種模式仍然適用。 2025年6月,電訊盈科(PCCW Global)、Sparkle、埃及電信(Telecom Egypt)和阿曼電信國際公司(Zain Omantel International)就AAE-2海底光纜系統簽署了合作備忘錄。該專案表明,財團結構在複雜的洲際系統中仍然具有價值,能夠將風險分散到每個使用容量的營運商。
預計2026年至2031年間,批發中立主機的所有權結構將以11.37%的複合年成長率成長。開放接取平台允許出售暗纖、波長或託管容量,而無需終端用戶業務的直接競爭。這種機制支持小規模的電信業者、公共機構和無法承諾購買完整IRU(專屬使用單元)的企業,同時也促進了在沒有單一一方願意為整個系統資金籌措的情況下進行的發展。在使用者需要完全流量控制和隔離的私有系統中,單一所有權模式仍然至關重要。在跨境光纖路由市場,兩種所有權模式都可行,因為買家的資金籌措能力、安全要求和基礎設施共用意願各不相同。
區域分析
到2025年,亞太地區將佔據跨境光纖路由市場35.42%的佔有率。該地區擁有覆蓋中國、日本、印度、韓國和東南亞的海底光纜登陸基礎設施、超大規模資料中心業者資料中心和人工智慧運算能力。 2025年7月,中華電信投資超過24億新台幣(約7,300萬美元)興建AUG東亞海底光纜。該系統計劃在台灣宜蘭和台東沿海登陸,預計2029年完工。連接香港、日本和新加坡的SJC2亞亞海底光纜將於2025年投入運營,設計容量為126Tbps。同時,2026年,塔塔通訊投資1.52億美元,透過MIST海底光纜系統和一條新的清奈-新加坡聯合海底光纜,擴大印度和新加坡之間的傳輸容量。
北美和歐洲對主要跨國光纖線路的投資依然活躍。 EXA Infrastructure於2025年9月啟動了“維謝格拉德計畫”,計劃透過一條新的國際線路連接華沙、布拉格、布拉提斯拉瓦和布達佩斯。 2025年12月,EXA完成了對AquaComms的收購,透過在北大西洋新增9條線路,將其海底光纜登陸站的數量擴展至29個。該地區的跨境光纖線路市場受益於已建立的需求中心,以及歐盟委員會2025年為「安全骨幹光纖」、「5G」和「量子通訊」計畫提供的資金支持。預計這些資金將進一步加速中東歐地區的互聯互通。
預計2026年至2031年,非洲跨國光纖線路市場將以12.65%的複合年成長率成長,成為各區域中成長速度最高的地區。 2026年4月,非洲開發銀行批准向奈及利亞的「數位價值鏈基礎設施項目」提供2億美元貸款。該計畫旨在將奈及利亞的光纖骨幹網路從3萬公里擴展至12萬公里,從而實現與貝南、喀麥隆、尼日和查德的互聯互通。 2026年6月,Seacom公司在內羅畢和坎帕拉之間部署了一條陸路線路。該線路初始容量為1Tbps,可擴展至30Tbps,進而改善內陸地區與沿海登陸站之間的連接。維修能力仍然是該地區的一大限制因素,國際電信聯盟(ITU)和國際防災減災委員會(ICPC)在2026年的報告指出,南印度洋沒有常駐維修船。
其他好處:
- Excel格式的市場預測(ME)表
- 3個月的分析師支持
目錄
第1章:引言
- 研究假設和市場定義
- 調查範圍
第2章:調查方法
第3章執行摘要
第4章 市場狀況
- 市場概覽
- 宏觀經濟因素對市場的影響
- 市場促進因素
- 對超大規模資料中心業者和人工智慧叢集之間互聯互通的需求。
- 內容提供者直接擁有私人電纜
- 國家層級的互聯互通和資料本地化義務
- 實現運輸路線多元化,以避開地緣政治瓶頸
- 服務不足地區的數位走廊計劃
- 面向分散式人工智慧工作負載的預測性路徑設計
- 市場限制因素
- 高海事、登陸站和跨境回程回程傳輸資本投資
- 授權和環境審核延誤
- 維修船隻和專用零件供不應求
- 重新確定各走廊的保單風險敞口和保費。
- 產業價值鏈分析
- 監理情勢
- 技術展望
- 波特五力分析
第5章 市場規模與成長預測
- 依網路類型
- 陸基跨境光纖骨幹網
- 海底光纖骨幹網
- 陸生和海底混合型主幹
- 依所有權類型
- 獨資
- 財團所有
- 批發/中立主機所有權
- 按服務類型
- 暗纖和光纖對 IRU
- 波長和頻譜容量
- 國際和承運人運輸
- 跨境網站寄存服務
- 透過使用
- 超大規模資料中心業者和雲端互連
- 電信業者和運輸
- 資料中心之間的互連
- 政府和國防部門的互聯互通
- 用於金融服務和低延遲交易的連接
- 內容傳送和媒體分發
- 按地區
- 北美洲
- 美國
- 加拿大
- 墨西哥
- 南美洲
- 巴西
- 智利
- 阿根廷
- 其他南美國家
- 歐洲
- 德國
- 英國
- 法國
- 俄羅斯
- 其他歐洲國家
- 亞太地區
- 中國
- 日本
- 印度
- 韓國
- 其他亞太國家
- 中東
- 沙烏地阿拉伯
- 阿拉伯聯合大公國
- 土耳其
- 其他中東國家
- 非洲
- 南非
- 奈及利亞
- 埃及
- 其他非洲國家
- 北美洲
第6章 競爭情勢
- 市場集中度
- 策略趨勢
- 市佔率分析
- 公司簡介
- Arelion AB
- Colt Technology Services Group Limited
- Zayo Group Holdings, Inc.
- EXA Infrastructure Services UK Limited
- RETN Limited
- Tata Communications Limited
- NTT DOCOMO BUSINESS, Inc.
- Orange SA
- Telecom Italia Sparkle SpA
- PCCW Global, Inc.
- Lumen Technologies, Inc.
- GTT Communications, Inc.
- GlobalConnect A/S
- Cogent Communications Holdings, Inc.
- Deutsche Telekom AG
- Telefonica Global Solutions, SLU
- Singapore Telecommunications Limited
- SubCom, LLC
- NEC Corporation
- Alcatel Submarine Networks SAS
- HMN Technologies Co., Ltd.
- Ciena Corporation
- Nokia Corporation
- Telxius Telecom, SA
第7章 市場機會與未來展望
According to Mordor Intelligence, the cross-border fiber route market size was valued at USD 20.13 billion in 2025 and estimated to grow from USD 22.65 billion in 2026 to reach USD 36.82 billion by 2031, at a CAGR of 10.21% during the forecast period (2026-2031).
This report is Segmented by Network Type (Terrestrial Cross-Border Fiber Backbone, Submarine Fiber Backbone, and Hybrid Terrestrial-Submarine Backbone), Ownership Type (Single Ownership, Consortium Ownership, and More), Service Type (Dark Fiber and Fiber-Pair IRUs, and More), Application (Telecom Carrier Transit, and More), and Geography. The Market Forecasts are Provided in Terms of Value (USD).
Global Cross-Border Fiber Route Market Trends and Insights
Hyperscaler and AI-Cluster Interconnection Demand
Hyperscalers held 75% of total international subsea bandwidth in 2025, after having a negligible share in 2010. They also participated in more than two-thirds of planned submarine cable deployments in 2025. AI training and inference workloads move very large datasets between data centers in different jurisdictions. This requirement favors dedicated fiber pairs and routes with predictable latency and low packet loss. The Cross-border fiber route market is shifting toward links between GPU-dense locations rather than only traditional consumer internet city pairs. EXA Infrastructure reported in 2026 that financial services customers had moved from 1G and 10G orders to 100G and 400G orders as they brought data into AI models.
Direct Private-Cable Ownership by Content Providers
Content providers are moving from leased capacity toward direct ownership of submarine and terrestrial fiber assets. This approach gives them greater control over capacity, security, and upgrade decisions on routes used for cloud and AI traffic. Larger private systems in the Cross-border fiber route market also change the balance of demand available to wholesale carriers. Some jointly built systems provide commercial parties with access to fiber pairs or spectrum, yet that capacity is not assured to remain available as internal demand grows. The Cross-border fiber route market increasingly favors operators that can combine terrestrial, subsea, and landing-station assets into a single service design. Smaller wholesale providers can face a material disadvantage when customers require end-to-end capacity from a single supplier on high-priority international corridors.
High Marine, Landing-Station, and Cross-Border Backhaul Capex
Marine cable systems, landing stations, and terrestrial backhaul require major upfront funding. Cable-build lead times had increased from 18 months to 48 months by 2026 due to constrained manufacturing capacity among a small group of cable-system vendors. That change requires investors to commit capital for longer periods before revenue is certain. It also widens the gap between hyperscalers with internal funding flexibility and smaller operators that depend on project finance. EXA Infrastructure's London-Frankfurt-Amsterdam-Brussels route, deployed in July 2025, included the company's 21st and 22nd cable landing stations. Civil works, power supply, regulatory bonding, marine planning fees, and coastal-state access charges raise the total cost of a new route in the Cross-border fiber route market.
Other drivers and restraints analyzed in the detailed report include:
- Sovereign Connectivity and Data-Localization Mandates
- Route Diversification Away from Geopolitical Chokepoints
- Permitting and Environmental-Approval Delays
For complete list of drivers and restraints, kindly check the Table Of Contents.
Segment Analysis
Terrestrial cross-border fiber backbones accounted for 46.58% of the Cross-border fiber route market in 2025. Their position reflects established rights-of-way, lower repair complexity, and mature carrier relationships across land corridors. These systems remain important in the Americas, Europe, and Central Asia, where they connect metropolitan networks and international gateways. Submarine backbone systems provide the intercontinental links that connect these terrestrial networks. Their essential role in high-volume ocean traffic means the Cross-border fiber route market depends on both land and marine assets rather than a single infrastructure format.
Hybrid terrestrial-submarine backbones are projected to record an 11.59% CAGR through 2031. They combine marine and overland sections when a single infrastructure type cannot provide sufficient diversity, latency control, or resilience. A 2026 technical demonstration achieved 400G per wavelength over 5,682 km of subsea cable using coherent pluggable optics. The result indicates that long subsea sections can support higher-capacity services without discrete transponder regeneration, while GEANT demonstrated 400G transmission over a 3,403 km terrestrial link in 2025 without regeneration. These developments make hybrid route designs more relevant for AI-oriented connectivity requirements.
Consortium ownership accounted for 43.93% of the sector in 2025. This model allows several carriers to share the capital risk of systems on important oceanic corridors. It remains appropriate where a route serves several operators with aligned strategic needs. PCCW Global, Sparkle, Telecom Egypt, and Zain Omantel International signed a memorandum of understanding for the AAE-2 cable system in June 2025. The project shows that consortium structures retain value for complex intercontinental systems and can distribute risk across the entities that use the capacity.
Wholesale neutral-host ownership is expected to grow at a 11.37% CAGR from 2026 to 2031. Open-access platforms can sell dark fiber, wavelengths, or managed capacity without competing directly for end-user business. This arrangement can help smaller carriers, public entities, and enterprises that cannot commit to a full IRU position, while supporting development where no single party wants to finance a complete system. Single ownership remains relevant for private systems where users require full traffic control and isolation. The Cross-border fiber route market can support both ownership models because buyers differ in their funding capacity, security needs, and willingness to share infrastructure.
Complete Report Scope:
- By Network Type
- Terrestrial Cross-Border Fiber Backbone
- Submarine Fiber Backbone
- Hybrid Terrestrial-Submarine Backbone
- By Ownership Type
- Single Ownership
- Consortium Ownership
- Wholesale Neutral Host Ownership
- By Service Type
- Dark Fiber and Fiber-Pair IRUs
- Wavelength and Spectrum Capacity
- International Transport and Carrier Transit
- Managed Cross-Border Network Services
- By Application
- Hyperscaler and Cloud Interconnect
- Telecom Carrier Transit
- Data Center Interconnect
- Government and Defense Connectivity
- Financial Services and Low-Latency Trading Connectivity
- Content Delivery and Media Distribution
- By Geography
- North America
- United States
- Canada
- Mexico
- South America
- Brazil
- Chile
- Argentina
- Rest of South America
- Europe
- Germany
- United Kingdom
- France
- Russia
- Rest of Europe
- Asia-Pacific
- China
- Japan
- India
- South Korea
- Rest of Asia-Pacific
- Middle East
- Saudi Arabia
- United Arab Emirates
- Turkey
- Rest of Middle East
- Africa
- South Africa
- Nigeria
- Egypt
- Rest of Africa
- North America
Geography Analysis
Asia-Pacific held 35.42% of the Cross-border fiber route market share in 2025. The region combines subsea landing infrastructure, hyperscaler data centers, and AI computing capacity across China, Japan, India, South Korea, and Southeast Asia. Chunghwa Telecom invested more than NTD 2.4 billion (USD 73 million) in the AUG East intra-Asian subsea cable in July 2025. The system is expected to have landings on Taiwan's Yilan and Taitung coasts and target completion in 2029. The SJC2 intra-Asia cable became operational in 2025 with a design capacity of 126 Tbps, connecting Hong Kong, Japan, and Singapore, while Tata Communications committed USD 152 million in 2026 to expand India-Singapore capacity via the MIST Cable System and a new Chennai-Singapore consortium cable.
North America and Europe continue to attract major cross-border route investment. EXA Infrastructure launched Project Visegrad in September 2025, connecting Warsaw, Prague, Bratislava, and Budapest through new international routes. EXA completed its acquisition of Aqua Comms in December 2025, adding 9 North Atlantic routes and expanding its cable landing portfolio to 29 stations. The Cross-border fiber route market benefits in this region from established demand centers and the European Commission's 2025 funding for secure backbone fiber, 5G, and quantum communications. The funding favors additional interconnections across Central and Eastern Europe.
Africa is projected to grow at a 12.65% CAGR from 2026 to 2031, the highest regional rate in the Cross-border fiber route market. The African Development Bank approved a USD 200 million loan for Nigeria's Digital Value Chain Infrastructure Project in April 2026, targeting expansion of the national fiber backbone from 30,000 km to 120,000 km and links to Benin, Cameroon, Niger, and Chad. Seacom deployed a Nairobi-Kampala terrestrial route in June 2026 with 1 Tbps of initial capacity that can scale to 30 Tbps, improving inland access to coastal landing stations. Repair capacity remains a regional constraint because the ITU and ICPC reported in 2026 that the South Indian Ocean had no permanently stationed repair vessels.
- Arelion AB
- Colt Technology Services Group Limited
- Zayo Group Holdings, Inc.
- EXA Infrastructure Services UK Limited
- RETN Limited
- Tata Communications Limited
- NTT DOCOMO BUSINESS, Inc.
- Orange S.A.
- Telecom Italia Sparkle S.p.A.
- PCCW Global, Inc.
- Lumen Technologies, Inc.
- GTT Communications, Inc.
- GlobalConnect A/S
- Cogent Communications Holdings, Inc.
- Deutsche Telekom AG
- Telefonica Global Solutions, S.L.U.
- Singapore Telecommunications Limited
- SubCom, LLC
- NEC Corporation
- Alcatel Submarine Networks SAS
- HMN Technologies Co., Ltd.
- Ciena Corporation
- Nokia Corporation
- Telxius Telecom, S.A.
Additional Benefits:
- The market estimate (ME) sheet in Excel format
- 3 months of analyst support
TABLE OF CONTENTS
1 INTRODUCTION
- 1.1 Study Assumptions and Market Definition
- 1.2 Scope of the Study
2 RESEARCH METHODOLOGY
3 EXECUTIVE SUMMARY
4 MARKET LANDSCAPE
- 4.1 Market Overview
- 4.2 Impact of Macroeconomic Factors on the Market
- 4.3 Market Drivers
- 4.3.1 Hyperscaler and AI-Cluster Interconnection Demand
- 4.3.2 Direct Private-Cable Ownership by Content Providers
- 4.3.3 Sovereign Connectivity and Data-Localization Mandates
- 4.3.4 Route Diversification Away From Geopolitical Chokepoints
- 4.3.5 Digital Corridor Programs in Underserved Regions
- 4.3.6 Predictive Route Engineering for Distributed AI Workloads
- 4.4 Market Restraints
- 4.4.1 High Marine, Landing-Station, and Cross-Border Backhaul Capex
- 4.4.2 Permitting and Environmental-Approval Delays
- 4.4.3 Repair-Vessel and Specialized Component Bottlenecks
- 4.4.4 Corridor-Specific Security Exposure and Insurance Repricing
- 4.5 Industry Value Chain Analysis
- 4.6 Regulatory Landscape
- 4.7 Technological Outlook
- 4.8 Porter's Five Forces Analysis
- 4.8.1 Bargaining Power of Suppliers
- 4.8.2 Bargaining Power of Buyers
- 4.8.3 Threat of New Entrants
- 4.8.4 Threat of Substitutes
- 4.8.5 Competitive Rivalry
5 MARKET SIZE AND GROWTH FORECASTS (VALUE)
- 5.1 By Network Type
- 5.1.1 Terrestrial Cross-Border Fiber Backbone
- 5.1.2 Submarine Fiber Backbone
- 5.1.3 Hybrid Terrestrial-Submarine Backbone
- 5.2 By Ownership Type
- 5.2.1 Single Ownership
- 5.2.2 Consortium Ownership
- 5.2.3 Wholesale Neutral Host Ownership
- 5.3 By Service Type
- 5.3.1 Dark Fiber and Fiber-Pair IRUs
- 5.3.2 Wavelength and Spectrum Capacity
- 5.3.3 International Transport and Carrier Transit
- 5.3.4 Managed Cross-Border Network Services
- 5.4 By Application
- 5.4.1 Hyperscaler and Cloud Interconnect
- 5.4.2 Telecom Carrier Transit
- 5.4.3 Data Center Interconnect
- 5.4.4 Government and Defense Connectivity
- 5.4.5 Financial Services and Low-Latency Trading Connectivity
- 5.4.6 Content Delivery and Media Distribution
- 5.5 By Geography
- 5.5.1 North America
- 5.5.1.1 United States
- 5.5.1.2 Canada
- 5.5.1.3 Mexico
- 5.5.2 South America
- 5.5.2.1 Brazil
- 5.5.2.2 Chile
- 5.5.2.3 Argentina
- 5.5.2.4 Rest of South America
- 5.5.3 Europe
- 5.5.3.1 Germany
- 5.5.3.2 United Kingdom
- 5.5.3.3 France
- 5.5.3.4 Russia
- 5.5.3.5 Rest of Europe
- 5.5.4 Asia-Pacific
- 5.5.4.1 China
- 5.5.4.2 Japan
- 5.5.4.3 India
- 5.5.4.4 South Korea
- 5.5.4.5 Rest of Asia-Pacific
- 5.5.5 Middle East
- 5.5.5.1 Saudi Arabia
- 5.5.5.2 United Arab Emirates
- 5.5.5.3 Turkey
- 5.5.5.4 Rest of Middle East
- 5.5.6 Africa
- 5.5.6.1 South Africa
- 5.5.6.2 Nigeria
- 5.5.6.3 Egypt
- 5.5.6.4 Rest of Africa
- 5.5.1 North America
6 COMPETITIVE LANDSCAPE
- 6.1 Market Concentration
- 6.2 Strategic Moves
- 6.3 Market Share Analysis
- 6.4 Company Profiles (includes Global Level Overview, Market Level Overview, Core Segments, Financials as available, Strategic Information, Market Rank/Share, Products and Services, Recent Developments)
- 6.4.1 Arelion AB
- 6.4.2 Colt Technology Services Group Limited
- 6.4.3 Zayo Group Holdings, Inc.
- 6.4.4 EXA Infrastructure Services UK Limited
- 6.4.5 RETN Limited
- 6.4.6 Tata Communications Limited
- 6.4.7 NTT DOCOMO BUSINESS, Inc.
- 6.4.8 Orange S.A.
- 6.4.9 Telecom Italia Sparkle S.p.A.
- 6.4.10 PCCW Global, Inc.
- 6.4.11 Lumen Technologies, Inc.
- 6.4.12 GTT Communications, Inc.
- 6.4.13 GlobalConnect A/S
- 6.4.14 Cogent Communications Holdings, Inc.
- 6.4.15 Deutsche Telekom AG
- 6.4.16 Telefonica Global Solutions, S.L.U.
- 6.4.17 Singapore Telecommunications Limited
- 6.4.18 SubCom, LLC
- 6.4.19 NEC Corporation
- 6.4.20 Alcatel Submarine Networks SAS
- 6.4.21 HMN Technologies Co., Ltd.
- 6.4.22 Ciena Corporation
- 6.4.23 Nokia Corporation
- 6.4.24 Telxius Telecom, S.A.
7 MARKET OPPORTUNITIES AND FUTURE OUTLOOK
- 7.1 White-Space and Unmet-Need Assessment

 跨境光纖骨幹網路連接:市場佔有率分析、行業趨勢和統計數據以及成長預測(2026-2031 年)
 光纖到戶網路市場預測至2034年—全球組件、架構、安裝類型、應用、最終用戶和區域分析
 暗纖網路市場規模、佔有率和成長分析:按類型、光纖類型、最終用戶、應用和地區分類-2026-2033年產業預測
 2026年全球暗纖網路市場報告
 暗纖網路市場分析及預測(至2035年):依類型、產品類型、服務、技術、組件、應用、部署類型、最終用戶、安裝類型及解決方案分類
 全球暗纖網路市場規模、佔有率、趨勢和成長分析報告(2026-2034)
 暗纖網路市場規模、佔有率和趨勢分析報告:按光纖、網路、材料、應用、地區和細分市場預測(2026-2033 年)全球暗纖網路市場規模依光纖類型、網路類型、材料、地區、預測:
 全球暗纖網路市場:市場規模、佔有率、趨勢分析(按網路類型、光纖類型、材料和應用)、區域展望和未來預測(2024-2031 年)