


 |
市場調查報告書
商品編碼
2119275
物理人工智慧生態系統:市場佔有率分析、產業趨勢與統計、成長預測(2026-2031)Physical AI Ecosystem - Market Share Analysis, Industry Trends & Statistics, Growth Forecasts (2026 - 2031) |
||||||

※ 本網頁內容可能與最新版本有所差異。詳細情況請與我們聯繫。
根據 Mordor Intelligence 預測,實體人工智慧生態系統市場規模將從 2025 年的 225.8 億美元和 2026 年的 260.6 億美元成長到 2031 年的 514.7 億美元,2026 年至 2031 年的年複合成長率(CAGR)為 14.58%。
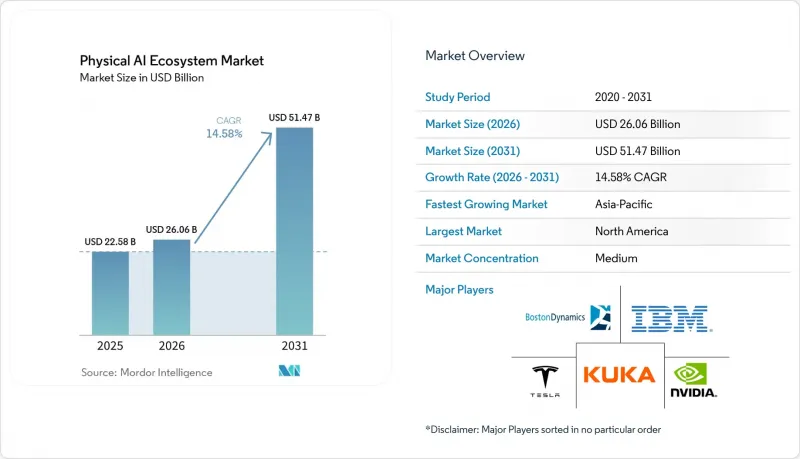
本報告按組件(硬體、軟體、服務)、機器人類型和形態(工業機器人、商用服務機器人、個人/家用服務機器人等)、部署模式(設備端、雲端、混合)、終端用戶產業(物流/供應鏈、製造業、醫療保健等)以及地區進行細分。市場預測以美元計價。
全球物理人工智慧生態系統市場趨勢與洞察
用於即時自主操作的低延遲邊緣推理
在實體人工智慧生態系統市場中,當機器人靠近人員、設備或移動物料運作時,需要快速的在地決策。遠端雲端連接會引入延遲,使其不適用於汽車生產線、醫院走廊或擁擠倉庫中的移動機械等應用場景。 2025年8月,NVIDIA正式發表了基於Blackwell架構的Jetson Thor。該產品在130瓦的功耗框架內,可提供高達2070 FP4 teraflops的人工智慧運算效能,開發者套件售價為3,499美元。據NVIDIA稱,與上一代產品相比,其人工智慧運算效能提升了7.5倍,能源效率提升了3.5倍。這些特性使得邊緣推理成為需要在嚴格操作時限內做出回應的設備的核心設計選擇。因此,沒有機器人專用推理協議堆疊的供應商可能會發現,他們在實體人工智慧部署領域的市場佔有率有限。
非例行體力勞動崗位勞工短缺
許多具有挑戰性的任務需要在傳統自動化系統無法有效應對的環境中完成,勞動力短缺正在推動對實體人工智慧生態系統市場的需求。目前仍存在的挑戰包括揀選形狀不規則的包裹、管理混合產品線的波動以及在潮濕、封閉且不可預測的空間中工作。這些任務既具有商業性緊迫性,又需要營運數據來改善實體人工智慧模型。人手不足不僅限於工廠運營,物流、醫療保健支援、建築和現場作業等行業也依賴工人執行各種體力勞動。在這些環境中,能夠適應佈局和物件變化的系統可能比固定的自動化系統更有用。勞動力需求未得到滿足與技術進步的這種契合,提升了可在現場安全運行的可操作解決方案的價值。
實施成本高,上運作。
物理人工智慧生態系統市場面臨短期限制,因為實施成本遠不止於購買機器人本身。整合服務、軟體客製化、安全檢查、操作員培訓和工作流程變更都會顯著增加初始預算。在複雜的製造項目中,如果系統需要根據模擬中未反映的運作條件進行調整,則初始計畫可能會延長 12 至 18 個月。中小企業尤其容易受到這種風險的影響,因為它們可能缺乏整合經驗和足夠的財力來應對專案預算超支。此外,漫長的試運行週期會延遲供應商取得最佳化機器人行為所需的運行數據。因此,能夠簡化設定、擴展服務範圍並減少現場特定工程工作的商業模式具有顯著優勢。
細分市場分析
預計到2025年,物理人工智慧生態系統市場中,硬體將佔據71.08%的市場。這是因為每個實體系統都需要感測器、執行器、機械手臂、處理器和電源。工業機器人和移動平台仍然是資本密集產業,硬體材料清單(BOM)佔專案支出的大部分。可靠性、承重能力、操作精度、運作和環境相容性仍然是硬體主導的考慮因素。這些要求使得平台選擇成為部署決策的核心,並維繫原始設備製造商(OEM)、整合商和最終用戶之間的關係。實體人工智慧生態系統市場需要能夠在整個運作生命週期內進行維護、支援和升級的設備來支援。
預計到2031年,軟體市場將以16.32%的複合年成長率成長,成為各組成部分中成長速度最快的。通用基礎模型、車隊編配工具、模擬環境和數位孿生平台可以作為獨立的收入來源進行銷售,而無需作為機器人內建的功能。在2026年的GTC大會上,NVIDIA宣布提前向市場提供GR00T N1.7的商業版本,顯示該公司正致力於將定位模型軟體作為獨立的商業層進行銷售。服務仍然至關重要,因為由多家原始設備製造商(OEM)運營的車隊需要試運行、培訓、最佳化和持續支援。 ISO/IEC TR 5469:2024標準的製定進一步增加了對人工智慧功能安全評估及相關專業服務的需求。
預計到2025年,工業機器人將佔物理人工智慧生態系統市場規模的44.59%。這一主導地位得益於其在汽車、電子和金屬製造等行業的卓越表現,這些行業多年來已證實其運作可靠且可重複。根據國際機器人聯合會(IFR)的數據,到2024年,全球工業機器人部署數量將達到54.2萬台,是10年前的兩倍多。亞洲佔新增部署量的74%,其中中國部署了29.5萬台,使全球運作的機器人總數達到466.4萬台。這項部署規模為在工業平台上添加人工智慧功能奠定了堅實的基礎。
預計到2031年,個人和家用服務機器人將以17.04%的複合年成長率成長。在消費環境中,與人、物體、佈局和不斷變化的情況的各種互動,為模型開發提供了豐富的數據。商用服務機器人也被應用於外科手術、檢測、物流和現場作業等領域,人工智慧的引入有望進一步提升其操作柔軟性。 1X Technologies已在其位於加州海沃德的NEO工廠開始生產,並計劃從2026年開始,面向消費者市場,初始年產能為1萬台。 FANUC報告稱,自2025年12月產品發布以來,已交付超過1,000台用於實體人工智慧相關應用的機器人。
區域分析
到2025年,北美將佔據實體人工智慧生態系統市場佔有率的35.47%。該地區聚集了許多人工智慧原生機器人公司,其市場格局正受到企業雄厚投資能力以及生產回流活動的影響,這些因素共同推動了生產設施柔軟性需求的成長。美國機器人部署數量在經歷了兩年下滑後於2025年回升,食品生產、倉儲和物流行業是推動這項復甦的主要動力。截至2024年,北美每1萬名製造業員工擁有204台機器人。這一數字低於西歐的267台和韓國的1,220台,顯示北美自動化密度仍有提升空間。
預計到2031年,亞太地區將以18.76%的複合年成長率成長,成為物理人工智慧生態系統市場所有區域中成長最快的地區。中國是該地區的工業機器人中心,預計2024年部署量將達到29.5萬台,國內製造商佔據國內機器人市場57%的佔有率。日本和韓國正透過其國內實體人工智慧計畫進一步增強這一優勢。韓國已將實體人工智慧列為其「K-Moonshot」計畫的關鍵任務之一,該計畫於2026年2月啟動。韓國已在韓國科學技術院(KAIST)為汽車、精密製造和造船業推出了國內實體人工智慧整合平台。印度與中國在亞太地區的工業機器人市場形成互補,預計2024年部署量將達到9,100台,並透過與生產激勵計畫相關的製造自動化投資吸引了大量資金。
預計到2025年,歐洲將在區域內排名第二,這得益於其成熟的部署基礎、信譽良好的自動化供應商,以及西歐每萬名製造業工人擁有267台機器人的機器人密度。 2024年,德國佔歐洲年度機器人部署量的32%,但由於當年汽車產業的低迷,歐洲整體部署量下降了8%。歐盟的《機械法規》和《網路彈性法》正在影響互聯機器人的採購要求。雖然機器人技術在中東的建築、能源和物流領域發展迅速,但非洲和南美洲仍處於起步階段,主要集中在採礦和農業領域。
其他好處:
- Excel格式的市場預測(ME)表
- 3個月的分析師支持
目錄
第1章:引言
- 研究假設和市場定義
- 調查範圍
第2章:調查方法
第3章執行摘要
第4章 市場狀況
- 市場概覽
- 市場促進因素
- 用於即時自動駕駛的低延遲邊緣推理
- 非例行體力勞動者短缺
- 物流和製造業的彈性自動化
- 從模擬到真實環境的數位孿生流程
- 獨特的真實世界行為數據的複合效應
- 主權和安全關鍵型自動駕駛計劃
- 市場限制因素
- 高昂的整合成本和漫長的試運行週期
- 認證、責任和功能安全的複雜性
- 缺乏長尾物理互動數據
- 行動裝置中的能源、熱和電池限制
- 產業價值鏈分析
- 監理情勢
- 技術展望
- 波特五力分析
第5章 市場規模與成長預測
- 按組件
- 硬體
- 軟體
- 服務
- 機器人類型和形式
- 工業機器人
- 商用服務機器人
- 個人與家庭服務機器人
- 其他機器人類型和形式
- 不同的發展
- 裝置端
- 基於雲端的
- 混合
- 按最終用戶行業分類
- 物流和供應鏈
- 製造業
- 衛生保健
- 汽車與出行
- 國防與安全
- 建築、採礦、能源
- 其他終端用戶產業
- 按地區
- 北美洲
- 美國
- 加拿大
- 墨西哥
- 南美洲
- 巴西
- 阿根廷
- 其他南美國家
- 歐洲
- 德國
- 英國
- 法國
- 義大利
- 西班牙
- 俄羅斯
- 其他歐洲國家
- 亞太地區
- 中國
- 日本
- 韓國
- 印度
- 澳洲
- 其他亞太國家
- 中東
- 沙烏地阿拉伯
- 阿拉伯聯合大公國
- 土耳其
- 以色列
- 其他中東國家
- 非洲
- 南非
- 埃及
- 其他非洲國家
- 北美洲
第6章 競爭情勢
- 市場集中度
- 策略趨勢
- 市佔率分析
- 公司簡介
- NVIDIA Corporation
- ABB Ltd
- KUKA AG
- Boston Dynamics, Inc.
- Tesla, Inc.
- FANUC Corporation
- YASKAWA Electric Corporation
- Agility Robotics, Inc.
- Figure AI, Inc.
- NEURA Robotics GmbH
- Universal Robots A/S
- Teradyne, Inc.
- OMRON Corporation
- Siemens AG
- Hyundai Motor Company
- SoftBank Robotics Group Corp.
- Physical Intelligence, Inc.
- Covariant, Inc.
- Dexterity, Inc.
- Apptronik, Inc.
- 1X Technologies AS
- Sanctuary Cognitive Systems Corporation
- Skild AI, Inc.
- Google DeepMind
第7章 市場機會與未來展望
According to Mordor Intelligence, the physical AI ecosystem market size is projected to expand from USD 22.58 billion in 2025 and USD 26.06 billion in 2026 to USD 51.47 billion by 2031, registering a CAGR of 14.58% between 2026 to 2031.
This report is Segmented by Component (Hardware, Software, and Services), Robot Type and Embodiment (Industrial Robots, Professional Service Robots, Personal and Household Service Robots, and More), Deployment (On-Device, Cloud-Based, and Hybrid), End-User Vertical (Logistics and Supply Chain, Manufacturing, Healthcare, and More), and Geography. The Market Forecasts are Provided in Terms of Value (USD).
Global Physical AI Ecosystem Market Trends and Insights
Low-Latency Edge Inference for Real-Time Autonomy
The physical AI ecosystem market requires fast local decisions when robots operate near people, equipment, or moving materials. A remote cloud connection can introduce delays that are unsuitable for an automotive line, a hospital corridor, or a mobile machine in a busy warehouse. NVIDIA made its Blackwell-powered Jetson Thor generally available in August 2025, with up to 2,070 FP4 teraflops of AI compute in a 130-watt power envelope and a USD 3,499 developer kit price. The company reported 7.5 times higher AI compute and 3.5 times greater energy efficiency than its predecessor. These specifications make edge inference a core design choice for equipment that must respond within a tight operational window. Suppliers without robot-focused inference stacks may therefore face a narrower opportunity to remain relevant in physical AI deployments.
Labor Scarcity in Unstructured Physical Work
Labor constraints support demand in the physical AI ecosystem market because many difficult jobs take place in settings that conventional automation does not handle well. The remaining gaps include picking nonuniform parcels, managing variation across mixed-product lines, and working in wet, confined, or unpredictable spaces. These tasks combine commercial urgency with the type of operating data needed to improve physical AI models. The shortage is not limited to factory roles, as logistics, healthcare support, construction, and field operations also depend on workers to perform varied physical tasks. A system that can adjust to changing layouts or objects can be more useful than fixed automation in these settings. This alignment between unmet labor needs and technical progress increases the value of practical deployments that can be operated safely at the site level.
High Integration Cost and Long Commissioning Cycles
The physical AI ecosystem market faces a near-term constraint because deployment costs extend beyond the robot purchase. Integration services, software customization, safety checks, operator training, and workflow changes can add materially to the initial budget. Complex manufacturing projects can require 12 to 18 months beyond original timelines when systems must be tuned to operating conditions not reflected in simulation. Small and midsize enterprises are particularly exposed because they may lack the integration experience and financial capacity to absorb project overruns. Long commissioning cycles also delay the availability of the operating data that vendors need to refine robot behavior. Commercial models that simplify setup, improve service coverage, or reduce site-specific engineering can therefore have a meaningful advantage.
Other drivers and restraints analyzed in the detailed report include:
- Flexible Automation in Logistics and Manufacturing
- Sim-to-Real Digital Twin Pipelines
- Certification, Liability, and Functional Safety Complexity
For complete list of drivers and restraints, kindly check the Table Of Contents.
Segment Analysis
Hardware accounted for 71.08% of the physical AI ecosystem market share in 2025 because every embodied system requires sensors, actuators, manipulators, processors, and power equipment. Industrial robots and mobile platforms remain capital-intensive, so the hardware bill of materials accounts for much of project spending. Reliability, payload, motion precision, operating duration, and environmental fit remain hardware-led considerations. These requirements make platform selection central to deployment decisions and sustain relationships between OEMs, integrators, and end users. The physical AI ecosystem market remains anchored in equipment that can be serviced, supported, and adapted over its operating life.
Software is projected to grow at a 16.32% CAGR through 2031, the highest rate among components. World foundation models, fleet orchestration tools, simulation environments, and digital twin platforms can be sold as separate revenue layers rather than embedded robot features. NVIDIA introduced GR00T N1.7 in early commercial access at GTC 2026, indicating a move toward model software as a distinct commercial layer. Services also remain important because multi-OEM fleets need commissioning, training, optimization, and continuing support. ISO/IEC TR 5469:2024 creates an additional need for AI functional safety evaluation and related specialist services.
Industrial robots accounted for 44.59% of the physical AI ecosystem market size in 2025. Their lead reflects proven use in automotive, electronics, and metals production, where reliability and repeatable motion have been demonstrated over time. The International Federation of Robotics recorded 542,000 global industrial robot installations in 2024, more than twice the level of 10 years earlier. Asia accounted for 74% of new installations, while China installed 295,000 units, and global operational stock reached 4,664,000 units. This installed base gives industrial platforms a practical foundation for adding AI capabilities.
Personal and household service robots are expected to grow at a 17.04% CAGR through 2031. Consumer settings create varied interactions with people, objects, layouts, and changing conditions that can provide broad data for model development. Professional service robots also support surgery, inspection, logistics, and field applications, where AI can extend task flexibility. 1X Technologies began production at its NEO Factory in Hayward, California, with an initial annual capacity of 10,000 units intended for home users from 2026. FANUC reported that it had shipped more than 1,000 robots for physical AI-related applications after its December 2025 product launch.
Complete Report Scope:
- By Component
- Hardware
- Software
- Services
- By Robot Type and Embodiment
- Industrial Robots
- Professional Service Robots
- Personal and Household Service Robots
- Other Robot Type and Embodiments
- By Deployment
- On-Device
- Cloud-Based
- Hybrid
- By End-User Vertical
- Logistics and Supply Chain
- Manufacturing
- Healthcare
- Automotive and Mobility
- Defense and Security
- Construction, Mining, and Energy
- Other End-User Verticals
- By Geography
- North America
- United States
- Canada
- Mexico
- South America
- Brazil
- Argentina
- Rest of South America
- Europe
- Germany
- United Kingdom
- France
- Italy
- Spain
- Russia
- Rest of Europe
- Asia-Pacific
- China
- Japan
- South Korea
- India
- Australia
- Rest of Asia-Pacific
- Middle East
- Saudi Arabia
- United Arab Emirates
- Turkey
- Israel
- Rest of Middle East
- Africa
- South Africa
- Egypt
- Rest of Africa
- North America
Geography Analysis
North America accounted for 35.47% of the physical AI ecosystem market share in 2025. The region combines AI-native robotics firms, substantial corporate investment capacity, and reshoring activity that is increasing the need for flexible production equipment. U.S. robot installations rebounded in 2025 after 2 years of declines, with food production, warehousing, and logistics supporting the recovery. North America had 204 robots per 10,000 manufacturing employees in 2024. This was below Western Europe's 267 and South Korea's 1,220, leaving scope for higher automation density.
Asia-Pacific is projected to expand at an 18.76% CAGR through 2031, the fastest geographic rate in the physical AI ecosystem market. China is the region's central industrial robot base, with 295,000 installations in 2024 and domestic manufacturers holding 57% of its domestic robot market. Japan and South Korea are extending this strength through domestic physical AI programs, and South Korea designated physical AI as a key K-Moonshot mission in February 2026. South Korea deployed a domestic Physical AI Integrated Platform at KAIST for automobiles, precision manufacturing, and shipbuilding. India complements China in the regional industrial robot landscape, recording 9,100 installations in 2024 and drawing manufacturing automation investment linked to production incentive programs.
Europe held the second-largest regional position in 2025, supported by a deep installed base, established automation suppliers, and Western European robot density of 267 per 10,000 manufacturing employees. Germany accounted for 32% of Europe's annual robot installations in 2024, although regional installations declined by 8% that year amid weakening automotive conditions. The European Union's Machinery Regulation and Cyber Resilience Act are shaping procurement requirements for connected robots. The Middle East is advancing robotics in construction, energy, and logistics, while Africa and South America remain early-stage regions focused on mining and agriculture.
- NVIDIA Corporation
- ABB Ltd
- KUKA AG
- Boston Dynamics, Inc.
- Tesla, Inc.
- FANUC Corporation
- YASKAWA Electric Corporation
- Agility Robotics, Inc.
- Figure AI, Inc.
- NEURA Robotics GmbH
- Universal Robots A/S
- Teradyne, Inc.
- OMRON Corporation
- Siemens AG
- Hyundai Motor Company
- SoftBank Robotics Group Corp.
- Physical Intelligence, Inc.
- Covariant, Inc.
- Dexterity, Inc.
- Apptronik, Inc.
- 1X Technologies AS
- Sanctuary Cognitive Systems Corporation
- Skild AI, Inc.
- Google DeepMind
Additional Benefits:
- The market estimate (ME) sheet in Excel format
- 3 months of analyst support
TABLE OF CONTENTS
1 INTRODUCTION
- 1.1 Study Assumptions and Market Definition
- 1.2 Scope of the Study
2 RESEARCH METHODOLOGY
3 EXECUTIVE SUMMARY
4 MARKET LANDSCAPE
- 4.1 Market Overview
- 4.2 Market Drivers
- 4.2.1 Low-Latency Edge Inference for Real-Time Autonomy
- 4.2.2 Labor Scarcity in Unstructured Physical Work
- 4.2.3 Flexible Automation in Logistics and Manufacturing
- 4.2.4 Sim-to-Real Digital Twin Pipelines
- 4.2.5 Proprietary Real-World Action Data Compounding
- 4.2.6 Sovereign and Safety-Critical Autonomy Programs
- 4.3 Market Restraints
- 4.3.1 High Integration Cost and Long Commissioning Cycles
- 4.3.2 Certification, Liability, and Functional Safety Complexity
- 4.3.3 Scarcity of Long-Tail Physical Interaction Data
- 4.3.4 Energy, Thermal, and Battery Constraints in Mobile Embodiments
- 4.4 Industry Value-Chain Analysis
- 4.5 Regulatory Landscape
- 4.6 Technological Outlook
- 4.7 Porter's Five Forces Analysis
- 4.7.1 Bargaining Power of Suppliers
- 4.7.2 Bargaining Power of Buyers
- 4.7.3 Threat of New Entrants
- 4.7.4 Threat of Substitutes
- 4.7.5 Rivalry Among Existing Competitors
5 MARKET SIZE AND GROWTH FORECASTS (VALUE)
- 5.1 By Component
- 5.1.1 Hardware
- 5.1.2 Software
- 5.1.3 Services
- 5.2 By Robot Type and Embodiment
- 5.2.1 Industrial Robots
- 5.2.2 Professional Service Robots
- 5.2.3 Personal and Household Service Robots
- 5.2.4 Other Robot Type and Embodiments
- 5.3 By Deployment
- 5.3.1 On-Device
- 5.3.2 Cloud-Based
- 5.3.3 Hybrid
- 5.4 By End-User Vertical
- 5.4.1 Logistics and Supply Chain
- 5.4.2 Manufacturing
- 5.4.3 Healthcare
- 5.4.4 Automotive and Mobility
- 5.4.5 Defense and Security
- 5.4.6 Construction, Mining, and Energy
- 5.4.7 Other End-User Verticals
- 5.5 By Geography
- 5.5.1 North America
- 5.5.1.1 United States
- 5.5.1.2 Canada
- 5.5.1.3 Mexico
- 5.5.2 South America
- 5.5.2.1 Brazil
- 5.5.2.2 Argentina
- 5.5.2.3 Rest of South America
- 5.5.3 Europe
- 5.5.3.1 Germany
- 5.5.3.2 United Kingdom
- 5.5.3.3 France
- 5.5.3.4 Italy
- 5.5.3.5 Spain
- 5.5.3.6 Russia
- 5.5.3.7 Rest of Europe
- 5.5.4 Asia-Pacific
- 5.5.4.1 China
- 5.5.4.2 Japan
- 5.5.4.3 South Korea
- 5.5.4.4 India
- 5.5.4.5 Australia
- 5.5.4.6 Rest of Asia-Pacific
- 5.5.5 Middle East
- 5.5.5.1 Saudi Arabia
- 5.5.5.2 United Arab Emirates
- 5.5.5.3 Turkey
- 5.5.5.4 Israel
- 5.5.5.5 Rest of Middle East
- 5.5.6 Africa
- 5.5.6.1 South Africa
- 5.5.6.2 Egypt
- 5.5.6.3 Rest of Africa
- 5.5.1 North America
6 COMPETITIVE LANDSCAPE
- 6.1 Market Concentration
- 6.2 Strategic Moves
- 6.3 Market Share Analysis
- 6.4 Company Profiles (includes Global Level Overview, Market Level Overview, Core Segments, Financials as available, Strategic Information, Market Rank/Share, Products and Services, Recent Developments)
- 6.4.1 NVIDIA Corporation
- 6.4.2 ABB Ltd
- 6.4.3 KUKA AG
- 6.4.4 Boston Dynamics, Inc.
- 6.4.5 Tesla, Inc.
- 6.4.6 FANUC Corporation
- 6.4.7 YASKAWA Electric Corporation
- 6.4.8 Agility Robotics, Inc.
- 6.4.9 Figure AI, Inc.
- 6.4.10 NEURA Robotics GmbH
- 6.4.11 Universal Robots A/S
- 6.4.12 Teradyne, Inc.
- 6.4.13 OMRON Corporation
- 6.4.14 Siemens AG
- 6.4.15 Hyundai Motor Company
- 6.4.16 SoftBank Robotics Group Corp.
- 6.4.17 Physical Intelligence, Inc.
- 6.4.18 Covariant, Inc.
- 6.4.19 Dexterity, Inc.
- 6.4.20 Apptronik, Inc.
- 6.4.21 1X Technologies AS
- 6.4.22 Sanctuary Cognitive Systems Corporation
- 6.4.23 Skild AI, Inc.
- 6.4.24 Google DeepMind
7 MARKET OPPORTUNITIES AND FUTURE OUTLOOK
- 7.1 White-Space and Unmet-Need Assessment

 實體人工智慧平台:市場佔有率分析、產業趨勢與統計、成長預測(2026-2031)
 實體人工智慧:機器人平台模式的發展趨勢以及半導體和雲端供應商的策略考量
 實體人工智慧市場:按技術、基礎設施、應用和產業分類(2026-2032 年)物理人工智慧:市場佔有率分析、行業趨勢和統計數據、成長預測(2026-2031)
 全球物理人工智慧市場(2027-2040 年)全球實體人工智慧市場:按組件、載體、技術、自主等級、應用和最終用戶分類-市場規模、產業動態、機會分析和預測(2026-2035 年)
 全球實體人工智慧市場(至2032年):按產品、機器人類型、自主等級、產業和地區分類
 2026-2030年全球實體人工智慧和機器人即服務(RaaS)市場
 實體人工智慧市場規模、佔有率和趨勢分析報告:按組件、技術、應用、地區和細分市場預測(2026-2033 年)