


 |
市場調查報告書
商品編碼
2119122
身臨其境型行銷服務:市場佔有率分析、產業趨勢與統計、成長預測(2026-2031)Immersive Marketing Services - Market Share Analysis, Industry Trends & Statistics, Growth Forecasts (2026 - 2031) |
||||||

※ 本網頁內容可能與最新版本有所差異。詳細情況請與我們聯繫。
根據 Mordor Intelligence 預測,身臨其境型行銷服務市場規模將從 2025 年的 38.7 億美元和 2026 年的 46.2 億美元成長到 2031 年的 112.8 億美元,2026 年至 2031 年的複合年成長率為 19.55%。
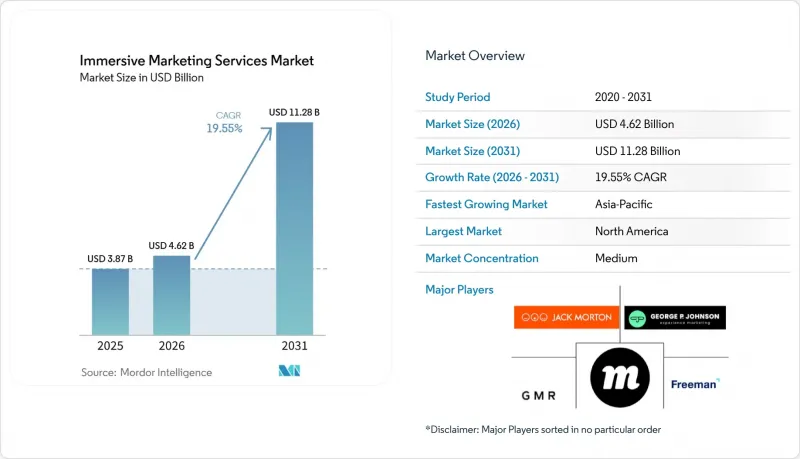
本報告按應用領域(虛擬商務和試穿體驗、產品發布和演示、社交媒體和創作者宣傳活動等)、終端用戶行業(零售和電子商務、汽車、媒體和娛樂、旅遊和酒店、房地產、醫療保健、體育和健身等)以及地區進行細分。市場預測以價值(美元)表示。
全球身臨其境型行銷服務市場趨勢與洞察
對參與式品牌互動日益成長的需求
隨著廣告主尋求更積極主動的品牌互動,身臨其境型行銷服務市場正從中受益。 SugarXR 的報告顯示,包含 AR 和 3D 內容的產品轉換率比不包含這些內容的產品高出 94%,而且 AR 互動時長是影片互動時長的四倍。 IAB 的一份報告指出,41% 的美國廣告買家預計將在 2026 年增加其在面對面和體驗式廣告方面的支出。 Kantar 預測,贊助活動將成為 2025 年成長最快的付費管道,並指出 22% 的行銷人員正在將預算分配轉向這一領域。此外,參與式方法使品牌能夠在用戶互動瞬間收集第一方行為訊號,隨著第三方訊號在瀏覽器和行動環境中的減少,這種能力將變得越來越重要。
品牌預算向體驗式和互動式媒體轉移
身臨其境型行銷服務市場也受惠於媒體策劃方式的持續轉變。 IAB 的研究表明,人們對線下和體驗式行銷形式的興趣持續成長,41% 的美國廣告買家計劃在 2026 年增加支出。 Kantar 的報告顯示,2025 年全球付費管道的成長主要得益於賽事贊助。預計 2026 年 FIFA 世界盃和冬季奧運會將進一步推動主要市場的贊助活動。買家正在尋求能夠結合現場參與、數位內容和可衡量的受眾回饋的行銷形式。這推動了身臨其境型行銷服務市場對能夠提供協調一致的宣傳活動而非孤立活動的代理商和技術提供者的需求。
生產成本高且整合複雜。
身臨其境型行銷服務市場仍需大量前期投資才能實施全面專案。客製化的WebXR環境、數位孿生以及實體與數位融合的行銷活動都需要專業的製作和技術資源。 2025年10月,億滋國際(Mondelez)投資4,000萬美元打造人工智慧行銷內容平台,旨在將廣告製作成本降低30%至50%。擴增實境(AR)試穿專案也需要與電商平台、客戶關係管理(CRM)系統和分析工具整合。據微軟稱,聯合利華(Unilever)利用數位孿生工作流程,將內容創作時間從數月縮短至數天,並將成本降低了50%。身臨其境型行銷服務市場中的許多中型品牌尚未建立大規模部署這些工作流程所需的內部基礎設施。
細分市場分析
到2025年,廣告和品牌推廣將佔身臨其境型行銷服務市場的31.64%。這個市場定位反映了結合線下活動、數位媒體和店內活動的宣傳活動已確立的地位。在汽車、消費性電子和奢侈品行業,產品發布和演示仍然至關重要,而虛擬漫遊可以增強產品發布效果和相關媒體報告。由於Snap Lens Studio和TikTok Effect House提供的低成本AR工具,社群媒體和創作者宣傳活動正在蓬勃發展。這些工具使創作者和代理商能夠比傳統製作模式更快地設計和分發特效。
預計到2031年,虛擬商務和試穿體驗將以23.07%的複合年成長率成長。 Genlook的研究顯示,到2026年第二季度,使用試穿工具的顧客將商品加入購物車的比例是其他顧客的3.1倍。這使得虛擬商務模式距離成為零售商的直接收入來源又更近了一步。如果品牌能夠將宣傳活動活動與轉換率和退貨率的降低聯繫起來,身臨其境型行銷服務產業將從中受益。人工智慧驅動的2D轉3D轉換技術能夠利用標準照片創建產品模型,從而減少了先前限制中小型品牌的素材創建難度。
區域分析
到2025年,北美將佔據身臨其境型行銷服務市場38.42%的佔有率。該地區匯聚了知名品牌廣告商、專注於科技的廣告公司,以及習慣AR社群電商和遊戲的消費者。美國是主要的國內市場,這得益於其聯合舉辦世界盃、贊助冬季奧運以及2026年與選舉相關的行銷活動支出。 IAB的研究顯示,41%的美國採購負責人預計將增加體驗式行銷方面的支出,顯示消費品、科技、金融服務和零售等產業均有需求。加拿大則透過遊戲、娛樂和D2C(直接面對消費者)零售做出貢獻,而墨西哥則受益於智慧型手機的普及和世界盃帶來的發展勢頭。
預計亞太地區將成為所有地區中複合年成長率最高的地區,2026年至2031年的複合年成長率將達到23.31%。在中國,阿里巴巴旗下的淘寶和網路存取以及虛擬試穿服務較低的普及率。此外,印度的《數位個人資料保護法》正在影響身臨其境型行銷服務市場中生物識別和眼動追蹤資料的處理方式。
到2026年,歐洲將佔全球整體體驗式行銷支出的26%,其中英國、德國和法國將引領這一趨勢。英國的廣告代理商基礎和蓬勃發展的奢侈品零售業,以及德國的展覽文化,都為高品質的擴增實境(AR)計畫和基於數位孿生技術的展覽提供了強力的支持。法國和西班牙的重要性也日益提升,傑克莫頓(Jack Morton)將於2026年3月在巴塞隆納開設伊比利亞半島辦事處。南美洲、中東和非洲雖然市場規模相對較小,但透過體育、旅遊、行動網路存取以及D2C(直接面對消費者)零售模式的發展,蘊藏著巨大的長期發展機會。
其他好處:
- Excel格式的市場預測(ME)表
- 3個月的分析師支持
目錄
第1章:引言
- 研究假設和市場定義
- 調查範圍
第2章:調查方法
第3章執行摘要
第4章 市場狀況
- 市場概覽
- 市場促進因素
- 對參與式品牌互動日益成長的需求
- 品牌預算向體驗式和互動式媒體轉移
- AR技術在商業和虛擬試穿中的普及
- 社交平臺和創作工具正使身臨其境型宣傳活動變得越來越普遍。
- 商業、媒體和遊戲平台正在探索新的身臨其境型廣告機會。
- 生成式人工智慧和數位孿生技術降低了3D內容的成本。
- 市場限制因素
- 生產成本高且整合複雜。
- 衡量投資報酬率的標準尚不成熟。
- 與生物識別和眼動追蹤相關的合規風險
- WebAR和WebXR部署中瀏覽器和設備的碎片化問題
- 產業價值鏈分析
- 監理情勢
- 技術展望
- 宏觀經濟因素對市場的影響
- 波特五力分析
第5章 市場規模與成長預測
- 透過使用
- 廣告和品牌推廣
- 產品發布及展示
- 社群媒體和創作者宣傳活動
- 虛擬商務與試穿體驗
- 按最終用途行業分類
- 零售與電子商務
- 車
- 媒體與娛樂
- 旅遊與飯店
- 房地產
- 衛生保健
- 教育
- BFSI
- 運動與健身
- 按地區
- 北美洲
- 美國
- 加拿大
- 墨西哥
- 南美洲
- 巴西
- 阿根廷
- 智利
- 其他南美國家
- 歐洲
- 德國
- 英國
- 法國
- 義大利
- 西班牙
- 俄羅斯
- 其他歐洲國家
- 亞太地區
- 中國
- 日本
- 印度
- 韓國
- 澳洲
- 新加坡
- 印尼
- 其他亞太國家
- 中東
- 阿拉伯聯合大公國
- 沙烏地阿拉伯
- 土耳其
- 卡達
- 其他中東國家
- 非洲
- 南非
- 埃及
- 奈及利亞
- 肯亞
- 其他非洲國家
- 北美洲
第6章 競爭情勢
- 市場集中度
- 策略趨勢
- 市佔率分析
- 公司簡介
- Jack Morton Worldwide, Inc.
- GMR Marketing, LLC
- NEXT/NOW LLC
- Sector 5 Digital, LLC
- Freeman Company, LLC
- Groove Jones LLC
- Rock Paper Reality
- BRC Imagination Arts, Inc.
- Momentum Worldwide
- George P. Johnson Experience Marketing
- ASTOUND Group
- Verve The Live Agency
- Opus Agency
- DEEPlocal Inc.
- Amplify
- 2Heads
- Collaborate Global
- Spiro
- 160over90 LLC
- Auditoire
第7章 市場機會與未來展望
According to Mordor Intelligence, the immersive marketing services market size is projected to expand from USD 3.87 billion in 2025 and USD 4.62 billion in 2026 to USD 11.28 billion by 2031, registering a CAGR of 19.55% between 2026 to 2031.
This report is Segmented by Application (Virtual Commerce and Try-On Experiences, Product Launches and Demonstrations, Social Media and Creator Campaign, and More), End-Use Industry (Retail and E-Commerce, Automotive, Media and Entertainment, Travel and Hospitality, Real Estate, Healthcare, Sports and Fitness, and More), and Geography. The Market Forecasts are Provided in Terms of Value (USD).
Global Immersive Marketing Services Market Trends and Insights
Rising Demand for Participatory Brand Engagement
The immersive marketing services market is benefiting as advertisers seek active forms of brand engagement. SugarXR reported that products with AR or 3D content converted 94% higher than products without it, while average AR dwell time was 4x longer than video engagement. The IAB reported that 41% of U.S. advertising buyers expected to increase in-person and experiential spending in 2026. Kantar identified sponsored events as the fastest-growing paid channel in 2025, with a net 22% of marketers shifting budget allocation toward them. Participation also allows brands to collect first-party behavioral signals at the moment of interaction. That capability becomes more valuable as third-party signals decline across browsers and mobile environments.
Brand Budget Shift Toward Experiential and Interactive Media
The immersive marketing services market is also supported by a more durable shift in media planning. The IAB documented continued interest in in-person and experiential formats, with 41% of U.S. buyers planning higher spending during 2026. Kantar reported that event sponsorships led paid-channel growth globally in 2025. The 2026 FIFA World Cup and Winter Olympics are supporting additional sponsorship activation across major markets. Buyers are seeking formats that combine live participation, digital content, and measurable audience response. This creates more demand in the immersive marketing services market for agencies and technology providers that can deliver connected campaigns rather than isolated events.
High Production Costs and Integration Complexity
The immersive marketing services market still requires substantial upfront spending for full-scale projects. Custom WebXR environments, digital twins, and physical-digital activations need specialized production and technical resources. Mondelez invested USD 40 million in an AI marketing content platform in October 2025 and targeted advertising production cost reductions of 30-50%. AR try-on programs also need connections to commerce platforms, CRM systems, and analytics tools. Microsoft reported that Unilever used digital-twin workflows to reduce content-production timelines from months to days and costs by 50%. Many mid-market brands in the immersive marketing services market do not yet have the internal capability to deploy these workflows at scale.
Other drivers and restraints analyzed in the detailed report include:
- AR-Enabled Commerce and Virtual Try-On Adoption
- Social Platforms and Creator Tools Normalize Immersive Campaigns
- ROI Measurement Standards Remain Immature
For complete list of drivers and restraints, kindly check the Table Of Contents.
Segment Analysis
Advertising and branding held 31.64% of the immersive marketing services market size in 2025. Its position reflects an established role in campaigns that combine physical events, digital media, and in-store activity. Product launches and demonstrations remain important in automotive, consumer electronics, and luxury goods, where virtual walk-arounds can extend product reveals and related media coverage. Social media and creator campaigns have expanded with lower-cost AR tools from Snap Lens Studio and TikTok Effect House. These tools let creators and agencies design and distribute effects more quickly than earlier production models.
Virtual commerce and try-on experiences are projected to expand at a CAGR of 23.07% through 2031. Genlook recorded a 3.1x add-to-cart difference for sessions that used try-on tools in the second quarter of 2026. This has moved the format closer to a direct revenue tool for retailers. The immersive marketing services industry benefits when brands can connect campaign activity to conversion and return reduction. AI-powered 2D-to-3D conversion can create product models from standard photography, reducing an asset-production constraint that previously limited use among smaller brands.
Complete Report Scope:
- By Application
- Advertising and Branding
- Product Launches and Demonstrations
- Social Media and Creator Campaigns
- Virtual Commerce and Try-On Experiences
- By End-use Industry
- Retail and E-commerce
- Automotive
- Media and Entertainment
- Travel and Hospitality
- Real Estate
- Healthcare
- Education
- BFSI
- Sports and Fitness
- By Geography
- North America
- United States
- Canada
- Mexico
- South America
- Brazil
- Argentina
- Chile
- Rest of South America
- Europe
- Germany
- United Kingdom
- France
- Italy
- Spain
- Russia
- Rest of Europe
- Asia-Pacific
- China
- Japan
- India
- South Korea
- Australia
- Singapore
- Indonesia
- Rest of Asia-Pacific
- Middle East
- United Arab Emirates
- Saudi Arabia
- Turkey
- Qatar
- Rest of Middle East
- Africa
- South Africa
- Egypt
- Nigeria
- Kenya
- Rest of Africa
- North America
Geography Analysis
North America held 38.42% of the immersive marketing services market in 2025. The region combines large brand advertisers, technology-focused agencies, and consumers familiar with AR social commerce and gaming. The United States is the main national market, supported by World Cup co-hosting, Winter Olympics sponsorships, and election-related activation spending in 2026. The IAB finding that 41% of U.S. buyers expected to increase experiential spending indicates demand across consumer goods, technology, financial services, and retail. Canada contributes through gaming, entertainment, and direct-to-consumer retail, while Mexico benefits from smartphone adoption and World Cup momentum.
Asia-Pacific is projected to record the fastest regional CAGR at 23.31% from 2026 to 2031. China has a mature AR commerce base through Alibaba's Taobao and ByteDance's Douyin platforms. South Korea's broad 5G coverage supports low-latency WebXR and spatial-computing experiences. India is projected to post the highest national CAGR in Asia-Pacific, supported by a young consumer base, rising network access, and low virtual try-on penetration. India's Digital Personal Data Protection Act is also shaping the handling of biometric and gaze data in the immersive marketing services market.
Europe accounted for 26% of broader global experiential marketing spending in 2026, led by the United Kingdom, Germany, and France. The United Kingdom's agency base, luxury retail activity, and Germany's trade-fair culture support high-production AR programs and digital-twin-enabled exhibits. France and Spain are gaining importance, with Jack Morton opening an Iberia office in Barcelona in March 2026. South America, the Middle East, and Africa remain smaller but offer longer-term opportunities through sports, tourism, mobile internet access, and direct-to-consumer retail development.
- Jack Morton Worldwide, Inc.
- GMR Marketing, LLC
- NEXT/NOW LLC
- Sector 5 Digital, LLC
- Freeman Company, LLC
- Groove Jones LLC
- Rock Paper Reality
- BRC Imagination Arts, Inc.
- Momentum Worldwide
- George P. Johnson Experience Marketing
- ASTOUND Group
- Verve The Live Agency
- Opus Agency
- DEEPlocal Inc.
- Amplify
- 2Heads
- Collaborate Global
- Spiro
- 160over90 LLC
- Auditoire
Additional Benefits:
- The market estimate (ME) sheet in Excel format
- 3 months of analyst support
TABLE OF CONTENTS
1 INTRODUCTION
- 1.1 Study Assumptions and Market Definition
- 1.2 Scope of the Study
2 RESEARCH METHODOLOGY
3 EXECUTIVE SUMMARY
4 MARKET LANDSCAPE
- 4.1 Market Overview
- 4.2 Market Drivers
- 4.2.1 Rising Demand for Participatory Brand Engagement
- 4.2.2 Brand Budget Shift Toward Experiential and Interactive Media
- 4.2.3 AR-Enabled Commerce and Virtual Try-On Adoption
- 4.2.4 Social Platforms and Creator Tools Normalize Immersive Campaigns
- 4.2.5 Commerce Media and Gaming Platforms Open New Immersive Inventory
- 4.2.6 Generative AI and Digital Twins Reduce 3D Content Costs
- 4.3 Market Restraints
- 4.3.1 High Production Costs and Integration Complexity
- 4.3.2 ROI Measurement Standards Remain Immature
- 4.3.3 Biometric and Gaze-Tracking Compliance Risk
- 4.3.4 Browser and Device Fragmentation for WebAR and WebXR Deployment
- 4.4 Industry Value-Chain Analysis
- 4.5 Regulatory Landscape
- 4.6 Technological Outlook
- 4.7 Impact of Macroeconomic Factors on the Market
- 4.8 Porter's Five Forces Analysis
- 4.8.1 Threat of New Entrants
- 4.8.2 Bargaining Power of Buyers
- 4.8.3 Bargaining Power of Suppliers
- 4.8.4 Threat of Substitutes
- 4.8.5 Intensity of Competitive Rivalry
5 MARKET SIZE AND GROWTH FORECASTS (VALUE)
- 5.1 By Application
- 5.1.1 Advertising and Branding
- 5.1.2 Product Launches and Demonstrations
- 5.1.3 Social Media and Creator Campaigns
- 5.1.4 Virtual Commerce and Try-On Experiences
- 5.2 By End-use Industry
- 5.2.1 Retail and E-commerce
- 5.2.2 Automotive
- 5.2.3 Media and Entertainment
- 5.2.4 Travel and Hospitality
- 5.2.5 Real Estate
- 5.2.6 Healthcare
- 5.2.7 Education
- 5.2.8 BFSI
- 5.2.9 Sports and Fitness
- 5.3 By Geography
- 5.3.1 North America
- 5.3.1.1 United States
- 5.3.1.2 Canada
- 5.3.1.3 Mexico
- 5.3.2 South America
- 5.3.2.1 Brazil
- 5.3.2.2 Argentina
- 5.3.2.3 Chile
- 5.3.2.4 Rest of South America
- 5.3.3 Europe
- 5.3.3.1 Germany
- 5.3.3.2 United Kingdom
- 5.3.3.3 France
- 5.3.3.4 Italy
- 5.3.3.5 Spain
- 5.3.3.6 Russia
- 5.3.3.7 Rest of Europe
- 5.3.4 Asia-Pacific
- 5.3.4.1 China
- 5.3.4.2 Japan
- 5.3.4.3 India
- 5.3.4.4 South Korea
- 5.3.4.5 Australia
- 5.3.4.6 Singapore
- 5.3.4.7 Indonesia
- 5.3.4.8 Rest of Asia-Pacific
- 5.3.5 Middle East
- 5.3.5.1 United Arab Emirates
- 5.3.5.2 Saudi Arabia
- 5.3.5.3 Turkey
- 5.3.5.4 Qatar
- 5.3.5.5 Rest of Middle East
- 5.3.6 Africa
- 5.3.6.1 South Africa
- 5.3.6.2 Egypt
- 5.3.6.3 Nigeria
- 5.3.6.4 Kenya
- 5.3.6.5 Rest of Africa
- 5.3.1 North America
6 COMPETITIVE LANDSCAPE
- 6.1 Market Concentration
- 6.2 Strategic Moves
- 6.3 Market Share Analysis
- 6.4 Company Profiles (includes Global Level Overview, Market Level Overview, Core Segments, Financials as available, Strategic Information, Market Rank/Share, Products and Services, Recent Developments)
- 6.4.1 Jack Morton Worldwide, Inc.
- 6.4.2 GMR Marketing, LLC
- 6.4.3 NEXT/NOW LLC
- 6.4.4 Sector 5 Digital, LLC
- 6.4.5 Freeman Company, LLC
- 6.4.6 Groove Jones LLC
- 6.4.7 Rock Paper Reality
- 6.4.8 BRC Imagination Arts, Inc.
- 6.4.9 Momentum Worldwide
- 6.4.10 George P. Johnson Experience Marketing
- 6.4.11 ASTOUND Group
- 6.4.12 Verve The Live Agency
- 6.4.13 Opus Agency
- 6.4.14 DEEPlocal Inc.
- 6.4.15 Amplify
- 6.4.16 2Heads
- 6.4.17 Collaborate Global
- 6.4.18 Spiro
- 6.4.19 160over90 LLC
- 6.4.20 Auditoire
7 MARKET OPPORTUNITIES AND FUTURE OUTLOOK
- 7.1 White-space and unmet-need assessment

 數位行銷服務市場:按服務類型、公司規模、最終用戶和地區分類
 落地頁最佳化服務:市場佔有率分析、產業趨勢與統計、成長預測(2026-2031)需求創造服務:市場佔有率分析、產業趨勢與統計、成長預測(2026-2031 年)醫療保健行銷服務:市場佔有率分析、行業趨勢和統計數據、成長預測(2026-2031 年)貿易行銷服務:市場佔有率分析、產業趨勢與統計、成長預測(2026-2031)
 需求產生軟體市場:2026-2032年全球市場預測(依產品類型、定價模式、產業、部署模式及組織規模分類)數位行銷:市場佔有率分析、產業趨勢與統計、成長預測(2026-2031)數位公關服務:市場佔有率分析、產業趨勢與統計、成長預測(2026-2031)
 電子郵件送達率工具市場規模、佔有率和成長分析:按解決方案類型、部署方式、組織規模、最終用戶產業和地區分類-2026-2033 年產業預測
 2026-2030年全球交付和行銷電子郵件市場