


 |
市場調查報告書
商品編碼
2118063
磷強化有機肥料:市佔率分析、產業趨勢與統計及成長預測(2026-2031)Phosphorus Enriched Organic Manure - Market Share Analysis, Industry Trends & Statistics, Growth Forecasts (2026 - 2031) |
||||||

※ 本網頁內容可能與最新版本有所差異。詳細情況請與我們聯繫。
根據 Mordor Intelligence 預測,磷強化有機肥料的市場規模將從 2025 年的 23.5 億美元和 2026 年的 25.6 億美元成長到 2031 年的 40 億美元,2026 年至 2031 年的年複合成長率(CAGR)為 11.2%。
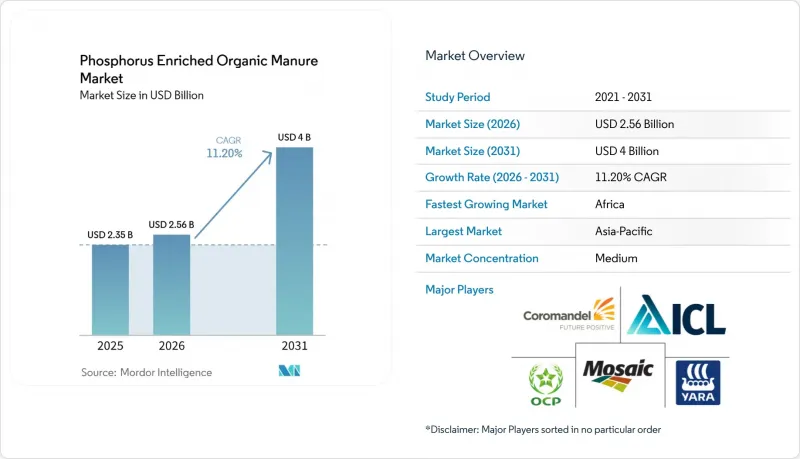
本報告按形態(顆粒狀、粉狀、液體狀)、原料(畜禽糞便、植物堆肥等)、應用(土壤改良等)、作物類型(穀物等)、分銷管道(直銷等)和地區(北美、南美等)進行分類。市場預測以美元計價。
全球磷強化有機肥市場趨勢及洞察
廣泛採用永續農業實踐
隨著以土壤有機質為優先的再生農業方法的推廣,富含磷的有機肥料已成為主流作物營養管理的核心。根據有機農業研究所的調查顯示,到2024年,將有9,890萬公頃土地獲得有機認證。在這一面積,合成過磷酸鈣的使用是被禁止的。印度於2023年啟動的「農業管理替代營養促進和激勵計畫」為引導生產者過渡到有機肥料的各邦提供補貼,從而縮小村級價格差距。中國的「十四五」規劃要求各省到2025年處理80%的畜禽糞便,並對堆肥和製粒設備提供一半的補貼。由於有機認證的審核週期為三年,那些從多季需求通路開始轉型生產者受現貨價格波動的影響較小。這些結構性因素確保了採購合約的簽訂,並穩定了富含磷有機肥料市場加工商的現金流。
政府對有機肥料的補貼與扶持政策
直接財政支持計畫正在降低合成磷酸鹽的傳統溢價。 2024年12月,美國農業部(USDA)撥款1.16億美元用於41個「畜禽糞便制肥」項目,將投資回收期從8年縮短至不到5年。肯亞2024年國家有機農業政策將認證期限縮短一半至6個月,使當地加工商能夠與進口混合產品競爭。南非2024年《肥料法》修正案強制要求標註磷含量,從而識別出分析值低的堆肥,並優先考慮符合標準的供應商。巴西2024年國家有機農業計畫為加工甘蔗渣和家禽糞便的工廠提供低利率貸款,這些資源在聖保羅州和巴拉那州十分豐富。這些措施共同擴大了磷強化有機肥料市場的潛在基本客群。
它比傳統化學肥料更貴。
有機肥料每公斤有效磷的成本通常是磷酸二銨的1.5到2.5倍,這種價格差異正在擠壓小規模農戶的利潤空間。在撒哈拉以南非洲的一些地區,肥料成本可能佔生產成本的40%,迫使生產者優先考慮即時增產而非土壤健康。國際肥料發展中心(IFDC)在其「土壤價值」計畫中,正致力於透過將當地磷礦石與堆肥混合來降低交付成本,但其效果需要兩到三個種植季才能顯現。印度的合作貸款計畫緩解了部分壓力,但由於違約風險,貸款額受到限制。在加工商擴大生產規模之前,這種價格差異將繼續阻礙強化磷有機肥料市場的成長。
細分市場分析
到2025年,顆粒狀產品將佔磷強化有機肥市場佔有率的43%,成為最大的市佔率。這是因為在印度和中國,溫度敏感的液體肥料無法在常溫倉庫中儲存。這些固體產品可以與農民現有的噴霧器搭配使用,以避免購買新設備。粉末狀產品在種子披衣領域佔有了一席之地,但面臨著粉塵問題和養分密度低等挑戰。與高水分含量的液體肥料相比,顆粒狀產品單位磷的運輸成本較低。隨著基於智慧型手機的智慧施肥技術的應用日益普及,人們對粒徑均勻的顆粒肥料也越來越感興趣。
隨著施肥和灌溉系統在高價值園藝領域的普及,預計2026年至2031年間,液態肥料的複合年成長率將達到13.4%,成為成長最快的肥料類型。滴灌管可將溶解的磷直接輸送到根際,在鈣質土壤中可提高30%的磷利用率。歐盟的「生活實驗室」研究表明,在生菜和菠菜種植中,使用液態肥料可使磷的吸收率提高15%。科羅曼德國際公司於2024年推出的Gromor過磷酸鈣,展示了液態肥料如何透過結合漿液和顆粒的混合形態,實現從固體到液態的過渡。這些趨勢正穩步推動磷強化有機肥市場的多元化發展。
到2025年,動物糞便衍生產品將佔磷強化有機肥市場48%的佔有率,憑藉集約化畜牧養殖系統穩定的原料供應,佔據最大的市場銷售量。酪農、養豬場和養雞場已經開始在糞池中收集廢棄物,降低了收整合本。其營養成分可預測,便於零售商進行標準化標示標註。在工業污染風險已控制的地區,都市污水污泥也是可利用的原料。豐富的原料供應支撐了其目前的價格優勢。
隨著都市區對掩埋的綠色廢棄物進行再利用,植物來源堆肥預計將成為成長最快的原料類別,在2026年至2031年間實現14.1%的複合年成長率。能夠溶解磷的微生物接種劑可使磷的萃取量增加一倍,而無需添加岩石,從而提高養分密度。國際肥料發展中心(IFDC)在衣索比亞進行的試點計畫表明,咖啡渣堆肥可以取代磷酸二銨的進口。 ICL集團的「聚硫酸鹽」礦物預計將於2025年獲得有機認證,為擔心病原體的生產商提供不含牲畜糞便的替代方案。採購來源的多樣化正在增強強化磷有機肥市場的韌性。
區域分析
2025年,亞太地區佔市場佔有率的42%。印度2024年的獎勵計畫為以天然肥料取代合成肥料的邦提供補貼,降低了合作社的交付成本。中國要求在2025年回收相當一部分畜禽糞便,並透過大量資本補貼促進了新建顆粒肥料廠的建設。 2025年,科羅曼德國際公司在主要水稻和甘蔗產區的特種肥料銷售額有所成長。日本和韓國已實施磷回收法規,支撐了對鳥糞石的穩定需求。
預計2026年至2031年間,非洲將以13.0%的複合年成長率達到最高成長。肯亞2024年的有機政策將認證週期縮短至六個月,釋放了當地的加工能力。南非2024年的標籤法規揭露了不合規的堆肥,並提高了合規供應商的市場佔有率。 2024年,OCP集團在肯亞、衣索比亞和奈及利亞建立了混合設施,將摩洛哥岩石與當地殘渣混合。國際肥料發展中心(IFDC)的「土壤價值」計畫旨在惠及薩赫勒地區的200萬農民,擴大磷強化有機肥的市場規模。
預計北美和歐洲的磷強化有機肥市場將實現顯著的複合年成長率。據美國農業部(USDA)稱,2024年推出的津貼預計將把化肥加工設施的投資回收期縮短至五年以內,加速產能擴張。這些津貼可望鼓勵農民和生產商採用先進的化肥加工技術,進一步推動市場成長。歐盟計畫於2026年取消加工堆肥使用量的限制,預計將擴大市場規模。這項監管政策的改變有望提高農民使用加工堆肥的柔軟性,並促進其在全部區域的推廣應用。此外,英國正在討論在2027年前簡化報名手續,這有望簡化合規流程,進一步推動市場擴張。
其他好處:
- Excel格式的市場預測(ME)表
- 3個月的分析師支持
目錄
第1章:引言
- 研究假設和市場定義
- 調查範圍
第2章:調查方法
第3章執行摘要
第4章 市場狀況
- 市場概覽
- 市場促進因素
- 永續農業方法的推廣正在逐步推進。
- 政府對有機肥料的補貼與扶持政策
- 磷酸鹽蘊藏量的下降正在推動磷的回收。
- 畜禽糞便處理與畜禽垃圾焚化發電計畫的整合
- 推出含生物炭的磷強化顆粒。
- 基於區塊鏈的可追溯性正在推動溢價的形成。
- 市場限制因素
- 它比傳統化學肥料更貴。
- 保存期限短和儲存挑戰
- 某些廢棄物流有重金屬污染風險
- 缺乏全球營養標示標準
- 監理情勢
- 技術展望
- 波特五力分析
第5章 市場規模與成長預測
- 按形式
- 顆粒狀
- 粉末
- 液體
- 按原料
- 源自牲畜糞便
- 植物來源堆肥
- 源自都市垃圾
- 透過使用
- 土壤改良劑
- 葉面處理
- 種子披衣
- 按作物類型
- 穀類和穀類食品
- 水果和蔬菜
- 油籽/豆類
- 透過分銷管道
- 直銷
- 零售和線上
- 按地區
- 北美洲
- 美國
- 加拿大
- 其他北美國家
- 南美洲
- 巴西
- 阿根廷
- 其他南美國家
- 歐洲
- 德國
- 法國
- 英國
- 俄羅斯
- 其他歐洲國家
- 亞太地區
- 中國
- 印度
- 日本
- 澳洲
- 其他亞太國家
- 中東
- 沙烏地阿拉伯
- 阿拉伯聯合大公國
- 其他中東國家
- 非洲
- 南非
- 肯亞
- 其他非洲國家
- 北美洲
第6章 競爭情勢
- 市場集中度
- 策略趨勢
- 市佔率分析
- 公司簡介
- Coromandel International Limited
- ICL Group Ltd.
- OCP Group
- Yara International ASA
- The Mosaic Company
- Fertoz Limited
- Perfect Blend, LLC
- Sustane Natural Fertilizer, Inc.
- AgroLiquid
- Midwestern BioAg, Inc.
- Rovensa Group
- Lallemand Plant Care
- Italpollina SpA
- Symborg SL
- Rizobacter Argentina SA
第7章 市場機會與未來展望
According to Mordor Intelligence, the phosphorus enriched organic manure market size is projected to expand from USD 2.35 billion in 2025 and USD 2.56 billion in 2026 to USD 4.00 billion by 2031, registering a CAGR of 11.2% between 2026 to 2031.
This report is Segmented by Form (Granular, Powder, and Liquid), by Source (Animal Manure-Derived, Plant-Based Compost, and More), by Application (Soil Amendment, and More), by Crop Type (Cereals and Grains, and More), by Distribution Channel (Direct Sales, and More), and by Geography (North America, South America, and More). The Market Forecasts are Provided in Terms of Value (USD).
Global Phosphorus Enriched Organic Manure Market Trends and Insights
Rising Adoption of Sustainable Agriculture Practices
Regenerative protocols that prioritize soil organic matter are placing phosphorus enriched manure at the center of mainstream crop nutrition. The Research Institute of Organic Agriculture reported 98.9 million hectares under certified organic management in 2024, an acreage that bans synthetic superphosphate. India's Promotion of Alternative Nutrients for Agriculture Management Remunerating Rewards scheme, launched in 2023, reimburses states that shift growers toward organic inputs, thereby shrinking the price gap at the village level. China's Fourteenth Five-Year Plan compels provinces to process 80% of livestock manure by 2025, subsidizing half the cost of composting and pelletizing equipment. Because organic certification audits last three years, growers who begin conversion from multi-season demand pipelines are largely insulated from spot pricing. These structural factors lock in offtake agreements, stabilizing cash flows for processors in the phosphorus enriched organic manure market.
Government Subsidies and Supportive Policies for Organic Fertilizers
Direct fiscal programs are compressing historical price premiums over synthetic phosphates. In December 2024, the United States Department of Agriculture (USDA) awarded USD 116 million to 41 manure-to-fertilizer projects, cutting payback periods from eight to below five years. Kenya's 2024 National Organic Agriculture Policy halved certification timelines to six months, enabling local processors to challenge imported blends. South Africa's 2024 Fertilizer Act amendments mandate phosphorus labeling, expose low-analysis compost, and favor compliant suppliers. Brazil's 2024 National Organic Agriculture Plan offers low-interest loans for plants that process sugarcane bagasse and poultry litter, abundant residues in Sao Paulo and Parana. These measures collectively expand the addressable customer base in the phosphorus enriched organic manure market.
Higher Cost Versus Conventional Chemical Fertilizers
Organic manure typically costs 1.5 to 2.5 times as much per kilogram of available phosphorus as diammonium phosphate, a spread that pinches smallholder margins. Fertilizer can account for 40% of production costs in parts of Sub-Saharan Africa, forcing growers to prioritize immediate yield response over soil health. The International Fertilizer Development Center blends local rock phosphate with compost under its Soil Values program to reduce delivered cost, yet benefits accrue only after two or three seasons. India's cooperative credit schemes relieve some pressure but carry default risks that cap loan volumes. Until processors scale up, the premium will continue to weigh on uptake in the phosphorus enriched organic manure market.
Other drivers and restraints analyzed in the detailed report include:
- Declining Phosphate Rock Reserves are Driving Phosphorus Recycling
- Integration of Manure Processing with Livestock Waste-to-Energy Projects
- Limited Shelf Life and Storage Challenges
For complete list of drivers and restraints, kindly check the Table Of Contents.
Segment Analysis
Granular products commanded 43% of 2025 of phosphorus enriched organic manure market share in 2025, the largest slice of the phosphorus enriched organic manure market, because ambient-storage warehouses in India and China cannot handle temperature-sensitive liquids. These solids integrate with farmers' existing broadcast spreaders, avoiding new capital outlays. Powdered inputs fill seed-coating niches but face dust and lower nutrient-density penalties. Granular supply also benefits from lower freight costs per unit of phosphorus than high-water liquid blends. As smartphone advisories spread the use of variable-rate techniques, interest in uniform pellet sizing is rising.
Liquid formulations will post the fastest 13.4% CAGR over 2026-2031 as fertigation systems penetrate high-value horticulture. Drip lines deliver dissolved phosphorus directly to root zones, improving use efficiency by 30% in calcareous soils. European Union living labs showed that liquids provide 15% quicker uptake in lettuce and spinach cultivation. Coromandel International's 2024 launch of Gromor Super Phosphate illustrates how hybrid slurry-granule formats bridge the transition from solids to liquids. These dynamics steadily diversify the phosphorus enriched organic manure market.
Animal manure-derived accounted for 48% of phosphorus enriched organic manure market size in 2025, delivering the largest volume share in the phosphorus enriched organic manure market, thanks to ready feedstock from confined livestock systems. Dairy, swine, and poultry operations already capture waste in pits, lowering collection costs. Nutrient content is predictable, supporting standardized labeling that retailers demand. Municipal biosolids add incremental tonnage where industrial contamination risks are managed. This feedstock abundance underpins current price leadership.
Plant-based compost will be the fastest-growing source category, with a 14.1% CAGR through 2026-2031, as cities divert green waste from landfills. Microbial inoculants that solubilize phosphorus double the extractable levels without rock additions, thereby increasing nutrient density. International Fertilizer Development Center pilots in Ethiopia demonstrate that coffee husk compost can offset imports of diammonium phosphate. ICL Group's Polysulphate mineral secured organic status in 2025, offering a manure-free alternative for growers wary of pathogens. Diversified sourcing enhances resilience in the phosphorus enriched organic manure market.
Complete Report Scope:
- By Form
- Granular
- Powder
- Liquid
- By Source
- Animal Manure-derived
- Plant-based Compost
- Municipal Waste-derived
- By Application
- Soil Amendment
- Foliar Treatment
- Seed Coating
- By Crop Type
- Cereals and Grains
- Fruits and Vegetables
- Oilseeds and Pulses
- By Distribution Channel
- Direct Sales
- Retail and Online
- By Geography
- North America
- United States
- Canada
- Rest of North America
- South America
- Brazil
- Argentina
- Rest of South America
- Europe
- Germany
- France
- United Kingdom
- Russia
- Rest of Europe
- Asia-Pacific
- China
- India
- Japan
- Australia
- Rest of Asia-Pacific
- Middle East
- Saudi Arabia
- United Arab Emirates
- Rest of Middle East
- Africa
- South Africa
- Kenya
- Rest of Africa
- North America
Geography Analysis
Asia-Pacific captured 42% of 2025 revenue in the market. India's 2024 rewards scheme reimburses states that substitute synthetics, reducing the delivered cost to cooperatives. China's directive to recycle a significant portion of livestock manure by 2025 supports the establishment of new pellet plants through substantial capital subsidies. Coromandel International's specialty nutrients sales rose in 2025 across rice and sugarcane belts. Japan and South Korea enforce phosphorus recovery rules, anchoring steady demand for struvite.
Africa will record the fastest CAGR of 13.0% through 2026-2031. Kenya's 2024 organic policy slashed certification time to six months, unlocking local processing capacity. South Africa's 2024 label rules expose substandard compost, boosting the share of compliant suppliers. OCP Group funded blending hubs in Kenya, Ethiopia, and Nigeria in 2024 to pair Moroccan rock with local residues. The International Fertilizer Development Center's Soil Values program covers two million Sahelian farmers, expanding the footprint of the phosphorus enriched organic manure market.
North America and Europe are projected to experience significant CAGRs in the phosphorus-enriched organic manure market. According to the United States Department of Agriculture (USDA), 2024 grants are projected to reduce manure processing payback periods to less than five years, thereby accelerating capacity additions. These grants are likely to encourage farmers and producers to adopt advanced manure processing technologies, further boosting market growth. In 2026, the European Union is set to lift application ceilings for processed manure, which is anticipated to increase market volume. This regulatory change is anticipated to provide greater flexibility for farmers in utilizing processed manure, enhancing its adoption across the region. Additionally, consultations in the United Kingdom aim to streamline registrations by 2027, which could simplify compliance processes and support market expansion.
- Coromandel International Limited
- ICL Group Ltd.
- OCP Group
- Yara International ASA
- The Mosaic Company
- Fertoz Limited
- Perfect Blend, LLC
- Sustane Natural Fertilizer, Inc.
- AgroLiquid
- Midwestern BioAg, Inc.
- Rovensa Group
- Lallemand Plant Care
- Italpollina S.p.A
- Symborg S.L.
- Rizobacter Argentina S.A.
Additional Benefits:
- The market estimate (ME) sheet in Excel format
- 3 months of analyst support
TABLE OF CONTENTS
1 Introduction
- 1.1 Study Assumptions and Market Definition
- 1.2 Scope of the Study
2 Research Methodology
3 Executive Summary
4 Market Landscape
- 4.1 Market Overview
- 4.2 Market Drivers
- 4.2.1 Rising adoption of sustainable agriculture practices
- 4.2.2 Government subsidies and supportive policies for organic fertilizers
- 4.2.3 Declining phosphate rock reserves driving phosphorus recycling
- 4.2.4 Integration of manure processing with livestock waste-to-energy projects
- 4.2.5 Emergence of biochar-blended phosphorus-enriched pellets
- 4.2.6 Blockchain-based traceability boosting premium pricing
- 4.3 Market Restraints
- 4.3.1 Higher cost versus conventional chemical fertilizers
- 4.3.2 Limited shelf life and storage challenges
- 4.3.3 Heavy-metal contamination risks from some waste streams
- 4.3.4 Lack of global standards for nutrient-content labeling
- 4.4 Regulatory Landscape
- 4.5 Technological Outlook
- 4.6 Porter's Five Forces Analysis
- 4.6.1 Bargaining Power of Suppliers
- 4.6.2 Bargaining Power of Buyers
- 4.6.3 Threat of New Entrants
- 4.6.4 Threat of Substitutes
- 4.6.5 Intensity of Competitive Rivalry
5 Market Size and Growth Forecasts (Value)
- 5.1 By Form
- 5.1.1 Granular
- 5.1.2 Powder
- 5.1.3 Liquid
- 5.2 By Source
- 5.2.1 Animal Manure-derived
- 5.2.2 Plant-based Compost
- 5.2.3 Municipal Waste-derived
- 5.3 By Application
- 5.3.1 Soil Amendment
- 5.3.2 Foliar Treatment
- 5.3.3 Seed Coating
- 5.4 By Crop Type
- 5.4.1 Cereals and Grains
- 5.4.2 Fruits and Vegetables
- 5.4.3 Oilseeds and Pulses
- 5.5 By Distribution Channel
- 5.5.1 Direct Sales
- 5.5.2 Retail and Online
- 5.6 By Geography
- 5.6.1 North America
- 5.6.1.1 United States
- 5.6.1.2 Canada
- 5.6.1.3 Rest of North America
- 5.6.2 South America
- 5.6.2.1 Brazil
- 5.6.2.2 Argentina
- 5.6.2.3 Rest of South America
- 5.6.3 Europe
- 5.6.3.1 Germany
- 5.6.3.2 France
- 5.6.3.3 United Kingdom
- 5.6.3.4 Russia
- 5.6.3.5 Rest of Europe
- 5.6.4 Asia-Pacific
- 5.6.4.1 China
- 5.6.4.2 India
- 5.6.4.3 Japan
- 5.6.4.4 Australia
- 5.6.4.5 Rest of Asia-Pacific
- 5.6.5 Middle East
- 5.6.5.1 Saudi Arabia
- 5.6.5.2 United Arab Emirates
- 5.6.5.3 Rest of Middle East
- 5.6.6 Africa
- 5.6.6.1 South Africa
- 5.6.6.2 Kenya
- 5.6.6.3 Rest of Africa
- 5.6.1 North America
6 Competitive Landscape
- 6.1 Market Concentration
- 6.2 Strategic Moves
- 6.3 Market Share Analysis
- 6.4 Company Profiles (Includes Global Level Overview, Market Level Overview, Core Segments, Financials as Available, Strategic Information, Market Rank/Share for Key Companies, Products and Services, And Recent Developments)
- 6.4.1 Coromandel International Limited
- 6.4.2 ICL Group Ltd.
- 6.4.3 OCP Group
- 6.4.4 Yara International ASA
- 6.4.5 The Mosaic Company
- 6.4.6 Fertoz Limited
- 6.4.7 Perfect Blend, LLC
- 6.4.8 Sustane Natural Fertilizer, Inc.
- 6.4.9 AgroLiquid
- 6.4.10 Midwestern BioAg, Inc.
- 6.4.11 Rovensa Group
- 6.4.12 Lallemand Plant Care
- 6.4.13 Italpollina S.p.A
- 6.4.14 Symborg S.L.
- 6.4.15 Rizobacter Argentina S.A.
7 Market Opportunities and Future Outlook

 有機肥料市場報告:趨勢、預測與競爭分析(至2035年)
 有機農藥市場-2026-2032年全球市場預測
 越南有機肥料:市場佔有率分析、產業趨勢與統計及成長預測(2026-2031)有機肥料市場:2026-2032年全球市場預測(依原料、產品形態、混合、作物類型、應用、最終用戶和銷售管道分類)美國有機肥料:市場佔有率分析、產業趨勢與統計及成長預測(2026-2031)
 2026年全球綠肥市場報告
 全球有機肥料市場規模、佔有率、趨勢和成長分析報告(2026-2034年)北美有機肥料:市佔率分析、產業趨勢與統計及成長預測(2026-2031 年)富磷有機肥市場:依作物類型、形態、應用通路-2026-2032年全球預測
 全球有機肥料市場:市場規模、佔有率和趨勢分析(按產品、形態、應用和地區分類),細分市場預測(2026-2033 年)