


 |
市場調查報告書
商品編碼
2118037
聯網電視廣告:市佔率分析、產業趨勢與統計及成長預測(2026-2031 年)Connected TV Advertising - Market Share Analysis, Industry Trends & Statistics, Growth Forecasts (2026 - 2031) |
||||||

※ 本網頁內容可能與最新版本有所差異。詳細情況請與我們聯繫。
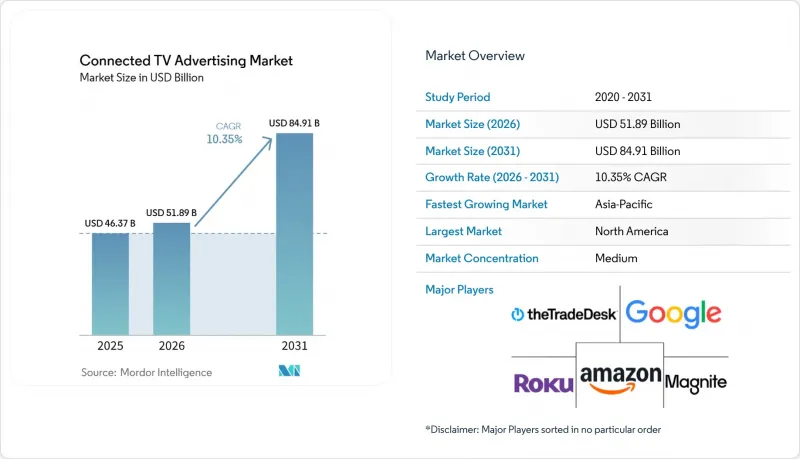
據 Mordor Intelligence 稱,2025 年聯網電視廣告市場價值 463.7 億美元,預計從 2026 年到 2031 年將以 10.35% 的複合年成長率成長,到 2031 年達到 849.1 億美元。
本報告依廣告投放位置(前置式、中貼片廣告、後貼片廣告)、廣告格式(影片廣告、展示廣告、互動廣告等)、裝置類型(智慧電視、遊戲機等)、最終用戶(媒體娛樂、汽車等)以及地區(北美、南美、歐洲、亞太、中東和非洲)進行細分。市場預測以美元計價。
全球聯網電視廣告市場趨勢與洞察
從線性電視到串流觀眾的轉變
觀眾逐漸遠離傳統電視,仍是聯網電視廣告市場發展的最根本動力。觀眾在串流平台上花費的時間越來越多,這改變了廣告主針對家庭用戶群和重複曝光的目標受眾。這種轉變意義重大,因為聯網電視將客廳螢幕與數位發行結合,相較於傳統電視廣告投放方式,能夠提供更強大的宣傳活動管理能力。因此,一個新興的市場正在形成,品牌預算不再被動等待傳統收視模式的恢復,而是根據觀眾行為進行分配。此外,由於廣告庫存和買家需求的成長方向一致,觀眾的這種轉變也進一步鞏固了聯網電視廣告市場的長期前景。
擴大廣告收入流和FAST廣告庫存
廣告支援服務和FAST頻道的擴張正在增加聯網電視廣告市場的可用廣告資源。根據Gracenote預測,到2025年3月,主要市場的活躍FAST頻道數量將超過1610個,較2023年中期幾乎加倍,並在2025年成長21%。這種成長使得廣告主更容易獲得比傳統訂閱影片模式更廣泛的受眾群體。此外,它還為發布商提供了更大的空間,讓他們可以嘗試新的廣告投放方式、廣告打包模式和受眾細分,而無需依賴單一的串流媒體服務。 Wurl預測,到2027年,FAST廣告收入將超過120億美元,這顯示聯網電視廣告市場為何持續吸引尋求可擴展影片廣告資源的買家。
「圍牆花園」內測量資料的碎片化
衡量指標的零碎化仍然是聯網電視廣告市場支出快速成長的最明顯因素之一。廣告主在各大串流媒體平台上仍面臨不同的彙報方法、ID框架和歸因規則,這使得跨平台比較變得困難。這是一個至關重要的問題,尤其是在品牌將預算從長期使用的電視廣告項目轉移到串流平台之際,因為宣傳活動支出與業務成果之間的清晰關聯對於此類轉變至關重要。 2025年,互動廣告局(IAB)發布指南,呼籲採用標準化的聯網電視轉換API,以解決這個問題。這表明市場仍然需要通用的衡量方法來增強廣告主的信心。在這些標準更廣泛應用之前,隨著品牌重新評估其在更大規模衡量的數位管道上的預算,聯網電視廣告市場將繼續面臨摩擦。
細分市場分析
2025年,插播廣告佔聯網電視廣告市場規模的45.49%,並且在營收方面持續保持領先地位。插播廣告的優點在於它位於觀看過程的中間,而非開頭或結尾,因此在付費串流服務的獲利模式中扮演著越來越重要的角色。在聯網電視廣告市場,插播廣告位也適用於長影片內容,因為它們允許平台在不影響基本觀看體驗的前提下控制廣告投放量。因此,插播廣告既適用於提供廣告支援的付費訂閱服務,也適用於高度依賴廣告收入的快速服務。目前插播廣告佔據主導地位,顯示平台仍傾向於選擇能夠自然地插入現有內容間隙的廣告形式。
預計到2031年,前置式廣告將以10.81%的複合年成長率成長,顯示廣告主仍然重視這種易於實施且可快速部署於各種內容類型的廣告形式。對於從數位影片和展示廣告宣傳進入聯網電視(CTV)廣告市場的廣告主而言,前置式廣告投放非常有效,因為它符合他們熟悉的購買邏輯和廣泛的覆蓋目標。後貼片廣告仍然是廣告投放組合的一部分,但其用途擴大用於擴大訊息曝光度,而不是在宣傳活動執行中扮演主要角色。 IAB技術實驗室於2025年12月發布的「CTV廣告組合」透過標準化六種新的程式化交易廣告形式,拓寬了廣告庫存的討論範圍,這些形式包括暫停廣告、選單廣告、螢幕保護程式廣告、場景內廣告、擠壓式廣告和疊加廣告。這種標準化將為聯網電視廣告市場提供超越傳統前置式、中貼片和後貼片結構的新方式來吸引觀眾的注意。
預計到2025年,影片廣告將佔聯網電視廣告市場規模的78.83%,顯示影片廣告形式繼續主導廣告主在串流媒體環境下如何利用電視螢幕。全螢幕影片仍然是在聯網電視設備上觸達、喚起和傳遞品牌訊息的最直接方式。這一主導地位體現在大多數優質串流廣告資源都圍繞著影片而非靜態圖像或其他輔助格式建構。這持續推動聯網電視廣告產業以影片為中心的定價、廣告資源規劃和宣傳活動設計。隨著影片不斷符合廣告商的預期和平台經濟效益,這一領域的市場地位不太可能迅速削弱。
預計到2031年,互動廣告將以11.12%的複合年成長率成長,顯示在聯網電視廣告市場中,以效果為導向的應用場景的重要性日益凸顯。這種互動性的轉變反映了市場對能夠更直接地將觀看行為與購物、搜尋或回應行為連結起來的廣告形式的需求。展示廣告在聯網電視廣告市場仍然至關重要,尤其是在主頁和播放/暫停螢幕上,因為平台可以創建標準影片廣告位之外的新型廣告資源。 IAB Tech Lab的2025年產品組合正在推動這一轉變,它簡化了需求方平台和供應方平台之間程序化交易中非傳統連網電視廣告形式的交易。隨著這些廣告形式的購買和衡量變得更加便捷,聯網電視廣告產業將能夠更廣泛地在同一螢幕上結合品牌主導和轉換主導宣傳活動。
區域分析
2025年,北美將佔據聯網電視廣告市場38.42%的佔有率,並持續維持領先地位。該地區擁有成熟的程式化系統、豐富的串流媒體廣告資源以及聯網電視設備極高的家庭普及率等優勢。在將數據主導的受眾購買與加值內容結合方面,北美仍然是發展最成熟的地區。這使得北美在聯網電視廣告市場的變現深度和交易效率方面擁有顯著優勢。福斯於2026年6月宣布收購Roku,透過將內容、作業系統覆蓋範圍和廣告基礎設施整合到一個統一的提案中,展現了平台主導地位在該地區的價值。
預計到2031年,亞太地區將以10.64%的複合年成長率成長,成為聯網電視廣告市場成長最快的地區。這一成長主要得益於智慧電視的普及、寬頻使用量的增加以及部分國家傳統電視廣播覆蓋率較低。日本在聯網電視電視廣告市場表現特別突出。根據CyberAgent的報告顯示,到2025年,日本連網電視影片廣告市場規模將達到1,295億日圓(約8.69億美元),較去年同期成長127%。儘管該地區各國的發展速度不盡相同,但發展方向清晰明確,聯網電視用戶群也不斷擴大。因此,在預測期內,亞太地區將成為聯網電視廣告市場的主要成長動力。
在歐洲,隨著數位影片在區域廣告預算中所佔的佔有率不斷擴大,聯網電視廣告市場的重要性日益凸顯。 IAB Europe 的一份報告顯示,到 2025 年,歐洲數位廣告支出將達到 1,311 億歐元(1,478 億美元),其中影片廣告將佔展示廣告總投資的一半以上。鑑於聯網電視是全部區域影片產業持續擴張的重要組成部分,這一趨勢意義重大。此外,歐洲對資料使用和使用者許可的監管仍然至關重要,這進一步提升了第一方資料管理和「無塵室」夥伴關係關係的戰略意義。在中東,IAB MENA 的報告預測,到 2025 年,連網電視廣告市場將成長 31%,超過整體數位市場 17.8% 的成長率。這表明,聯網電視觀看的重要性正在超越傳統的核心區域。在非洲,隨著寬頻普及率的提高和串流媒體在年輕一代的廣泛應用,聯網電視廣告市場持續展現長期發展機會。
其他好處:
- Excel格式的市場預測(ME)表
- 3個月的分析師支持
目錄
第1章:引言
- 研究假設和市場定義
- 調查範圍
第2章:調查方法
第3章執行摘要
第4章 市場狀況
- 市場概覽
- 市場促進因素
- 從線性電視到串流觀眾的轉變
- 擴大廣告收入流和FAST庫存
- 程序採購和自動化收入最佳化
- 直播體育賽事和付費賽事的商業化
- 零售媒體和商業相關連網電視的利用
- 受隱私保護的第一方資料和情境定向
- 市場限制因素
- 「圍牆花園」之間測量結果的碎片化
- 展會層面的透明度和內容可見度有限。
- 詐欺風險和虛假庫存報告
- 保護優質牲畜成本和效益的壓力。
- 產業價值鏈分析
- 監理情勢
- 技術展望
- 波特五力分析
第5章 市場規模與成長預測
- 透過廣告投放
- 前置式廣告
- 插播廣告
- 片尾廣告
- 廣告格式
- 影片廣告
- 展示廣告
- 互動廣告
- 其他廣告形式(例如音訊廣告)
- 依設備類型
- 智慧電視
- 遊戲機
- 其他設備類型
- 最終用戶
- 媒體與娛樂
- 零售與電子商務
- 車
- 醫療和藥品
- 金融服務
- 旅遊與飯店
- 其他最終用戶
- 按地區
- 北美洲
- 美國
- 加拿大
- 墨西哥
- 南美洲
- 巴西
- 阿根廷
- 智利
- 其他南美國家
- 歐洲
- 德國
- 英國
- 法國
- 義大利
- 西班牙
- 其他歐洲國家
- 亞太地區
- 中國
- 日本
- 印度
- 韓國
- 澳洲
- 其他亞太國家
- 中東
- 沙烏地阿拉伯
- 阿拉伯聯合大公國
- 卡達
- 其他中東國家
- 非洲
- 南非
- 埃及
- 奈及利亞
- 其他非洲國家
- 北美洲
第6章 競爭情勢
- 市場集中度
- 策略趨勢
- Vendor Positioning Analysis
- 公司簡介
- Alphabet Inc.
- Amazon.com, Inc.
- Comcast Corporation
- Disney Advertising Sales LLC
- Google LLC
- Innovid Corp.
- LG Electronics Inc.
- Magnite, Inc.
- Microsoft Corporation
- NBCUniversal Media, LLC
- Nielsen Holdings plc
- Paramount Global
- PubMatic, Inc.
- Roku, Inc.
- Samsung Electronics Co., Ltd.
- Samba TV, Inc.
- The Trade Desk, Inc.
- Tremor International Ltd.
- Viant Technology Inc.
- Yahoo Inc.
第7章 市場機會與未來展望
According to Mordor Intelligence, the connected TV advertising market size was valued at USD 46.37 billion in 2025 and is projected to reach USD 84.91 billion by 2031, at a CAGR of 10.35% during 2026-2031.
This report is Segmented by Ad Placement (Pre-Roll, Mid-Roll, and Post-Roll), Ad Format (Video Ads, Display Ads, Interactive Ads, and More), Device Type (Smart TVs, Gaming Consoles, and More), End User (Media and Entertainment, Automotive, and More), and Geography (North America, South America, Europe, Asia-Pacific, Middle East, and Africa). The Market Forecasts are Provided in Terms of Value (USD).
Global Connected TV Advertising Market Trends and Insights
Streaming Audience Migration from Linear Television
Audience movement away from linear television remains the most basic force behind the connected TV advertising market. Viewers are spending more time in streaming environments, and that is changing where advertisers look for household reach and repeated exposure. This shift matters because connected TV combines the living room screen with digital delivery, which makes campaign control stronger than in traditional television buying. The result is a market where brand budgets are following audience behavior rather than waiting for old viewing patterns to return. That audience migration also strengthens the long-term case for the connected TV advertising market because inventory growth and buyer demand are moving in the same direction.
Expansion of Ad-Supported Streaming and FAST Inventory
The expansion of ad-supported services and FAST channels is increasing the amount of sellable inventory across the connected TV advertising market. Gracenote reported that active FAST channels in key markets reached more than 1,610 as of March 2025, and the total nearly doubled from mid-2023, with channel count rising 21% during 2025. That growth gives advertisers more access to broad-reach viewing environments that sit outside traditional subscription video models. It also gives publishers more room to test new ad loads, packaging models, and audience groupings without depending on a single type of streaming service. Wurl stated that FAST ad revenues are projected to exceed USD 12 billion by 2027, which shows why the connected TV advertising market continues to attract more demand from buyers looking for scalable video inventory.
Measurement Fragmentation Across Walled Gardens
Measurement fragmentation remains one of the clearest limits on faster spending growth in the connected TV advertising market. Buyers still face different reporting methods, identity frameworks, and attribution rules across major streaming platforms, which makes cross-platform comparison difficult. This matters because budget migration depends on a clear link between campaign spend and business outcomes, especially when brands are moving money from long-established television plans. IAB responded to this problem in 2025 with guidance that called for standardized Conversion API adoption for connected TV, which shows that the market still needs common measurement practices to improve advertiser confidence. Until those standards are used more widely, the connected TV advertising market will continue to face friction when large brand budgets are reviewed against more measurable digital channels.
Other drivers and restraints analyzed in the detailed report include:
- Programmatic Buying and Automated Yield Optimization
- Live Sports and Premium Event Monetization
- Limited Show-Level Transparency and Content Visibility
For complete list of drivers and restraints, kindly check the Table Of Contents.
Segment Analysis
Mid-roll ads held 45.49% of the connected TV advertising market size in 2025, which kept this format in the leading revenue position. The segment benefits from being placed inside the viewing session rather than at the start or the end, which makes it more central to monetization for premium streaming services. In the connected TV advertising market, mid-roll inventory also fits well with longer-form content where platforms can manage ad load without changing the basic viewing experience. That makes it useful for both premium subscription services with ad tiers and FAST services that depend more heavily on advertising revenue. The segment's current lead suggests that platforms still prefer formats that can be inserted naturally into established content breaks.
Pre-roll ads are projected to grow at a 10.81% CAGR through 2031, which shows that buyers still value formats that are simple to deploy and easy to scale across varied content types. Pre-roll placement works well for advertisers entering the connected TV advertising market from digital video and display campaigns because it aligns with familiar buying logic and broad reach goals. Post-roll ads remain part of the placement mix, though they are more often used to extend message exposure than to carry the core burden of campaign delivery. The IAB Tech Lab's CTV Ad Portfolio, published in December 2025, also widened the placement discussion by standardizing 6 new formats for programmatic trade, including pause ads, menu ads, screensaver ads, in-scene ads, squeezebacks, and overlays. That standardization gives the connected TV advertising market more ways to package attention beyond the traditional pre-roll, mid-roll, and post-roll structure.
Video ads accounted for 78.83% of the connected TV advertising market size in 2025, which shows that the format still defines how advertisers use the television screen in streaming environments. Full-screen video remains the most direct way to deliver reach, recall, and brand messaging on connected television devices. Its lead also reflects the fact that most premium streaming inventory is built around video delivery rather than static or companion formats. In the connected TV advertising industry, this keeps video at the center of pricing, inventory planning, and campaign design. The segment's position is unlikely to weaken quickly because video continues to match both advertiser expectations and platform economics.
Interactive ads are forecast to expand at an 11.12% CAGR through 2031, which signals that performance-led use cases are becoming more important across the connected TV advertising market. The move toward interactivity reflects demand for formats that can connect viewing with shopping, search, or response actions in a more direct way. Display ads still matter in the connected TV advertising market, especially on home screens and pause surfaces where platforms can create new inventory outside standard video pods. The IAB Tech Lab's 2025 portfolio supports this shift by making more nontraditional CTV formats easier to transact programmatically across demand and supply platforms. As these formats become easier to buy and measure, the connected TV advertising industry is likely to support a broader mix of branding and conversion-led campaigns on the same screen.
Complete Report Scope:
- Ad Placement
- Pre-roll ads
- Mid-roll ads
- Post-roll ads
- By Ad Format
- Video Ads
- Display Ads
- Interactive Ads
- Other Ad Formats (Audio Ads etc)
- By Device Type
- Smart TVs
- Gaming Consoles
- Other Device Types
- By End User
- Media and Entertainment
- Retail and E-Commerce
- Automotive
- Healthcare and Pharmaceuticals
- Financial Services
- Travel and Hospitality
- Other End Users
- By Geography
- North America
- United States
- Canada
- Mexico
- South America
- Brazil
- Argentina
- Chile
- Rest of South America
- Europe
- Germany
- United Kingdom
- France
- Italy
- Spain
- Rest of Europe
- Asia-Pacific
- China
- Japan
- India
- South Korea
- Australia
- Rest of Asia-Pacific
- Middle East
- Saudi Arabia
- United Arab Emirates
- Qatar
- Rest of Middle East
- Africa
- South Africa
- Egypt
- Nigeria
- Rest of Africa
- North America
Geography Analysis
North America held 38.42% of the connected TV advertising market size in 2025, which kept the region in the leading position. The region benefits from mature programmatic systems, broad streaming inventory, and high household use of connected television devices. It also remains the most developed market for packaging premium content with data-led audience buying. In the connected TV advertising market, this gives North America a strong advantage in monetization depth and transaction efficiency. Fox's announced acquisition of Roku in June 2026 showed how valuable platform control has become in this region because it combines content, operating system reach, and ad infrastructure in one proposed structure.
Asia-Pacific is forecast to grow at a 10.64% CAGR through 2031, making it the fastest-growing region in the connected TV advertising market. Growth is being supported by rising smart TV adoption, broader broadband availability, and a less entrenched linear television structure in several countries. Japan stands out within the connected TV advertising market because CyberAgent reported that the country's CTV video advertising market grew 127% year over year in 2025 to JPY 129.5 billion, (USD 869 million). The region is not moving at the same speed in every country, but the direction is clear and the base of connected viewing households is widening. That makes Asia-Pacific an important growth engine for the connected TV advertising market over the forecast period.
Europe is becoming more important to the connected TV advertising market as digital video gains a larger place in regional advertising budgets. IAB Europe reported that European digital ad spend reached EUR 131.1 billion (USD 147.8 billion), and video accounted for more than half of all display investment in 2025. This matters because connected television is part of the wider video expansion taking place across the region. Data use and consent rules also remain important in Europe, which gives first-party data management and clean-room partnerships a larger strategic role. In the Middle East, IAB MENA reported that CTV advertising grew 31% in 2025, ahead of overall digital market growth of 17.8%, which shows that connected viewing is gaining weight beyond the largest established regions. Africa remains a longer-term opportunity for the connected TV advertising market as broadband coverage improves and streaming adoption becomes more widespread across younger populations.
List of Companies Covered in this Report:
- Alphabet Inc.
- Amazon.com, Inc.
- Comcast Corporation
- Disney Advertising Sales LLC
- Google LLC
- Innovid Corp.
- LG Electronics Inc.
- Magnite, Inc.
- Microsoft Corporation
- NBCUniversal Media, LLC
- Nielsen Holdings plc
- Paramount Global
- PubMatic, Inc.
- Roku, Inc.
- Samsung Electronics Co., Ltd.
- Samba TV, Inc.
- The Trade Desk, Inc.
- Tremor International Ltd.
- Viant Technology Inc.
- Yahoo Inc.
Additional Benefits:
- The market estimate (ME) sheet in Excel format
- 3 months of analyst support
TABLE OF CONTENTS
1 INTRODUCTION
- 1.1 Study Assumptions and Market Definition
- 1.2 Scope of the Study
2 RESEARCH METHODOLOGY
3 EXECUTIVE SUMMARY
4 MARKET LANDSCAPE
- 4.1 Market Overview
- 4.2 Market Drivers
- 4.2.1 Streaming Audience Migration From Linear Television
- 4.2.2 Expansion of Ad-Supported Streaming and FAST Inventory
- 4.2.3 Programmatic Buying and Automated Yield Optimization
- 4.2.4 Live Sports and Premium Event Monetization
- 4.2.5 Retail Media and Commerce-Linked CTV Activation
- 4.2.6 Privacy-Safe First-Party Data and Contextual Targeting
- 4.3 Market Restraints
- 4.3.1 Measurement Fragmentation Across Walled Gardens
- 4.3.2 Limited Show-Level Transparency and Content Visibility
- 4.3.3 Fraud Risk and Misrepresented Inventory
- 4.3.4 Premium Live Inventory Cost and Yield Protection Pressure
- 4.4 Industry Value Chain Analysis
- 4.5 Regulatory Landscape
- 4.6 Technological Outlook
- 4.7 Porter's Five Forces Analysis
- 4.7.1 Bargaining Power of Suppliers
- 4.7.2 Bargaining Power of Buyers
- 4.7.3 Threat of New Entrants
- 4.7.4 Threat of Substitutes
- 4.7.5 Competitive Rivalry
5 MARKET SIZE AND GROWTH FORECASTS (VALUE)
- 5.1 Ad Placement
- 5.1.1 Pre-roll ads
- 5.1.2 Mid-roll ads
- 5.1.3 Post-roll ads
- 5.2 By Ad Format
- 5.2.1 Video Ads
- 5.2.2 Display Ads
- 5.2.3 Interactive Ads
- 5.2.4 Other Ad Formats (Audio Ads etc)
- 5.3 By Device Type
- 5.3.1 Smart TVs
- 5.3.2 Gaming Consoles
- 5.3.3 Other Device Types
- 5.4 By End User
- 5.4.1 Media and Entertainment
- 5.4.2 Retail and E-Commerce
- 5.4.3 Automotive
- 5.4.4 Healthcare and Pharmaceuticals
- 5.4.5 Financial Services
- 5.4.6 Travel and Hospitality
- 5.4.7 Other End Users
- 5.5 By Geography
- 5.5.1 North America
- 5.5.1.1 United States
- 5.5.1.2 Canada
- 5.5.1.3 Mexico
- 5.5.2 South America
- 5.5.2.1 Brazil
- 5.5.2.2 Argentina
- 5.5.2.3 Chile
- 5.5.2.4 Rest of South America
- 5.5.3 Europe
- 5.5.3.1 Germany
- 5.5.3.2 United Kingdom
- 5.5.3.3 France
- 5.5.3.4 Italy
- 5.5.3.5 Spain
- 5.5.3.6 Rest of Europe
- 5.5.4 Asia-Pacific
- 5.5.4.1 China
- 5.5.4.2 Japan
- 5.5.4.3 India
- 5.5.4.4 South Korea
- 5.5.4.5 Australia
- 5.5.4.6 Rest of Asia-Pacific
- 5.5.5 Middle East
- 5.5.5.1 Saudi Arabia
- 5.5.5.2 United Arab Emirates
- 5.5.5.3 Qatar
- 5.5.5.4 Rest of Middle East
- 5.5.6 Africa
- 5.5.6.1 South Africa
- 5.5.6.2 Egypt
- 5.5.6.3 Nigeria
- 5.5.6.4 Rest of Africa
- 5.5.1 North America
6 COMPETITIVE LANDSCAPE
- 6.1 Market Concentration
- 6.2 Strategic Moves
- 6.3 Vendor Positioning Analysis
- 6.4 Company Profiles (includes Global Level Overview, Market Level Overview, Core Segments, Financials as available, Strategic Information, Products and Services, Recent Developments)
- 6.4.1 Alphabet Inc.
- 6.4.2 Amazon.com, Inc.
- 6.4.3 Comcast Corporation
- 6.4.4 Disney Advertising Sales LLC
- 6.4.5 Google LLC
- 6.4.6 Innovid Corp.
- 6.4.7 LG Electronics Inc.
- 6.4.8 Magnite, Inc.
- 6.4.9 Microsoft Corporation
- 6.4.10 NBCUniversal Media, LLC
- 6.4.11 Nielsen Holdings plc
- 6.4.12 Paramount Global
- 6.4.13 PubMatic, Inc.
- 6.4.14 Roku, Inc.
- 6.4.15 Samsung Electronics Co., Ltd.
- 6.4.16 Samba TV, Inc.
- 6.4.17 The Trade Desk, Inc.
- 6.4.18 Tremor International Ltd.
- 6.4.19 Viant Technology Inc.
- 6.4.20 Yahoo Inc.
7 MARKET OPPORTUNITIES AND FUTURE OUTLOOK
- 7.1 White-Space and Unmet-Need Assessment

 聯網電視廣告服務:市場佔有率分析、產業趨勢與統計及成長預測(2026-2031 年)聯網電視:市場佔有率分析、行業趨勢和統計數據、成長預測(2026-2031 年)
 2026年全球可尋址電視廣告市場報告
 聯網電視市場規模、佔有率和趨勢分析報告:按螢幕大小、技術、分銷管道、地區和細分市場預測(2026-2033 年)2026年全球可尋址線性電視(TV)市場報告2026年全球免費廣告支援串流電視(FAST)市場報告
 聯網電視市場分析及預測(至2035年):按類型、產品類型、服務、技術、組件、應用、形式、設備、最終用戶和功能分類2026年全球連網電視市場報告
 聯網電視市場規模、佔有率及成長分析(按螢幕大小、技術、螢幕類型、解析度、作業系統、連線功能、智慧功能和地區)-2025-2032 年產業預測
 連網電視市場機會、成長動力、產業趨勢分析及 2025-2034 年預測