


 |
市場調查報告書
商品編碼
2124674
聯網電視:市場佔有率分析、行業趨勢和統計數據、成長預測(2026-2031 年)Connected TV - Market Share Analysis, Industry Trends & Statistics, Growth Forecasts (2026 - 2031) |
||||||

※ 本網頁內容可能與最新版本有所差異。詳細情況請與我們聯繫。
根據 Mordor Intelligence 預測,聯網電視市場規模將從 2025 年的 285.8 億美元和 2026 年的 300.1 億美元成長到 2031 年的 378.9 億美元,2026 年至 2031 年的年複合成長率(CAGR)為 4.7%。
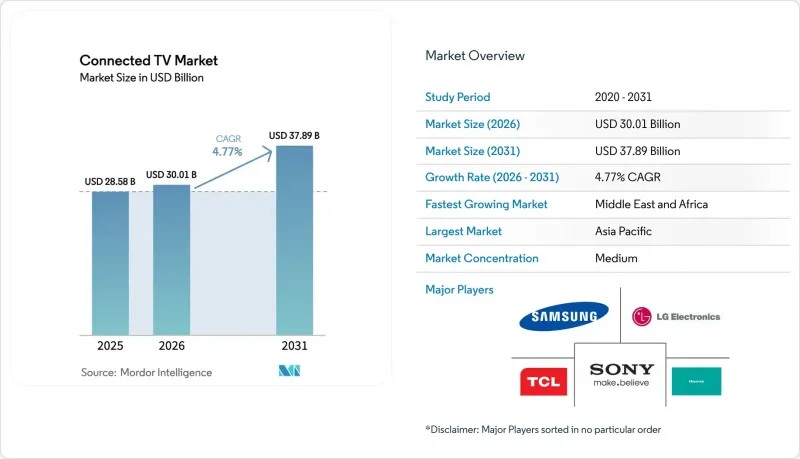
本報告按裝置類型(例如智慧電視)、作業系統(例如 Android TV/Google TV、Tizen)、螢幕大小(例如 32 吋或更小)、解析度(4K 超高清、8K、全高清和高清)、面板技術(LED/Mini-LED、OLED、QLED)、銷售管道(線上、線下)、應用領域(住宅、商用)和地區進行細分。市場預測以美元計價。
全球聯網電視市場趨勢與洞察
廣告支援的快速頻道的普及正在提升北美地區的每位用戶平均收入 (ARPU)。
到2025年,廣告支援的免費串流電視市場規模將達到103.9億美元。這主要得益於美國9,640萬戶家庭的觀看時間年增43%。廣告主為精準定位支付更高的CPM(每千次曝光成本),這使得每位使用者平均收入(ARPU)的成長速度超過了觀看時間的成長速度。同年,Roku平台的使用時長達354億小時,凸顯了與短影片)的發展動能正獎勵廠商補貼設備價格,亞馬遜和Roku已大規模驗證了經營模式。因此,不斷成長的廣告收入同時促進了硬體普及、用戶深度參與和持續收入成長。
設備內 GenAI 超解析度技術正在加速中國和韓國的 4K更換週期。
三星和LG已在其2025年智慧電視產品線中配備了神經網路處理器,可將高清視訊串流提升至接近4K的畫質,並消除雲端延遲。聯發科的MT9638晶片也為TCL和海信的中階機型帶來了類似的功能,降低了體驗AI觀看的成本門檻。中國家庭已經擁有大量傳統高清內容,如今正開始感受到新型4K面板帶來的實際好處,而韓國消費者則將AI視為一項前瞻性的投資。在主要都市區,更換週期已從七年縮短至五年,高階電視的銷售量和平均售價(ASP)也不斷攀升。
CTV OS 生態系統的碎片化增加了 OTT 供應商的應用移植和品質保證 (QA) 成本。
OTT營運商必須同時管理Tizen、Android TV、webOS、Roku OS和Fire OS等多個平台的程式碼庫。每個平台都需要自己的SDK、認證和回歸測試流程,這對小規模的團隊來說是一項沉重的負擔。 Pluto TV已於2025年底停止對舊設備的支持,這表明碎片化如何加速產品過時。平台專屬的廣告技術部署增加了成本,扼殺了小眾服務的長尾效應,並將權力集中在能夠承擔多作業系統開發重擔的成熟公司手中。
細分市場分析
預計到2031年,串流媒體播放器和機上盒的複合年成長率將達到5.12%,而智慧電視仍將保持78.12%的出貨量主導地位。串流媒體播放器的聯網電視市場成長主要受家庭用戶為傳統電視添加價格低廉的播放器以及「剪線族」(放棄有線電視的用戶)的需求驅動,後者正面臨內建儲存和作業系統老化的問題。亞馬遜已售出超過3億台Fire TV設備,並於近期更新了其用戶界面,推出了“Alexa+”,將Alexa的對話式搜尋功能與生成式人工智慧相結合。 Roku OS在2025年初榮登美國、加拿大和墨西哥的銷售榜首,它同時支援嵌入式和外部設定文件,無需用戶更換整台電視即可推動聯網電視市場的發展。
以遊戲為主要目的的買家更傾向於選擇主機或內建雲端遊戲用戶端的電視。微軟計劃在2025年將「Xbox雲端遊戲」擴展到LG電視,而TCL則計劃在2026年推出原生支援144Hz雲端遊戲的「X11L」電視。主機雖然仍屬於小眾市場,但它們的存在延長了遊戲時間,推高了高階產品的平均售價,即使入門級硬體享受大量補貼,也能幫助廠商提高利潤率。
Android TV 和 Google TV 正在蓬勃發展,預計從 2026 年到 2031 年將以 5.89% 的複合年成長率成長。這項轉變的驅動力在於製造商逐漸放棄自有系統,轉而尋求連接 Google Play 並利用 Gemini AI 的優勢。 Android TV OS 10 及更高版本的推出顯著提升了效能和耐用性,有效解決了以往的碎片化問題。這些進步使得 Android TV 和 Google TV 對致力於提供一致、高效能使用者體驗的製造商更具吸引力。
這些平台的日益普及凸顯了業界對標準化和功能增強的重視,以滿足不斷變化的消費者期望。 webOS 和 Roku OS 的市佔率均處於個位數中段,它們專注於提供直覺的使用者介面並最大化廣告收入。亞馬遜基於安卓系統的 Fire OS 則為亞馬遜的串流媒體棒和一些第三方設備提供支持,其重點在於廣告變現。尤其是中小品牌,為了避免內部軟體開發,擴大採用 Roku OS 和 Fire OS。在新興市場,快速進入市場比產品差異化更為重要,因此這一趨勢正在加速發展。中小品牌對這些平台的偏好,凸顯了在競爭激烈的市場環境中,成本效益和縮短上市時間的重要性。
隨著客廳設計不斷演變,100吋螢幕的價格持續下降,66吋以上的面板市場正以5.21%的複合年成長率成長。 Omdia預測,80吋以上螢幕的出貨量將持續成長,預計從2025年的900萬台增至2029年的1,300萬台。這項成長主要源自於消費者對更大螢幕的需求,尤其是在家庭娛樂環境中,以提升觀賞體驗。 2025年,三星、海信和TCL將推出115吋機型,目標客戶包括家庭劇院愛好者和傳統上依賴投影機的商業機構。這些大尺寸螢幕對追求沉浸式體驗的消費者以及希望升級顯示解決方案的企業來說,正變得越來越有吸引力。 46-55吋細分市場憑藉其均衡的性價比,將繼續引領市場,預計到2025年將佔據32.16%的市場佔有率。
46-55吋的電視尺寸因其價格適中且適合一般客廳大小,在家庭用戶中仍然很受歡迎。同時,隨著生產效率的提高,65吋電視的入門價格也越來越親民,促使家庭用戶更換到更大的螢幕。另一方面,32吋以下的顯示器在廚房、臥室和飯店等空間和預算受限的場所仍然佔有一席之地。這些小尺寸顯示器滿足特定應用需求,在特定場景下仍然發揮重要作用,即使人們對更大尺寸顯示器的偏好日益成長。
區域分析
預計到2025年,亞太地區將佔據44.53%的市場佔有率,這主要得益於中國的生產規模、印度電信業者的補貼以及韓國在高階市場的領先地位。小米、海爾和TCL等中國品牌在國內市場採取了積極的定價策略,同時透過出口來穩定工廠運轉率。在印度,Reliance Jio和Airtel的捆綁套餐幫助其產品滲透到主要城市以外的地區。韓國憑藉其自主研發的面板和作業系統,在OLED和QLED市場佔據主導地位。
預計中東和非洲地區將以5.72%的複合年成長率實現最高成長,這主要得益於阿拉伯聯合大公國和沙烏地阿拉伯光纖網路的發展,頻寬瓶頸問題正在解決。基於「沙烏地阿拉伯2030願景」的政府寬頻政策正在推動超高清串流媒體和大螢幕電視的普及。北美地區由於其高廣告收入,繼續保持較高的市場價值。根據Comscore研究顯示,到2025年,擁有聯網電視的家庭數量預計將達到9,640萬戶。隨著OpenAP和CFlight的出現,廣告主正將預算從傳統電視轉向其他平台,因為他們可以利用去重後的覆蓋率指標,跨平台購買廣告位。
在歐洲,嚴格的能源法規阻礙了8K和超高亮度面板的普及。然而,超高清電視在北歐國家的普及正在穩步推進,瑞典的光纖普及率超過90%,挪威、瑞典和丹麥的串流服務用戶數量也相當可觀。南美洲和非洲的智慧電視市場仍以入門級產品為主。都市化和行動寬頻的普及正在創造新的機遇,但價格敏感度和薄弱的分銷網路目前限制了高級產品的市場滲透。
其他好處:
- Excel格式的市場預測(ME)表
- 3個月的分析師支持
目錄
第1章:引言
- 研究假設和市場定義
- 調查範圍
第2章:調查方法
第3章執行摘要
第4章 市場狀況
- 市場概覽
- 市場促進因素
- 廣告支援的快速頻道的激增正在推動北美地區每用戶平均收入 (ARPU) 的上升。
- 透過與供應商簽訂合約獲得補貼的智慧電視正在印度和印尼加速推廣。
- GenAI 技術帶來的設備影像品質提升,正在加速中國和韓國的 4K更換週期。
- 在北歐國家,超過 100 Mbps 的家庭光纖網路連線的廣泛普及正在推動超高清串流媒體的發展。
- 美國廣告衡量標準的標準化(OpenAP、CFlight)正在推動品牌廣告預算轉移到連網電視 (CTV)。
- 雲端渲染遊戲的合作正在創造新的應用場景。
- 市場限制因素
- CTV OS 生態系統的碎片化導致 OTT 供應商的應用移植和品質保證 (QA) 成本上升。
- 歐盟嚴格的能源效率上限限制了 8K 面板的出貨量。
- 中階電視SoC晶片持續供不應求,導致物料清單成本上升。
- 對消費者資料隱私的審查日益嚴格,限制了跨裝置定向投放。
- 宏觀經濟因素對市場的影響
- 產業供應鏈分析
- 監理情勢
- 技術展望
- 波特五力分析
- 產業相關人員分析
第5章 市場規模與成長預測
- 透過裝置
- 智慧電視
- 4K 和 UHD 智慧電視
- 8K智慧電視
- 高清/全高清智慧電視
- 串流媒體播放機
- 遊戲主機(支援串流)
- 智慧電視
- 透過作業系統
- Android TV/Google TV
- Tizen
- webOS
- Roku OS
- Fire OS
- 按螢幕尺寸
- 32英吋或更小
- 33-45英寸
- 46-55英寸
- 56-65英寸
- 66吋或更大
- 通過決議
- 4K UHD
- 8K
- 全高清和高清
- 面板技術
- LED/Mini-LED
- OLED
- QLED
- 透過分銷管道
- 線上
- 線下(專賣店、量販店)
- 按最終用途
- 住宅
- 商業用途(飯店、教育、公司大廳、數位電子看板)
- 地區
- 北美洲
- 美國
- 加拿大
- 墨西哥
- 歐洲
- 德國
- 英國
- 法國
- 義大利
- 西班牙
- 其他歐洲國家
- 亞太地區
- 中國
- 日本
- 韓國
- 印度
- 東南亞
- 澳洲
- 其他亞太國家
- 南美洲
- 巴西
- 其他南美國家
- 中東
- 阿拉伯聯合大公國
- 沙烏地阿拉伯
- 其他中東國家
- 非洲
- 南非
- 其他非洲國家
- 北美洲
第6章 競爭情勢
- 市場集中度
- 策略性措施(併購、合資、授權、內容捆綁)
- 市佔率分析
- Global Connected TV Unit Shares
- Smart TV Vendor Share Analysis
- Streaming Media Player Vendor Share Analysis
- 公司簡介
- Samsung Electronics Co. Ltd.
- LG Electronics Inc.
- TCL Technology Group Corp.
- Hisense Group Co. Ltd.
- Sony Group Corporation
- Vizio Inc.
- Skyworth Group Ltd.
- Panasonic Holdings Corp.
- Sharp Corp.
- Xiaomi Corp.
- Haier Group Corp.
- Amazon.com Inc.(Fire TV)
- Apple Inc.(Apple TV)
- Roku Inc.
- Alphabet Inc.(Chromecast/Google TV)
- Philips(TPV Technology)
- Vestel Elektronik Sanayi ve Ticaret AS
- Funai Electric Co. Ltd.
- Konka Group Co. Ltd.
- Nvidia Corp.(Shield TV)
- Huawei Technologies Co. Ltd.
- Alibaba Group(Tmall Magic Box)
- Realme(BBK Electronics)
- OnePlus Technology(Shenzhen)Co. Ltd.
第7章 市場機會與未來展望
According to Mordor Intelligence, the connected TV market size is projected to expand from USD 28.58 billion in 2025 and USD 30.01 billion in 2026 to USD 37.89 billion by 2031, registering a CAGR of 4.77% between 2026 to 2031.
This report is Segmented by Device (Smart TV, and More), Operating System (Android TV/Google TV, Tizen, and More), Screen Size (Up To 32 Inch, and More), Resolution (4K UHD, 8K, and FHD and HD), Panel Technology (LED/Mini-LED, OLED, and QLED), Distribution Channel (Online, and Offline), End-Use (Residential, A Dn Commercial), and Geography. The Market Forecasts are Provided in Terms of Value (USD).
Global Connected TV Market Trends and Insights
Proliferation of Ad-Supported FAST Channels Elevating ARPU in North America
Free ad-supported streaming television generated USD 10.39 billion in 2025 as 96.4 million U.S. homes streamed 43% more hours than a year earlier. Advertisers pay premium CPMs for deterministic targeting, lifting average revenue per user faster than audience growth. Roku logged 35.4 billion platform hours that year, highlighting dwell-time advantages over short-form social video. FAST momentum incentivizes vendors to subsidize device prices, a model Amazon and Roku have proven at scale. Higher advertising yield therefore supports hardware penetration, deeper engagement, and recurring revenue all at once.
On-Device GenAI Upscaling Spurs 4K Upgrade Cycle in China and South Korea
Samsung and LG fitted 2025 smart-TV lineups with neural processors that upscale HD streams into near-4K images, eliminating cloud latency. MediaTek's MT9638 chip pushed similar capability into mid-tier sets from TCL and Hisense, lowering the cost barrier for AI viewing. Chinese homes rich in legacy HD libraries now see tangible benefits in new 4K panels, while South Korean buyers view AI as futureproofing. Replacement cycles shortened from seven to five years in major metros, raising premium-tier volumes and ASPs.
Fragmented CTV OS Ecosystem Escalates App Porting and QA Costs for OTT Providers
OTT players juggle codebases for Tizen, Android TV, webOS, Roku OS, and Fire OS. Each platform demands its own SDK, certification, and regression testing cycle, stretching smaller teams. Pluto TV ceased support for older devices in late-2025, showing how fragmentation accelerates obsolescence. Platform-specific ad-tech implementations multiply costs, curbing the long-tail of niche services and concentrating power with incumbents that can shoulder multi-OS development burdens.
Other drivers and restraints analyzed in the detailed report include:
- Subsidised Operator-Bundled Smart TVs Accelerating First-Time Adoption in India and Indonesia
- Advertising Measurement Standardisation Driving Brand Budgets to CTV in United States
- Restrictive EU Energy-Efficiency Caps Curb 8K Panel Shipments
For complete list of drivers and restraints, kindly check the Table Of Contents.
Segment Analysis
Streaming dongles and boxes claim a faster 5.12% CAGR through 2031 while smart TVs still hold a dominant 78.12% unit share. The connected TV market size for streaming players benefits from households adding cheap dongles to legacy panels and from cord-cutters whose embedded storage or OS age out. Amazon has sold more than 300 million Fire TV devices, recently refreshing UI with Alexa+ generative AI for conversational discovery. Roku OS, topping sales in United States, Canada, and Mexico in early 2025, straddles both embedded and external profiles, helping the connected TV market expand without waiting for full-set replacement.
Gaming-centric buyers favour consoles or TVs with integrated cloud-gaming clients. Microsoft broadened Xbox Cloud Gaming to LG sets in 2025, and TCL introduced X11L with native 144 Hz cloud-gaming support in 2026. While consoles remain niche, their presence extends session length and lifts premium-tier ASPs, cushioning vendor margins even when entry hardware is heavily subsidized.
Android TV and Google TV are on the rise, boasting a 5.89% CAGR during 2026 to 2031. This shift comes as manufacturers pivot from proprietary systems, seeking access to Google Play and the advantages of Gemini AI. With the introduction of mandatory Android TV OS 10+ specifications, performance and longevity have seen marked improvements, effectively tackling past fragmentation issues. These advancements have made Android TV and Google TV increasingly attractive to manufacturers aiming to deliver consistent and high-performing user experiences.
The growing adoption of these platforms highlights the industry's focus on standardization and enhanced functionality to meet evolving consumer expectations. Both webOS and Roku OS, each capturing a mid-single-digit share, focus on delivering an intuitive user interface and maximizing ad revenues. Amazon's Fire OS, a derivative of Android, powers both Amazon's streaming sticks and select third-party devices, with a clear emphasis on advertising monetization. Notably, smaller brands are increasingly leaning towards Roku OS or Fire OS, sidestepping the need for in-house software development. This trend is gaining momentum in emerging markets, where rapid market entry is prioritized over extensive product differentiation. The preference for these platforms among smaller brands underscores the importance of cost efficiency and faster time-to-market in competitive and resource-constrained environments.
As living rooms evolve and 100-inch class prices decline, panels exceeding 66 inches are witnessing a 5.21% CAGR. Omdia forecasts an increase in units of 80 inches and above, projecting 13 million by 2029, a rise from 9 million in 2025. This growth is driven by consumer demand for larger screens that enhance the viewing experience, particularly in home entertainment setups. In 2025, Samsung, Hisense, and TCL introduced 115-inch models, targeting both home-theater enthusiasts and commercial venues that previously relied on projectors. These larger screens are increasingly appealing to consumers seeking immersive experiences and businesses aiming to upgrade their display solutions. The 46-55-inch segment, commanding a 32.16% share in 2025, continues to dominate, striking a balance between price and viewing distance.
The 46-55-inch segment remains popular among households due to its affordability and suitability for average living room dimensions. Meanwhile, with improving yields, 65-inch sets are increasingly being offered at entry-level prices, encouraging households to upgrade to larger screens. Sub-32-inch screens, on the other hand, maintain their presence in kitchens, bedrooms, and hospitality settings, where space and budget limitations dictate size. These smaller screens cater to niche applications, ensuring their relevance in specific use cases despite the growing preference for larger displays.
Complete Report Scope:
- By Device
- Smart TV
- 4K and UHD Smart TV
- 8K Smart TV
- HD/FHD Smart TV
- Streaming Media Player
- Gaming Console (Streaming Enabled)
- Smart TV
- By Operating System
- Android TV / Google TV
- Tizen
- webOS
- Roku OS
- Fire OS
- By Screen Size
- Up to 32 inch
- 33-45 inch
- 46-55 inch
- 56-65 inch
- Above 66 inch
- By Resolution
- 4K UHD
- 8K
- FHD and HD
- By Panel Technology
- LED / Mini-LED
- OLED
- QLED
- By Distribution Channel
- Online
- Offline (Speciality, Mass-Retail)
- By End-Use
- Residential
- Commercial (Hospitality, Education, Corp-Lobby, Digital-Signage)
- Geography
- North America
- United States
- Canada
- Mexico
- Europe
- Germany
- United Kingdom
- France
- Italy
- Spain
- Rest of Europe
- Asia Pacific
- China
- Japan
- South Korea
- India
- South East Asia
- Australia
- Rest of Asia Pacific
- South America
- Brazil
- Rest of South America
- Middle East
- United Arab Emirates
- Saudi Arabia
- Rest of Middle East
- Africa
- South Africa
- Rest of Africa
- North America
Geography Analysis
Asia Pacific owned 44.53% market share in 2025 thanks to China's output scale, India's operator subsidies, and South Korea's premium leadership. Chinese brands such as Xiaomi, Haier, and TCL priced aggressively at home while exporting to stabilize factory loads. Reliance Jio and Airtel's bundles drove penetration beyond tier-1 cities in India. South Korea commanded outsized OLED and QLED revenue through proprietary panels and operating systems.
The Middle East and Africa is set for the fastest 5.72% CAGR as United Arab Emirates and Saudi Arabia fibre rollouts remove bandwidth bottlenecks. Government broadband initiatives under Saudi Vision 2030 stimulate UHD streaming and large-screen uptake. North America stays high value due to advertising yield. Comscore counted 96.4 million connected-TV households in 2025, and OpenAP plus CFlight now let advertisers buy across platforms with de-duplicated reach metrics, moving budgets from linear TV.
Europe grapples with strict energy rules throttling 8K and ultra-bright panels. Yet Nordic nations, with fiber penetration above 90% in Sweden and strong streaming subscriptions across Norway, Sweden, and Denmark, enjoy robust UHD take-up. South America and Africa remain entry-level smart-TV territories. Urbanization and mobile-broadband expansion open opportunities, but price sensitivity and weaker distribution limit premium penetration for now.
- Samsung Electronics Co. Ltd.
- LG Electronics Inc.
- TCL Technology Group Corp.
- Hisense Group Co. Ltd.
- Sony Group Corporation
- Vizio Inc.
- Skyworth Group Ltd.
- Panasonic Holdings Corp.
- Sharp Corp.
- Xiaomi Corp.
- Haier Group Corp.
- Amazon.com Inc. (Fire TV)
- Apple Inc. (Apple TV)
- Roku Inc.
- Alphabet Inc. (Chromecast / Google TV)
- Philips (TPV Technology)
- Vestel Elektronik Sanayi ve Ticaret A.S.
- Funai Electric Co. Ltd.
- Konka Group Co. Ltd.
- Nvidia Corp. (Shield TV)
- Huawei Technologies Co. Ltd.
- Alibaba Group (Tmall Magic Box)
- Realme (BBK Electronics)
- OnePlus Technology (Shenzhen) Co. Ltd.
Additional Benefits:
- The market estimate (ME) sheet in Excel format
- 3 months of analyst support
TABLE OF CONTENTS
1 INTRODUCTION
- 1.1 Study Assumptions and Market Definition
- 1.2 Scope of the Study
2 RESEARCH METHODOLOGY
3 EXECUTIVE SUMMARY
4 MARKET LANDSCAPE
- 4.1 Market Overview
- 4.2 Market Drivers
- 4.2.1 Proliferation of Ad-Supported FAST Channels Elevating ARPU in North America
- 4.2.2 Subsidised Operator-Bundled Smart TVs Accelerating First-Time Adoption in India and Indonesia
- 4.2.3 On-Device GenAI Upscaling Spurs 4K Upgrade Cycle in China and South Korea
- 4.2.4 Household Fibre Roll-outs Above 100 Mbps Boosting UHD Streaming in Nordics
- 4.2.5 Advertising Measurement Standardisation (OpenAP, CFlight) Driving Brand Budgets to CTV in US
- 4.2.6 Cloud-Rendered Gaming Partnerships Creating New Use-Cases
- 4.3 Market Restraints
- 4.3.1 Fragmented CTV OS Ecosystem Escalates App Porting and QA Costs for OTT Providers
- 4.3.2 Restrictive EU Energy-Efficiency Caps Curb 8K Panel Shipments
- 4.3.3 Persistent Mid-Tier TV SoC Shortages Inflating BOM Costs
- 4.3.4 Heightened Consumer Data-Privacy Scrutiny Limits Cross-Device Targeting
- 4.4 Impact of Macroeconomic Factors on the Market
- 4.5 Industry Supply Chain Analysis
- 4.6 Regulatory Landscape
- 4.7 Technological Outlook
- 4.8 Porter's Five Forces Analysis
- 4.8.1 Bargaining Power of Suppliers
- 4.8.2 Bargaining Power of Buyers
- 4.8.3 Threat of New Entrants
- 4.8.4 Threat of Substitutes
- 4.8.5 Intensity of Competitive Rivalry
- 4.9 Industry Stakeholder Analysis
5 MARKET SIZE AND GROWTH FORECASTS (VALUES)
- 5.1 By Device
- 5.1.1 Smart TV
- 5.1.1.1 4K and UHD Smart TV
- 5.1.1.2 8K Smart TV
- 5.1.1.3 HD/FHD Smart TV
- 5.1.2 Streaming Media Player
- 5.1.3 Gaming Console (Streaming Enabled)
- 5.1.1 Smart TV
- 5.2 By Operating System
- 5.2.1 Android TV / Google TV
- 5.2.2 Tizen
- 5.2.3 webOS
- 5.2.4 Roku OS
- 5.2.5 Fire OS
- 5.3 By Screen Size
- 5.3.1 Up to 32 inch
- 5.3.2 33-45 inch
- 5.3.3 46-55 inch
- 5.3.4 56-65 inch
- 5.3.5 Above 66 inch
- 5.4 By Resolution
- 5.4.1 4K UHD
- 5.4.2 8K
- 5.4.3 FHD and HD
- 5.5 By Panel Technology
- 5.5.1 LED / Mini-LED
- 5.5.2 OLED
- 5.5.3 QLED
- 5.6 By Distribution Channel
- 5.6.1 Online
- 5.6.2 Offline (Speciality, Mass-Retail)
- 5.7 By End-Use
- 5.7.1 Residential
- 5.7.2 Commercial (Hospitality, Education, Corp-Lobby, Digital-Signage)
- 5.8 Geography
- 5.8.1 North America
- 5.8.1.1 United States
- 5.8.1.2 Canada
- 5.8.1.3 Mexico
- 5.8.2 Europe
- 5.8.2.1 Germany
- 5.8.2.2 United Kingdom
- 5.8.2.3 France
- 5.8.2.4 Italy
- 5.8.2.5 Spain
- 5.8.2.6 Rest of Europe
- 5.8.3 Asia Pacific
- 5.8.3.1 China
- 5.8.3.2 Japan
- 5.8.3.3 South Korea
- 5.8.3.4 India
- 5.8.3.5 South East Asia
- 5.8.3.6 Australia
- 5.8.3.7 Rest of Asia Pacific
- 5.8.4 South America
- 5.8.4.1 Brazil
- 5.8.4.2 Rest of South America
- 5.8.5 Middle East
- 5.8.5.1 United Arab Emirates
- 5.8.5.2 Saudi Arabia
- 5.8.5.3 Rest of Middle East
- 5.8.6 Africa
- 5.8.6.1 South Africa
- 5.8.6.2 Rest of Africa
- 5.8.1 North America
6 COMPETITIVE LANDSCAPE
- 6.1 Market Concentration
- 6.2 Strategic Moves (M&A, JV, Licensing, Content Bundling)
- 6.3 Market Share Analysis
- 6.3.1 Global Connected TV Unit Shares
- 6.3.2 Smart TV Vendor Share Analysis
- 6.3.3 Streaming Media Player Vendor Share Analysis
- 6.4 Company Profiles (includes Global-Level Overview, Market-Level Overview, Core Segments, Financials as Available, Strategic Information, Market Rank / Share, Products and Services, Recent Developments)
- 6.4.1 Samsung Electronics Co. Ltd.
- 6.4.2 LG Electronics Inc.
- 6.4.3 TCL Technology Group Corp.
- 6.4.4 Hisense Group Co. Ltd.
- 6.4.5 Sony Group Corporation
- 6.4.6 Vizio Inc.
- 6.4.7 Skyworth Group Ltd.
- 6.4.8 Panasonic Holdings Corp.
- 6.4.9 Sharp Corp.
- 6.4.10 Xiaomi Corp.
- 6.4.11 Haier Group Corp.
- 6.4.12 Amazon.com Inc. (Fire TV)
- 6.4.13 Apple Inc. (Apple TV)
- 6.4.14 Roku Inc.
- 6.4.15 Alphabet Inc. (Chromecast / Google TV)
- 6.4.16 Philips (TPV Technology)
- 6.4.17 Vestel Elektronik Sanayi ve Ticaret A.S.
- 6.4.18 Funai Electric Co. Ltd.
- 6.4.19 Konka Group Co. Ltd.
- 6.4.20 Nvidia Corp. (Shield TV)
- 6.4.21 Huawei Technologies Co. Ltd.
- 6.4.22 Alibaba Group (Tmall Magic Box)
- 6.4.23 Realme (BBK Electronics)
- 6.4.24 OnePlus Technology (Shenzhen) Co. Ltd.
7 MARKET OPPORTUNITIES AND FUTURE OUTLOOK
- 7.1 White-Space and Unmet-Need Assessment

 聯網電視廣告服務:市場佔有率分析、產業趨勢與統計及成長預測(2026-2031 年)聯網電視廣告:市佔率分析、產業趨勢與統計及成長預測(2026-2031 年)
 2026年全球可尋址電視廣告市場報告
 聯網電視市場規模、佔有率和趨勢分析報告:按螢幕大小、技術、分銷管道、地區和細分市場預測(2026-2033 年)2026年全球可尋址線性電視(TV)市場報告2026年全球免費廣告支援串流電視(FAST)市場報告
 聯網電視市場分析及預測(至2035年):按類型、產品類型、服務、技術、組件、應用、形式、設備、最終用戶和功能分類2026年全球連網電視市場報告
 聯網電視市場規模、佔有率及成長分析(按螢幕大小、技術、螢幕類型、解析度、作業系統、連線功能、智慧功能和地區)-2025-2032 年產業預測
 連網電視市場機會、成長動力、產業趨勢分析及 2025-2034 年預測