

 |
市場調查報告書
商品編碼
1699423
連網電視市場機會、成長動力、產業趨勢分析及 2025-2034 年預測Connected TV Market Opportunity, Growth Drivers, Industry Trend Analysis, and Forecast 2025-2034 |
||||||
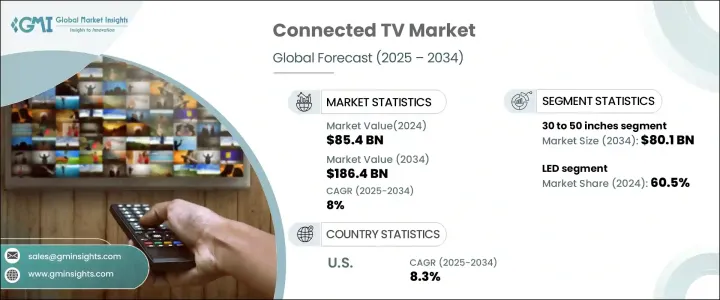
2024 年全球連網電視市場價值為 854 億美元,預計 2025 年至 2034 年期間將以 8% 的強勁複合年成長率擴張。這一穩定成長得益於 Netflix、Hulu、Amazon Prime Video 和 Disney+ 等串流平台的日益普及。隨著越來越多的消費者放棄傳統的有線和衛星訂閱,轉而選擇點播數位內容,連網電視已成為現代家庭娛樂的首選媒介。高速網路的日益普及和智慧家庭生態系統的日益普及進一步加速了市場擴張。憑藉 4K 和 8K 解析度、語音助理整合和人工智慧驅動的內容推薦等增強功能,連網電視正在徹底改變用戶獲取娛樂的方式,提供無縫和個人化的觀看體驗。
向基於網際網路的電視消費的轉變改變了電視行業,推動了製造商和科技公司的大量投資。隨著消費者尋求與其他智慧家庭產品無縫整合的功能豐富的設備,智慧電視的普及率正在上升。人工智慧和機器學習的進步使連網電視能夠提供客製化的內容推薦,最佳化觀看體驗。同時,串流媒體服務供應商繼續透過獨家內容擴展其產品範圍,進一步吸引消費者投資高品質的智慧電視。預計這些趨勢將維持市場的上升趨勢,鞏固連網電視在娛樂領域的主導地位。
| 市場範圍 | |
|---|---|
| 起始年份 | 2024 |
| 預測年份 | 2025-2034 |
| 起始值 | 854億美元 |
| 預測值 | 1864億美元 |
| 複合年成長率 | 8% |
市場根據螢幕尺寸進行細分,其中 30 至 50 吋類別的收入領先。 2024 年該細分市場的價值為 354 億美元,預計到 2034 年將達到 801 億美元,成為家庭最喜歡的選擇。這種螢幕尺寸在價格實惠和沈浸式觀看體驗之間達到了最佳平衡,滿足了多樣化的消費者群體。隨著串流平台提供更多 4K 超高清內容,對此類電視的需求持續成長。中型智慧電視在城市家庭中尤其受歡迎,因為空間有限,需要緊湊而高品質的娛樂解決方案。
從技術角度來看,基於 LED 的連網電視佔據主導市場佔有率,到 2024 年將達到 60.5%。這些電視因其節能、耐用和成本效益而仍然是首選。各種價位和螢幕尺寸的 LED 電視廣泛普及,使得不同收入群體的消費者都能夠輕鬆購買。同時,OLED 技術以其深黑色、高對比度和鮮豔色彩等卓越畫質而聞名,並繼續受到高階買家的青睞。儘管價格較高,但隨著消費者對高階家庭娛樂系統的興趣日益濃厚,OLED 顯示器的普及率有望不斷提高。
美國連網電視市場年複合成長率為 8.3%,反映出消費者對先進、技術精湛的娛樂設備的強勁需求。 4K 和 8K HDR 支援、與 Alexa、Google Assistant 和 Siri 等語音助理的無縫整合以及增強的智慧家庭連接等功能使聯網電視成為現代家庭的重要組成部分。高速寬頻的日益普及和獨家串流媒體內容庫的不斷擴大進一步促進了市場的成長。隨著越來越多的消費者重視便利性、功能性和優質的觀看體驗,連網電視的需求預計將持續上升,鞏固其作為未來家庭娛樂的地位。
目錄
第1章:方法論與範圍
- 市場範圍和定義
- 基礎估算與計算
- 預測參數
- 資料來源
- 基本的
- 次要
- 付費來源
- 公共資源
第2章:執行摘要
第3章:行業洞察
- 產業生態系統分析
- 影響價值鏈的因素
- 利潤率分析
- 中斷
- 未來展望
- 製造商
- 經銷商
- 零售商
- 衝擊力
- 成長動力
- 串流媒體平台日益普及
- 技術進步
- 各地區網路普及率不斷提高
- 智慧家庭整合趨勢日益成長
- 產業陷阱與挑戰
- 內容碎片化
- 網路依賴
- 成長動力
- 消費者購買行為分析
- 人口趨勢
- 影響購買決策的因素
- 消費者產品採用
- 首選配銷通路
- 首選價格範圍
- 成長潛力分析
- 監管格局
- 定價分析
- 波特的分析
- PESTEL分析
第4章:競爭格局
- 介紹
- 公司市佔率分析
- 競爭定位矩陣
- 戰略展望矩陣
第5章:市場估計與預測:按螢幕尺寸類型,2021 年至 2034 年
- 主要趨勢
- 小於 30 英寸
- 30英寸至50英寸
- 50英寸至70英寸
- 70吋以上
第6章:市場估計與預測:依技術,2021-2034 年
- 主要趨勢
- 引領
- OLED
- 其他
第7章:市場估計與預測:依螢幕尺寸,2021-2034
- 主要趨勢
- 彎曲
- 平坦的
第8章:市場估計與預測:依決議,2021-2034 年
- 主要趨勢
- 8K
- 4K
- 1080p
- 其他
第9章:市場估計與預測:依最終用途,2021-2034
- 主要趨勢
- 住宅
- 商業的
第 10 章:市場估計與預測:按配銷通路,2021-2034 年
- 主要趨勢
- 線上
- 離線
第 11 章:市場估計與預測:按地區,2021 年至 2034 年
- 主要趨勢
- 北美洲
- 美國
- 加拿大
- 歐洲
- 英國
- 德國
- 法國
- 義大利
- 西班牙
- 亞太地區
- 中國
- 日本
- 印度
- 韓國
- 澳洲
- 拉丁美洲
- 巴西
- 墨西哥
- MEA
- 南非
- 沙烏地阿拉伯
- 阿拉伯聯合大公國
第12章:公司簡介
- Amazon
- Apple
- Hisense Group
- LG Electronics
- Panasonic Corporation
- Philips
- Roku, Inc.
- Samsung Electronics
- Sharp Corporation
- Skyworth Group
- Sony Corporation
- TCL Technology
- Vizio Inc.
- Xiaomi Corporation
The Global Connected TV Market was valued at USD 85.4 billion in 2024 and is projected to expand at a robust CAGR of 8% from 2025 to 2034. This steady growth is fueled by the surging popularity of streaming platforms such as Netflix, Hulu, Amazon Prime Video, and Disney+. As more consumers shift away from traditional cable and satellite subscriptions in favor of on-demand digital content, connected TVs have become the preferred medium for modern home entertainment. The increasing availability of high-speed internet and the growing adoption of smart home ecosystems further accelerate market expansion. With enhanced features such as 4K and 8K resolution, voice assistant integration, and AI-driven content recommendations, connected TVs are revolutionizing how users access entertainment, providing a seamless and personalized viewing experience.
The shift toward internet-based television consumption has transformed the TV industry, driving significant investments from manufacturers and tech companies. Smart TV penetration is rising as consumers seek feature-rich devices that integrate seamlessly with other smart home products. Advancements in artificial intelligence and machine learning enable connected TVs to offer tailored content recommendations, optimizing the viewing experience. Meanwhile, streaming service providers continue to expand their offerings with exclusive content, further enticing consumers to invest in high-quality smart TVs. These trends are expected to sustain the market's upward trajectory, solidifying the dominance of connected TVs in the entertainment sector.
| Market Scope | |
|---|---|
| Start Year | 2024 |
| Forecast Year | 2025-2034 |
| Start Value | $85.4 Billion |
| Forecast Value | $186.4 Billion |
| CAGR | 8% |
The market is segmented based on screen size, with the 30 to 50-inch category leading in revenue. Valued at USD 35.4 billion in 2024, this segment is projected to reach USD 80.1 billion by 2034, making it the most preferred choice for households. This screen size strikes an optimal balance between affordability and immersive viewing, catering to a diverse consumer base. With streaming platforms offering more 4K Ultra HD content, the demand for televisions in this category continues to grow. Mid-sized smart TVs are particularly popular in urban homes, where space constraints require a compact yet high-quality entertainment solution.
From a technology standpoint, LED-based connected TVs hold the dominant market share, accounting for 60.5% in 2024. These TVs remain a top choice due to their energy efficiency, durability, and cost-effectiveness. The widespread availability of LED TVs in various price ranges and screen sizes makes them highly accessible to consumers across different income groups. Meanwhile, OLED technology, known for delivering superior picture quality with deep blacks, high contrast, and vibrant colors, continues to gain traction among premium buyers. Despite its higher price point, OLED displays are expected to see increasing adoption, driven by growing consumer interest in high-end home entertainment systems.
U.S. Connected TV Market is witnessing an annual CAGR of 8.3%, reflecting strong consumer demand for advanced, tech-savvy entertainment devices. Features such as 4K and 8K HDR support, seamless integration with voice assistants like Alexa, Google Assistant, and Siri, and enhanced smart home connectivity make connected TVs an essential part of modern households. The growing penetration of high-speed broadband and expanding library of exclusive streaming content further contribute to market growth. As more consumers prioritize convenience, functionality, and premium viewing experiences, the demand for connected TVs is expected to rise consistently, cementing their role as the future of home entertainment.
Table of Contents
Chapter 1 Methodology & Scope
- 1.1 Market scope & definition
- 1.2 Base estimates & calculations
- 1.3 Forecast parameters
- 1.4 Data sources
- 1.4.1 Primary
- 1.5 Secondary
- 1.5.1.1 Paid sources
- 1.5.1.2 Public sources
Chapter 2 Executive Summary
- 2.1 Industry synopsis, 2021 - 2034
Chapter 3 Industry Insights
- 3.1 Industry ecosystem analysis
- 3.1.1 Factor affecting the value chain
- 3.1.2 Profit margin analysis
- 3.1.3 Disruptions
- 3.1.4 Future outlook
- 3.1.5 Manufacturers
- 3.1.6 Distributors
- 3.1.7 Retailers
- 3.2 Impact forces
- 3.2.1 Growth drivers
- 3.2.1.1 Growing popularity of streaming platforms
- 3.2.1.2 Technological advancements
- 3.2.1.3 Increasing internet penetration across regions
- 3.2.1.4 Growing smart home integration trends
- 3.2.2 Industry pitfalls & challenges
- 3.2.2.1 Content fragmentation
- 3.2.2.2 Internet dependency
- 3.2.1 Growth drivers
- 3.3 Consumer buying behavior analysis
- 3.3.1 Demographic trends
- 3.3.2 Factors affecting buying decision
- 3.3.3 Consumer product adoption
- 3.3.4 Preferred distribution channel
- 3.3.5 Preferred price range
- 3.4 Growth potential analysis
- 3.5 Regulatory landscape
- 3.6 Pricing analysis
- 3.7 Porter's analysis
- 3.8 PESTEL analysis
Chapter 4 Competitive Landscape, 2024
- 4.1 Introduction
- 4.2 Company market share analysis
- 4.3 Competitive positioning matrix
- 4.4 Strategic outlook matrix
Chapter 5 Market Estimates and Forecast, By Screen Size, 2021 – 2034 (USD Billion) (Thousand Units)
- 5.1 Key trends
- 5.2 Less than 30 inches
- 5.3 30 inches to 50 inches
- 5.4 50 inches to 70 inches
- 5.5 Above 70 inches
Chapter 6 Market Estimates & Forecast, By Technology, 2021-2034 (USD Billion) (Thousand Units)
- 6.1 Key trends
- 6.2 LED
- 6.3 OLED
- 6.4 Others
Chapter 7 Market Estimates & Forecast, By Screen Type, 2021-2034 (USD Billion) (Thousand Units)
- 7.1 Key trends
- 7.2 Curved
- 7.3 Flat
Chapter 8 Market Estimates & Forecast, By Resolution, 2021-2034 (USD Billion) (Thousand Units)
- 8.1 Key trends
- 8.2 8K
- 8.3 4K
- 8.4 1080p
- 8.5 Others
Chapter 9 Market Estimates & Forecast, By End Use, 2021-2034 (USD Billion) (Thousand Units)
- 9.1 Key trends
- 9.2 Residential
- 9.3 Commercial
Chapter 10 Market Estimates & Forecast, By Distribution Channel, 2021-2034 (USD Billion) (Thousand Units)
- 10.1 Key trends
- 10.2 Online
- 10.3 Offline
Chapter 11 Market Estimates & Forecast, By Region, 2021 – 2034, (USD Billion) (Thousand Units)
- 11.1 Key trends
- 11.2 North America
- 11.2.1 U.S.
- 11.2.2 Canada
- 11.3 Europe
- 11.3.1 UK
- 11.3.2 Germany
- 11.3.3 France
- 11.3.4 Italy
- 11.3.5 Spain
- 11.4 Asia Pacific
- 11.4.1 China
- 11.4.2 Japan
- 11.4.3 India
- 11.4.4 South Korea
- 11.4.5 Australia
- 11.5 Latin America
- 11.5.1 Brazil
- 11.5.2 Mexico
- 11.6 MEA
- 11.6.1 South Africa
- 11.6.2 Saudi Arabia
- 11.6.3 UAE
Chapter 12 Company Profiles (Business Overview, Financial Data, Product Landscape, Strategic Outlook, SWOT Analysis)
- 12.1 Amazon
- 12.2 Apple
- 12.3 Google
- 12.4 Hisense Group
- 12.5 LG Electronics
- 12.6 Panasonic Corporation
- 12.7 Philips
- 12.8 Roku, Inc.
- 12.9 Samsung Electronics
- 12.10 Sharp Corporation
- 12.11 Skyworth Group
- 12.12 Sony Corporation
- 12.13 TCL Technology
- 12.14 Vizio Inc.
- 12.15 Xiaomi Corporation
 2026年全球可尋址線性電視(TV)市場報告2026年全球免費廣告支援串流電視(FAST)市場報告
 聯網電視市場分析及預測(至2035年):按類型、產品類型、服務、技術、組件、應用、形式、設備、最終用戶和功能分類2026年全球連網電視市場報告
 聯網電視市場規模、佔有率、趨勢分析報告:按螢幕尺寸、分佈、技術、地區、細分市場預測,2025-2030 年
 聯網電視市場規模、佔有率及成長分析(按螢幕大小、技術、螢幕類型、解析度、作業系統、連線功能、智慧功能和地區)-2025-2032 年產業預測
 聯網電視-市場佔有率分析、產業趨勢與統計、成長預測(2025-2030 年)
 聯網電視市場:全球產業分析,規模,佔有率,成長,趨勢,預測,2024年~2031年