


 |
市場調查報告書
商品編碼
2117632
綠色氨肥:市場佔有率分析、產業趨勢與統計、成長預測(2026-2031)Green Ammonia Fertilizer - Market Share Analysis, Industry Trends & Statistics, Growth Forecasts (2026 - 2031) |
||||||

※ 本網頁內容可能與最新版本有所差異。詳細情況請與我們聯繫。
根據Mordor Intelligence預測,綠色氨肥市場規模將從2025年的28億美元成長到2026年的29.7億美元,到2031年達到39.7億美元。 2026年至2031年預測期間的複合年成長率預計為6.0%。
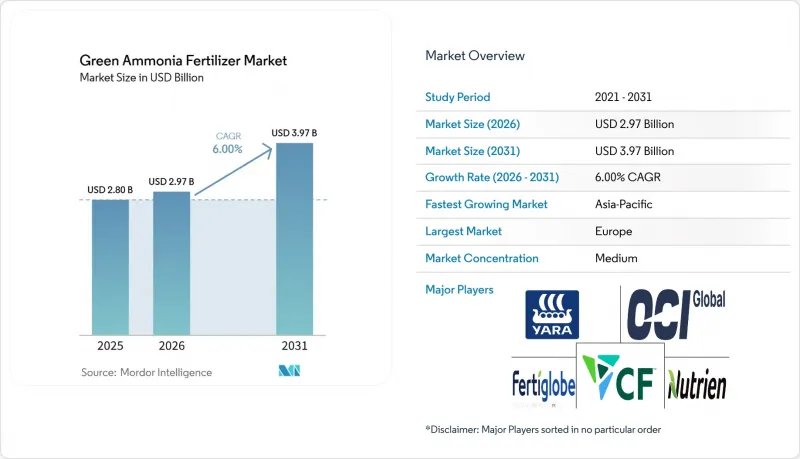
本報告按肥料類型(綠色氨、綠色尿素及其他)、生產技術(電解氫基、生質能氣化基及其他)、形態(固體和液體)、作物類型(田間作物、園藝作物及其他)和地區(北美、南美及其他)進行細分。市場預測以價值(美元)和數量(噸)表示。
全球綠色氨肥市場趨勢及洞察
強制使用碳中和肥料
具有法律約束力的排放法規正將低碳氮肥的採購從可選項轉變為多個農業供應鏈中的合約要求。歐盟2021-2030年排放佔有率條例(ESR)要求成員國減少排放交易體系(ETS)未涵蓋產業的溫室氣體排放,包括農業,促使化肥買家要求採購經認證的低排放投入品。這項政策轉變也提升了可追溯性的重要性,因為買家越來越要求對整個生命週期檢驗,而不僅僅是基於抵銷額的聲明。這有利於大規模生產商和更一體化的價值鏈。日本2024年《氫能社會促進法》透過支持進口並建立長期合約的政策框架,正在東亞地區形成類似的需求模式。因此,合規標準正在影響整個綠色氨肥市場的上游投資決策。
可再生能源在發電廠的成本平價
由於再生能源和電解槽成本的不斷上漲,電解氨生產與傳統氨生產之間的商業性差距正在縮小。國際能源總署(IEA)在其2025年全球氫能展望報告中指出,2024年中國以外地區電解槽的安裝成本預計在每千瓦2000至2600美元之間。這項成本優勢有利於能夠連接可靠可再生能源電網的項目,因為這些項目既能實現低營運成本,又能獲得更優異的排放性能。在2025年MDPI會議上提出的靈活生產模型也表明,在最佳化的風能和風光互補系統中,未來的氨成本將顯著降低,這支持了隨著項目規模擴大和系統設計日趨成熟,成本競爭力將不斷提升的觀點。隨著成本差距的縮小,綠色氨肥市場對政策支持的依賴將降低,商業可行性也將增強。
大規模電解槽和合成生產線是高度資本密集的。
大規模綠色氨肥廠建設成本高昂,仍是加速擴大供應的最大障礙。國際能源總署(IEA)2025年報告稱,儘管到2030年全球整體計劃建設520吉瓦的電解槽項目,但僅有4%的項目最終確定投資或開工建設。這意義重大,因為綠色氨肥計畫通常需要3-5年時間,而建設期間碳定價或補貼政策的變化可能會在投產前降低盈利。在新興市場,由於長期專案融資有限以及主權風險溢價導致資金籌措成本上升,融資難度更高。因此,長期啟動協議、政策穩定性和建設期間的風險支援對於專案進展至關重要。
細分市場分析
到2025年,綠色氨肥將佔市場收入的46.0%,成為綠色肥料市場中最大的產品類別。其主導地位得益於與現有哈伯-博世法生產設施、氨碼頭以及傳統氮肥行業廣泛使用的處理基礎設施的兼容性。這些成熟的基礎設施使得低排放氨的引入無需對現有生產和物流網路進行重大改造,從而降低了買家的轉型成本。綠色氨在非農業領域也備受青睞;其作為船用燃料的用途開闢了新的銷售管道,有助於在農業需求低迷時期提高資產利用率。
預計2026年至2031年間,綠色氨的複合年成長率將達到6.8%,隨著相關綠色肥料類別的發展,其市場地位可望進一步鞏固。政府為促進低碳肥料生產和在肥料製造中使用綠色氨而採取的舉措,正在改善綠色尿素和其他永續氮肥產品的商業性前景。同時,肥料產品的成分正逐步從傳統的氮肥替代品擴展到更廣泛的低排放和循環營養解決方案。儘管產品種類日益豐富,但由於綠色氨同時供應給農業和工業終端用戶,預計它仍將繼續保持市場商業性基礎的地位。
到2025年,電解氫氣技術將佔原料技術銷售額的54.0%,成為綠色氨肥市場最大的佔有率。這一地位得益於其與零碳認證要求的直接契合,以及在美國、歐洲和日本獲得主要獎勵計劃的資格。此外,該技術受益於更成熟的認證機構、保險公司、工程公司和承購商生態系統,從而降低了大型專案的交易摩擦。選擇電解技術的開發商通常能夠更快地推進項目,因為交易對象對認證邏輯和資金籌措結構有更清晰的了解。生質能氣化生產在作物殘渣具有顯著區域原料優勢的市場中保持著一定的佔有率,尤其是在南亞和東南亞地區。
預計從2026年到2031年,廢棄物製氫將以10.0%的複合年成長率成長,成為成長最快的供應技術。這種方法之所以備受關注,是因為它將廢棄物管理和肥料脫碳整合到一個商業案例中,從而拓寬了該專案的可用資金來源。最大的機會在於那些廢棄物處理費和市政廢棄物處理義務收入能夠直接支持氫氣經濟可行性的地區。其他方法,例如等離子體輔助合成和電化學氮還原,仍處於早期階段,預計不會對綠色氨肥市場的短期供應做出貢獻;相反,它們應被視為長期技術選擇。
區域分析
到2025年,歐洲將佔據綠色肥料市場32.0%的佔有率,成為最大的市場區域。碳定價、更嚴格的進口責任以及買家更積極地為經認證的低排放氨和下游肥料支付更高價格,都支撐了歐洲的這一地位。碳邊境調節機制(CBAM)將於2026年1月全面投入運行,這將提升低排放肥料供應的相對競爭力,尤其對於長期依賴進口傳統氨的買家而言。此外,隨著生產商尋求減少對依賴俄羅斯天然氣的原料的依賴,並圍繞低碳資源重建供應鏈,歐洲仍然是一個重要的需求中心。
預計亞太地區在2026年至2031年間將以7.6%的複合年成長率成長,成為成長最快的地區。這一成長得益於印度、日本、韓國、中國和澳洲政府共同努力,在供應端創造需求並支持投資。 2026年6月,作為其國家綠色氫能計畫的一部分,印度透過印度太陽能公司(SECI)簽署了一份為期10年的契約,每年向該國11家化肥廠供應67萬噸綠色氨。日本正透過其價格支持框架促進區域擴張,該框架幫助跨境綠色氨計畫獲得銀行融資的出口需求。隨著沙烏地阿拉伯、阿拉伯聯合大公國和埃及將低成本可再生能源與面向歐洲和東亞買家的出口導向專案策略相結合,西亞的重要性也日益凸顯。
北美仍然是一個重要的商業性市場,美國的政策框架為清潔氫能和低碳氨計畫提供了更強大的財政支持和更清晰的投資前景。在南美,出口導向農業正在推動需求成長,尤其是在那些生產者和出口商必須使用檢驗的永續投入品才能進入高階市場的地區。非洲的計畫儲備規模雖小但值得關注,其中埃及和南非尤為突出,這兩個市場的資源品質和化肥需求足以支撐其長期擴張。俄羅斯市場發展仍然緩慢,低成本天然氣、清潔能源政策缺乏動力以及與西方技術合作管道有限等因素持續限制變革的步伐。
其他好處
- Excel格式的市場預測(ME)表
- 3個月的分析師支持
目錄
第1章:引言
- 研究假設和市場定義
- 調查範圍
第2章:調查方法
第3章執行摘要
第4章 市場狀況
- 市場概覽
- 市場促進因素
- 強制使用碳中和肥料
- 可再生能源在發電廠的成本平價
- 企業淨零排放農業採購
- 綠氫能的稅額扣抵和生產激勵措施
- 化肥貿易碳邊境調整面臨壓力
- 由於航運業脫碳,對氨燃料的需求正在擴大。
- 市場限制因素
- 大規模電解槽和合成生產線是高度資本密集的。
- 電網擁塞導致可再生能源購買協議延遲
- 乾旱生產區認證綠色水資源短缺
- 新型綠色肥料配方農業檢驗工作延誤
- 價值鍊和供應鏈分析
- 監理情勢
- 技術展望
- 波特五力分析
第5章 市場規模與成長預測
- 肥料類型
- 綠色氨氣
- 完全綠色的氨
- 混合綠色氨肥
- 綠色氨基生物綜合肥料
- 綠色尿素
- 其他肥料類型
- 綠色氨氣
- 透過製造技術
- 電解氫鹼
- 生質氣化基地
- 一種利用廢棄物製氫的方法
- 其他新技術
- 按形式
- 固體的
- 液體
- 按作物類型
- 田間作物
- 園藝作物
- 草坪和觀賞植物
- 按地區
- 北美洲
- 美國
- 加拿大
- 墨西哥
- 其他北美國家
- 南美洲
- 巴西
- 阿根廷
- 其他南美國家
- 歐洲
- 德國
- 法國
- 英國
- 義大利
- 西班牙
- 俄羅斯
- 其他歐洲國家
- 亞太地區
- 中國
- 日本
- 印度
- 韓國
- 澳洲和紐西蘭
- 其他亞太國家
- 中東
- 沙烏地阿拉伯
- 阿拉伯聯合大公國
- 土耳其
- 其他中東國家
- 非洲
- 南非
- 埃及
- 其他非洲地區
- 北美洲
第6章 競爭情勢
- 市場集中度
- 策略趨勢
- 市佔率分析
- 公司簡介
- Yara Clean Ammonia AS(Yara International ASA)
- CF Industries Holdings Inc.
- Nutrien Ltd.
- OCI Global(OCI NV)
- Fertiglobe PLC
- ACME Cleantech Solutions Private Limited(ACME Group)
- Air Products and Chemicals Inc.
- ENGIE SA
- Iberdrola SA
- thyssenkrupp Uhde GmbH(thyssenkrupp AG)
- Siemens Energy AG
- Nel ASA
- AmmPower Corp.
- Avina Clean Hydrogen Inc.
- Casale SA
- AM Green Ammonia India Private Limited(AM Green Group)
- Greenko Energy Holdings
- Fortescue Energy Pty Ltd
- Technip Energies NV
第7章 市場機會與未來展望
According to Mordor Intelligence, the green ammonia fertilizer market is anticipated to grow from USD 2.80 billion in 2025 to USD 2.97 billion in 2026, reaching USD 3.97 billion by 2031, at a CAGR of 6.0% during the forecast period 2026-2031.
This report is Segmented by Fertilizer Type (Green Ammonia, Green Urea, and More), by Source Technology (Electrolytic Hydrogen Based, Biomass Gasification Based, and More), by Form (Solid and Liquid), by Crop Type (Field Crops, Horticultural Crops, and More), and by Geography (North America, South America, and More). The Market Forecasts are Provided in Terms of Value (USD) and Volume (Metric Tons).
Global Green Ammonia Fertilizer Market Trends and Insights
Carbon-Neutral Fertilizer Mandates
Binding emissions regulations are shifting the low-carbon nitrogen procurement from a voluntary option to a contractual requirement in several agricultural supply chains. The European Union's (EU) Effort Sharing Regulation (ESR) 2021-2030 requires member states to reduce greenhouse gas emissions in non-Emissions Trading System sectors, including agriculture, pushing fertilizer buyers toward certified lower-emission inputs. This policy shift is also increasing the value of traceability, as buyers increasingly require lifecycle verification rather than offset-based claims alone, which favors larger producers and more integrated supply chains. Japan's Hydrogen Society Promotion Act of 2024 is creating a similar demand pattern in East Asia by supporting imports through a policy structure that enables long-term contracting. As a result, compliance standards are now shaping upstream investment decisions across the green ammonia fertilizer market.
Renewable Power Cost Parity in Production Hubs
Falling renewable electricity and electrolyzer costs are narrowing the commercial gap between electrolytic ammonia and conventional ammonia production. The International Energy Agency (IEA) reported in its 2025 Global Hydrogen Review that electrolyzer installation costs outside China ranged from USD 2,000 to USD 2,600 per kilowatt in 2024. The cost advantage favors projects with reliable renewable grid access, as they can combine lower operating costs with stronger emissions performance. Flexible production modeling published in 2025 in MDPI also indicated materially lower future ammonia costs under optimized wind and solar-wind hybrid systems, supporting the view that cost competitiveness will improve as projects scale and system design matures. As this cost gap narrows, the green ammonia fertilizer market becomes less dependent on policy support and more capable of expanding on a commercial basis.
High Capital Intensity of Large-Scale Electrolyzers and Synthesis Trains
The high cost of building large green ammonia fertilizer plants remains the most significant barrier to faster supply expansion. The International Energy Agency reported in 2025 that only 4% of the global electrolyzer pipeline planned for 2030 had reached final investment decision or begun construction, despite a project pipeline of 520 gigawatts. This is significant because green ammonia fertilizer projects typically have build periods of 3 to 5 years, meaning any changes in carbon pricing or subsidy rules during construction can weaken returns before production begins. Financing is more difficult in emerging markets, where long-tenor project debt is limited and sovereign risk premiums increase the effective cost of capital. Progress therefore depends on long-term offtake contracts, policy stability, and construction-period risk support.
Other drivers and restraints analyzed in the detailed report include:
- Corporate Net-Zero Farming Procurement
- Green-Hydrogen Tax Credits and Production Incentives
- Grid Congestion Delaying Renewable Power Purchase Agreements
For complete list of drivers and restraints, kindly check the Table Of Contents.
Segment Analysis
Green ammonia fertilizer accounted for 46.0% of market revenue in 2025, making it the largest product segment in the green fertilizer market. Its dominant position is supported by compatibility with existing Haber-Bosch production facilities, ammonia terminals, and handling infrastructure used across the conventional nitrogen fertilizer industry. This established infrastructure lowers the transition costs for buyers by enabling the adoption of lower-emission ammonia without requiring major changes to existing production and logistics networks. Green ammonia also benefits from demand beyond agriculture, as its use as a marine fuel provides an additional offtake channel that helps improve asset utilization during periods of slower agricultural demand.
Green ammonia is projected to grow at a CAGR of 6.8% between 2026 and 2031, further strengthening its position as related green fertilizer categories continue to evolve. Government initiatives promoting low-carbon fertilizer production and the use of green ammonia in fertilizer manufacturing are improving the commercial outlook for green urea and other sustainable nitrogen products. At the same time, the fertilizer product mix is gradually expanding beyond conventional nitrogen substitution toward a broader portfolio of low-emission and circular nutrient solutions. Despite this diversification, green ammonia is anticipated to remain the commercial anchor of the market because it serves both agricultural and industrial end users.
Electrolytic hydrogen-based production held 54.0% of source technology revenue in 2025, accounting for the largest share of the green ammonia fertilizer market. Its position is supported by direct alignment with zero-carbon certification requirements and eligibility for major incentive programs in the United States, Europe, and Japan. This pathway also benefits from a more mature ecosystem of certifiers, insurers, engineering providers, and offtakers, which reduces transaction friction for large projects. Developers that choose electrolytic routes are often able to move faster because counterparties have a clearer understanding of the certification logic and financing structure. Biomass gasification-based production retains a presence in markets where crop residues create strong local feedstock advantages, particularly across South and Southeast Asia.
Waste-to-hydrogen based production is anticipated to expand at a 10.0% CAGR between 2026 and 2031, making it the fastest-growing source technology. This route attracts interest because it combines waste management and fertilizer decarbonization within a single business case, which can broaden the pool of capital available to projects. The strongest opportunity exists in locations where tipping-fee revenue or municipal waste obligations can directly support hydrogen production economics. Other pathways, such as plasma-assisted synthesis and electrochemical nitrogen reduction, remain at an earlier stage and are better viewed as longer-term technology options rather than near-term volume contributors in the green ammonia fertilizer market.
Complete Report Scope:
- By Fertilizer Type
- Green Ammonia
- Fully Green Ammonia
- Blended Green Ammonia Fertilizers
- Green Ammonia Based Bio Integrated Fertilizers
- Green Urea
- Other Fertilizer Types
- Green Ammonia
- By Source Technology
- Electrolytic Hydrogen Based
- Biomass Gasification Based
- Waste-to-Hydrogen Based
- Other Emerging Technologies
- By Form
- Solid
- Liquid
- By Crop Type
- Field Crops
- Horticultural Crops
- Turf and Ornamental
- By Geography
- North America
- United States
- Canada
- Mexico
- Rest of North America
- South America
- Brazil
- Argentina
- Rest of South America
- Europe
- Germany
- France
- United Kingdom
- Italy
- Spain
- Russia
- Rest of Europe
- Asia- Pacific
- China
- Japan
- India
- South Korea
- Australia and New Zealand
- Rest of Asia-Pacific
- Middle East
- Saudi Arabia
- United Arab Emirates
- Turkey
- Rest of Middle East
- Africa
- South Africa
- Egypt
- Rest of Africa
- North America
Geography Analysis
Europe held 32.0% of the green fertilizer market share in 2025, making it the largest region. Europe's position is supported by carbon pricing, stricter import accountability, and greater willingness among buyers to pay for certified lower-emission ammonia and downstream fertilizers. The Carbon Border Adjustment Mechanism (CBAM) moved into its definitive phase in January 2026, which improves the relative competitiveness of low-emission fertilizer supply, particularly for buyers with long-term exposure to imported conventional ammonia. Europe also remains a significant demand center as producers seek to reduce dependence on Russian-gas-linked feedstocks and reposition their supply chains around low-carbon sources.
Asia-Pacific is anticipated to expand at a 7.6% CAGR between 2026 and 2031, making it the fastest-growing region. Growth is being driven by governments in India, Japan, South Korea, China, and Australia combining demand creation with supply-side investment support. In June 2026, India signed 10-year agreements through the Solar Energy Corporation of India (SECI) covering 670,000 metric tons per year of green ammonia supply for 11 domestic fertilizer plants under the National Green Hydrogen Mission. Japan is supporting regional expansion through price-support frameworks that help cross-border green ammonia projects secure bankable export demand. Western Asia is also gaining importance, as Saudi Arabia, the United Arab Emirates, and Egypt combine low-cost renewable resources with export-oriented project strategies targeting European and East Asian buyers.
North America remains commercially significant, as the United States policy framework provides clean hydrogen and low-carbon ammonia projects with stronger financial support and clearer investment visibility. South America is building demand through export agriculture, particularly where growers and exporters require verifiable sustainable input use to maintain access to premium markets. Africa has a smaller but notable project pipeline, with Egypt and South Africa standing out as markets where resource quality and fertilizer demand support a viable long-term case for expansion. Russia remains a slower market, as low-cost natural gas, limited clean-energy policy momentum, and reduced access to Western technology partnerships continue to constrain the pace of change.
- Yara Clean Ammonia AS (Yara International ASA)
- CF Industries Holdings Inc.
- Nutrien Ltd.
- OCI Global (OCI N.V.)
- Fertiglobe PLC
- ACME Cleantech Solutions Private Limited (ACME Group)
- Air Products and Chemicals Inc.
- ENGIE SA
- Iberdrola S.A.
- thyssenkrupp Uhde GmbH (thyssenkrupp AG)
- Siemens Energy AG
- Nel ASA
- AmmPower Corp.
- Avina Clean Hydrogen Inc.
- Casale SA
- AM Green Ammonia India Private Limited (AM Green Group)
- Greenko Energy Holdings
- Fortescue Energy Pty Ltd
- Technip Energies N.V.
Additional Benefits:
- The market estimate (ME) sheet in Excel format
- 3 months of analyst support
TABLE OF CONTENTS
1 INTRODUCTION
- 1.1 Study Assumptions and Market Definition
- 1.2 Scope of the Study
2 RESEARCH METHODOLOGY
3 EXECUTIVE SUMMARY
4 MARKET LANDSCAPE
- 4.1 Market Overview
- 4.2 Market Drivers
- 4.2.1 Carbon-neutral fertilizer mandates
- 4.2.2 Renewable power cost parity in production hubs
- 4.2.3 Corporate net-zero farming procurement
- 4.2.4 Green-hydrogen tax credits and production incentives
- 4.2.5 Carbon border adjustment pressure on fertilizer trade
- 4.2.6 Ammonia bunkering demand pull-through from maritime decarbonization
- 4.3 Market Restraints
- 4.3.1 High capital intensity of large-scale electrolyzers and synthesis trains
- 4.3.2 Grid congestion delaying renewable power purchase agreements
- 4.3.3 Scarcity of certified green water resources in arid production zones
- 4.3.4 Slow agronomic validation of novel green fertilizer formulations
- 4.4 Value Chain and Supply Chain Analysis
- 4.5 Regulatory Landscape
- 4.6 Technological Outlook
- 4.7 Porter's Five Forces Analysis
- 4.7.1 Bargaining Power of Suppliers
- 4.7.2 Bargaining Power of Buyers
- 4.7.3 Threat of New Entrants
- 4.7.4 Threat of Substitutes
- 4.7.5 Competitive Rivalry
5 MARKET SIZE AND GROWTH FORECASTS (VALUE AND VOLUME)
- 5.1 By Fertilizer Type
- 5.1.1 Green Ammonia
- 5.1.1.1 Fully Green Ammonia
- 5.1.1.2 Blended Green Ammonia Fertilizers
- 5.1.1.3 Green Ammonia Based Bio Integrated Fertilizers
- 5.1.2 Green Urea
- 5.1.3 Other Fertilizer Types
- 5.1.1 Green Ammonia
- 5.2 By Source Technology
- 5.2.1 Electrolytic Hydrogen Based
- 5.2.2 Biomass Gasification Based
- 5.2.3 Waste-to-Hydrogen Based
- 5.2.4 Other Emerging Technologies
- 5.3 By Form
- 5.3.1 Solid
- 5.3.2 Liquid
- 5.4 By Crop Type
- 5.4.1 Field Crops
- 5.4.2 Horticultural Crops
- 5.4.3 Turf and Ornamental
- 5.5 By Geography
- 5.5.1 North America
- 5.5.1.1 United States
- 5.5.1.2 Canada
- 5.5.1.3 Mexico
- 5.5.1.4 Rest of North America
- 5.5.2 South America
- 5.5.2.1 Brazil
- 5.5.2.2 Argentina
- 5.5.2.3 Rest of South America
- 5.5.3 Europe
- 5.5.3.1 Germany
- 5.5.3.2 France
- 5.5.3.3 United Kingdom
- 5.5.3.4 Italy
- 5.5.3.5 Spain
- 5.5.3.6 Russia
- 5.5.3.7 Rest of Europe
- 5.5.4 Asia- Pacific
- 5.5.4.1 China
- 5.5.4.2 Japan
- 5.5.4.3 India
- 5.5.4.4 South Korea
- 5.5.4.5 Australia and New Zealand
- 5.5.4.6 Rest of Asia-Pacific
- 5.5.5 Middle East
- 5.5.5.1 Saudi Arabia
- 5.5.5.2 United Arab Emirates
- 5.5.5.3 Turkey
- 5.5.5.4 Rest of Middle East
- 5.5.6 Africa
- 5.5.6.1 South Africa
- 5.5.6.2 Egypt
- 5.5.6.3 Rest of Africa
- 5.5.1 North America
6 COMPETITIVE LANDSCAPE
- 6.1 Market Concentration
- 6.2 Strategic Moves
- 6.3 Market Share Analysis
- 6.4 Company Profiles (Includes Global Level Overview, Market Level Overview, Core Segments, Financials as Available, Strategic Information, Market Rank/Share for Key Companies, Products and Services, and Recent Developments)
- 6.4.1 Yara Clean Ammonia AS (Yara International ASA)
- 6.4.2 CF Industries Holdings Inc.
- 6.4.3 Nutrien Ltd.
- 6.4.4 OCI Global (OCI N.V.)
- 6.4.5 Fertiglobe PLC
- 6.4.6 ACME Cleantech Solutions Private Limited (ACME Group)
- 6.4.7 Air Products and Chemicals Inc.
- 6.4.8 ENGIE SA
- 6.4.9 Iberdrola S.A.
- 6.4.10 thyssenkrupp Uhde GmbH (thyssenkrupp AG)
- 6.4.11 Siemens Energy AG
- 6.4.12 Nel ASA
- 6.4.13 AmmPower Corp.
- 6.4.14 Avina Clean Hydrogen Inc.
- 6.4.15 Casale SA
- 6.4.16 AM Green Ammonia India Private Limited (AM Green Group)
- 6.4.17 Greenko Energy Holdings
- 6.4.18 Fortescue Energy Pty Ltd
- 6.4.19 Technip Energies N.V.
7 MARKET OPPORTUNITIES AND FUTURE OUTLOOK

 2026年全球氨肥市場報告
 2026-2030年全球磷肥市場
 東南亞化肥市場:市佔率分析、產業趨勢與統計及成長預測(2026-2031年)
 化肥市場規模、佔有率、成長、全球產業分析、區域趨勢及2026-2034年預測。昆蟲衍生肥料市場規模、佔有率、成長、全球產業分析、區域趨勢及2026年至2034年預測。印尼化肥市場:市場佔有率分析、產業趨勢與統計、成長預測(2026-2031)全球昆蟲衍生肥料市場規模、佔有率、趨勢和成長分析報告(2026-2034)馬來西亞化肥市場:市場佔有率分析、產業趨勢與統計、成長預測(2026-2031)
 全球控釋肥料市場:按類型、施用方法、功能、產品等級、作物類型、配方和地區分類-預測至2031年2026年全球微粉化肥料市場報告