


 |
市場調查報告書
商品編碼
2116127
東南亞化肥市場:市佔率分析、產業趨勢與統計及成長預測(2026-2031年)Southeast Asia Fertilizer - Market Share Analysis, Industry Trends & Statistics, Growth Forecasts (2026 - 2031) |
||||||

※ 本網頁內容可能與最新版本有所差異。詳細情況請與我們聯繫。
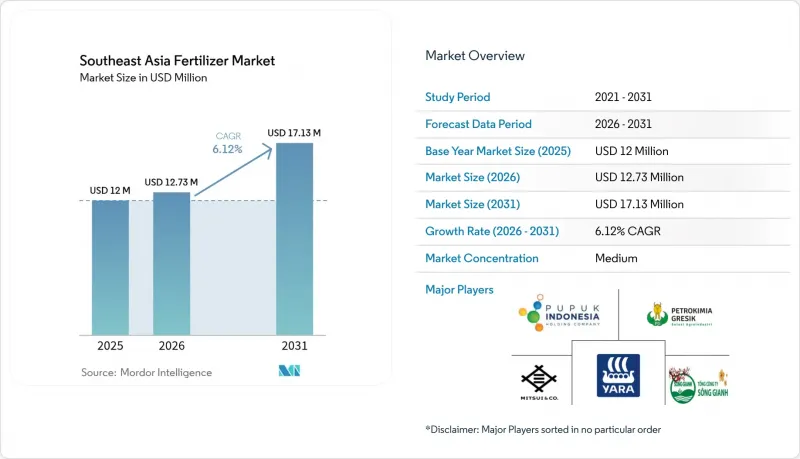
根據 Mordor Intelligence 預測,東南亞化肥市場規模將從 2025 年的 1,200 萬美元成長到 2026 年的 1,273 萬美元,然後在 2031 年達到 1,713 萬美元,2026 年至 2031 年的複合年成長率為 6.12%。
本報告按類型(氮肥、磷肥、鉀肥、次發性量元素、微量元素)、應用領域(穀類、油籽和豆類、其他)以及地區(馬來西亞、泰國、越南、菲律賓、印尼及其他東南亞國家)進行分類。市場預測以美元計價。
東南亞化肥市場趨勢與洞察
精密農業工具的普及
衛星影像、土壤感測器和變數施肥技術正在改變整個東南亞肥料市場的養分管理方式。泰國的「農業與合作社策略」包含智慧農業硬體的稅收優惠,加速了GPS導航噴灑器的普及,從而減少了高達15%的氮肥流失。在馬來西亞,油棕櫚種植園現在使用無人機繪製和檢查植物,並根據冠層生長情況調整鉀肥施用量;而在印度尼西亞,合作社正在實施人工智慧土壤診斷系統,該系統可以為每個地塊推薦最佳尿素施用量。隨著生產者成本和勞動力成本的降低,對與精密農業機械相容的顆粒肥料的需求正在成長。這種技術變革正在推動對與精準施肥設備相容的專用肥料配方的需求,從而為高效產品創造了商機。
高效肥料需求激增。
在越南,緩釋尿素的使用量在2024年成長了25%。這反映出該地區正轉向使用能夠減少季風氣候下揮發損失的產品。印尼一所大學報告稱,稻殼生物炭包覆處理可將氮釋放期延長至60天以上,並將吸收效率提高20%。在馬來西亞棕櫚油產業,緩釋複合肥的使用量正在增加,以應對人手不足並減少施肥頻率。馬來西亞棕櫚油生產商更傾向於使用聚合物包覆的混合肥料,這種肥料能夠顯著減少施肥頻率並緩解人手不足。不斷上漲的肥料成本,包括預計2025年2月尿素價格將達到每噸430美元,進一步加速了能夠提高養分利用率的高效肥料產品的普及。
農村地區貸款取得限制
菲律賓的小規模農戶每年向非正規貸款機構支付超過20%的利息,阻礙了他們及時購買化肥。越南的稻農往往缺乏足夠的抵押品來滿足銀行貸款的要求,而印尼的許多地區缺乏足夠的微型金融分店。馬來西亞棕櫚油產業的小規模農戶也面臨類似的挑戰,尤其是在投資高昂的特殊肥料方面。國際肥料發展中心(IFDC)指出,改善融資管道可以使化肥消費量每年成長16%,印尼的定向補貼計畫就證明了這一點。
細分市場分析
2025年,以尿素和硫酸銨為主的氮肥產品佔據東南亞化肥市場42.58%的佔有率。印尼最大的尿素生產商PT Pupuk Indonesia公司年尿素產能達940萬噸,確保了穩定的供應,以滿足該國的稻米生產目標。在越南和泰國,進口仍是補充需求的重要手段,尤其是在水稻生長旺季。儘管鉀肥採購存在風險,但泰國計劃建造的年產120萬噸的鉬酸鉀(MOP)工廠預計將在2028年前降低對進口的依賴。緩釋包膜肥料因其在雨季氣候下能提高養分利用效率,在精密農業平台中備受青睞,尤其適用於分階段施肥。預計緩釋包膜肥料的市佔率將進一步擴大。
在東南亞肥料市場,微量元素配方產品的市場規模預計到2031年將以8.95%的複合年成長率快速成長。這反映了生產商為解決普遍存在的鋅和硼缺乏問題所做的努力。專業供應商正利用螯合混合物來應對這一問題,這些混合物非常適合在熱帶土壤中固定,並且與精準噴霧器相容。隨著棕櫚油種植園追求更高的單株產量,次要大量元素(尤其是硫和鎂)的重要性日益凸顯。
其他好處
- Excel格式的市場預測(ME)表
- 3個月的分析師支持
目錄
第1章:引言
- 研究假設和市場定義
- 調查範圍
第2章:調查方法
第3章執行摘要
第4章 市場狀況
- 市場概覽
- 市場促進因素
- 精密農業工具的普及
- 高效肥料需求激增。
- 政府營養管理補貼計劃
- 擴大緩釋產品和特殊混合物的供應
- 利用數位孿生模型設定每塊田地的施肥量。
- 低排放量肥料的碳權獎勵
- 市場限制因素
- 農村地區貸款取得限制
- 氣候因素導致施肥不確定性
- 氨和鉀原料價格波動
- 區域城市物流基礎設施延誤
- 監理情勢
- 技術展望
- 波特五力分析
第5章 市場規模與成長預測
- 按類型
- 氮肥
- 尿素
- 硝酸銨鈣
- 氨
- 硝酸銨
- 硫酸銨
- 其他氮肥
- 磷肥
- 磷酸一銨
- 磷酸二銨
- 三重過磷酸鈣石灰
- 其他磷肥
- 鉀肥
- 氯化鉀
- 其他鉀肥
- 次發性大量營養元素
- 微量營養素
- 氮肥
- 透過使用
- 穀物和穀類
- 油籽/豆類
- 經濟作物
- 水果和蔬菜
- 其他
- 按地區
- 馬來西亞
- 泰國
- 越南
- 菲律賓
- 印尼
- 其他東南亞國家
第6章 競爭情勢
- 市場集中度
- 策略趨勢
- 市佔率分析
- 公司簡介
- PT Pupuk Indonesia(Persero)
- Yara International ASA
- PT Petrokimia Gresik
- Mitsui & Co., Ltd.(Thai Central Chemical PCL)
- Song Gianh Corporation
- Ninh Binh Phosphate Fertilizer JSC
- Southern Fertilizer JSC
- Nutrien Ltd.
- Farmcochem Group
- sak siam fertilizer global export company limited(Saksiam Group)
- ICL Group Ltd.(Israel Corporation)
- Haifa Negev technologies LTD
- EuroChem Group(AIM Capital SE)
- K+S Aktiengesellschaft
第7章 市場機會與未來展望
According to Mordor Intelligence, the Southeast Asia fertilizer market size is expected to grow from USD 12 million in 2025 to USD 12.73 million in 2026 and is forecast to reach USD 17.13 million by 2031 at 6.12% CAGR over 2026-2031.
This report is Segmented by Type (Nitrogenous Fertilizers, Phosphatic Fertilizers, Potash Fertilizers, Secondary Macronutrients, and Micronutrients), by Application (Grains and Cereals, Oilseeds and Pulses, and More), and by Geography (Malaysia, Thailand, Vietnam, Philippines, Indonesia, and Rest of Southeast Asia). The Market Forecasts are Provided in Terms of Value (USD).
Southeast Asia Fertilizer Market Trends and Insights
Widespread Adoption of Precision-Farming Tools
Satellite imagery, soil sensors, and variable-rate applicators are transforming nutrient management across the Southeast Asia fertilizer market. Thailand's Agriculture and Cooperatives Strategy offers tax relief for smart farming hardware, accelerating uptake of GPS-guided spreaders that cut nitrogen losses by up to 15%. Malaysian oil-palm estates now run trials with drone-based mapping that tailors potassium inputs to canopy vigor, while Indonesian cooperatives deploy AI soil diagnostics that recommend field-specific urea rates. As growers verify savings in both cost and labor, demand for granular formulations compatible with precision machinery is rising. This technological shift drives demand for specialized fertilizer formulations compatible with precision application equipment, creating opportunities for enhanced-efficiency products.
Surging Demand for Enhanced-Efficiency Fertilizers
Controlled-release urea use in Vietnam expanded 25% in 2024, reflecting a regional pivot toward products that curb volatilization losses in monsoon climates. Indonesian universities report rice-husk-biochar coatings that extend nitrogen release over 60 days, lifting uptake efficiency by 20%. Malaysia's palm oil sector increasingly adopts slow-release formulations to address labor shortages and reduce application frequency. Palm growers in Malaysia favor polymer-coated blends that slash application frequency, easing labor constraints. Rising fertilizer costs, with urea prices reaching USD 430 per metric ton in February 2025, further accelerate the adoption of efficiency-enhancing products that deliver superior nutrient utilization rates.
Limited Rural Credit Access
Smallholders in the Philippines pay annual interest rates topping 20% to informal lenders, constraining timely fertilizer purchases. Vietnamese rice farmers often lack collateral to meet banking requirements, while many Indonesian districts remain underserved by micro-finance branches. Smallholders in Malaysia's palm oil industry encounter comparable challenges, especially regarding investments in specialty fertilizers that demand higher initial expenditures. The International Fertilizer Development Center notes that credit access improvements could increase fertilizer consumption by 16% annually, as demonstrated in Indonesia's targeted subsidy programs
Other drivers and restraints analyzed in the detailed report include:
- Government Nutrient-Management Subsidy Programs
- Expansion of Controlled-Release and Specialty Blends
- Climate-Induced Application Uncertainty
For complete list of drivers and restraints, kindly check the Table Of Contents.
Segment Analysis
Nitrogenous products, anchored by urea and ammonium sulfate, held a 42.58% share of the Southeast Asia fertilizer market in 2025. Domestic champion PT Pupuk Indonesia alone maintains an annual urea capacity of 9.4 million metric tons, ensuring a reliable supply for national rice targets. Imports still supplement Vietnamese and Thai demand, especially during peak paddy seasons. Potash fertilizers are subject to sourcing risks, however, the planned 1.2 million metric tons MOP facility in Thailand is expected to reduce dependency by 2028. Controlled-release coatings across each nutrient class are projected to gain market share because they match the incremental dosing preferred in precision platforms, thereby boosting nutrient-use efficiency under heavy rainfall regimes.
The Southeast Asia fertilizer market size attributed to micronutrient formulations is set to increase rapidly, with a 8.95% CAGR to 2031, reflecting growers' push to correct widespread zinc and boron deficiencies. Specialty suppliers are responding with chelated blends that resist tropical soil fixation and are compatible with precision spreader formats. Secondary macronutrients, particularly sulfur and magnesium, rise in relevance as palm oil estates pursue higher oil-to-bunch ratios.
Complete Report Scope:
- By Type
- Nitrogenous Fertilizers
- Urea
- Calcium Ammonium Nitrate
- Ammonia
- Ammonium Nitrate
- Ammonium Sulfate
- Other Nitrogenous Fertilizers
- Phosphatic Fertilizers
- Mono-ammonium Phosphate
- Di-ammonium Phosphate
- Triple Superphosphate
- Other Phosphatic Fertilizers
- Potash Fertilizers
- Muriate of Potash
- Other Potash Fertilizers
- Secondary Macronutrients
- Micronutrients
- Nitrogenous Fertilizers
- By Application
- Grains and Cereals
- Oilseeds and Pulses
- Commercial Crops
- Fruits and Vegetables
- Other Applications
- By Geography
- Malaysia
- Thailand
- Vietnam
- Philippines
- Indonesia
- Rest of Southeast Asia
List of Companies Covered in this Report:
- PT Pupuk Indonesia (Persero)
- Yara International ASA
- PT Petrokimia Gresik
- Mitsui & Co., Ltd. (Thai Central Chemical PCL)
- Song Gianh Corporation
- Ninh Binh Phosphate Fertilizer JSC
- Southern Fertilizer JSC
- Nutrien Ltd.
- Farmcochem Group
- sak siam fertilizer global export company limited (Saksiam Group)
- ICL Group Ltd. (Israel Corporation)
- Haifa Negev technologies LTD
- EuroChem Group (AIM Capital SE)
- K+S Aktiengesellschaft
Additional Benefits:
- The market estimate (ME) sheet in Excel format
- 3 months of analyst support
TABLE OF CONTENTS
1 Introduction
- 1.1 Study Assumptions and Market Definition
- 1.2 Scope of the Study
2 Research Methodology
3 Executive Summary
4 Market Landscape
- 4.1 Market Overview
- 4.2 Market Drivers
- 4.2.1 Widespread adoption of precision-farming tools
- 4.2.2 Surging demand for enhanced-efficiency fertilizers
- 4.2.3 Government nutrient-management subsidy programs
- 4.2.4 Expansion of controlled-release and specialty blends
- 4.2.5 Digital twin modeling for field-specific fertilizer dosing
- 4.2.6 Carbon-credit incentives for low-emission fertilizers
- 4.3 Market Restraints
- 4.3.1 Limited rural credit access
- 4.3.2 Climate-induced application uncertainties
- 4.3.3 Volatility in ammonia and potash feedstock prices
- 4.3.4 Lagging logistics infrastructure in secondary cities
- 4.4 Regulatory Landscape
- 4.5 Technological Outlook
- 4.6 Porter's Five Forces Analysis
- 4.6.1 Bargaining Power of Buyers
- 4.6.2 Bargaining Power of Suppliers
- 4.6.3 Threat of New Entrants
- 4.6.4 Threat of Substitute Products
- 4.6.5 Intensity of Competitive Rivalry
5 Market Size and Growth Forecasts (Value)
- 5.1 By Type
- 5.1.1 Nitrogenous Fertilizers
- 5.1.1.1 Urea
- 5.1.1.2 Calcium Ammonium Nitrate
- 5.1.1.3 Ammonia
- 5.1.1.4 Ammonium Nitrate
- 5.1.1.5 Ammonium Sulfate
- 5.1.1.6 Other Nitrogenous Fertilizers
- 5.1.2 Phosphatic Fertilizers
- 5.1.2.1 Mono-ammonium Phosphate
- 5.1.2.2 Di-ammonium Phosphate
- 5.1.2.3 Triple Superphosphate
- 5.1.2.4 Other Phosphatic Fertilizers
- 5.1.3 Potash Fertilizers
- 5.1.3.1 Muriate of Potash
- 5.1.3.2 Other Potash Fertilizers
- 5.1.4 Secondary Macronutrients
- 5.1.5 Micronutrients
- 5.1.1 Nitrogenous Fertilizers
- 5.2 By Application
- 5.2.1 Grains and Cereals
- 5.2.2 Oilseeds and Pulses
- 5.2.3 Commercial Crops
- 5.2.4 Fruits and Vegetables
- 5.2.5 Other Applications
- 5.3 By Geography
- 5.3.1 Malaysia
- 5.3.2 Thailand
- 5.3.3 Vietnam
- 5.3.4 Philippines
- 5.3.5 Indonesia
- 5.3.6 Rest of Southeast Asia
6 Competitive Landscape
- 6.1 Market Concentration
- 6.2 Strategic Moves
- 6.3 Market Share Analysis
- 6.4 Company Profiles (Includes Global Level Overview, Market Level Overview, Core Segments, Financials as Available, Strategic Information, Market Rank/Share for Key Companies, Products and Services, and Recent Developments)
- 6.4.1 PT Pupuk Indonesia (Persero)
- 6.4.2 Yara International ASA
- 6.4.3 PT Petrokimia Gresik
- 6.4.4 Mitsui & Co., Ltd. (Thai Central Chemical PCL)
- 6.4.5 Song Gianh Corporation
- 6.4.6 Ninh Binh Phosphate Fertilizer JSC
- 6.4.7 Southern Fertilizer JSC
- 6.4.8 Nutrien Ltd.
- 6.4.9 Farmcochem Group
- 6.4.10 sak siam fertilizer global export company limited (Saksiam Group)
- 6.4.11 ICL Group Ltd. (Israel Corporation)
- 6.4.12 Haifa Negev technologies LTD
- 6.4.13 EuroChem Group (AIM Capital SE)
- 6.4.14 K+S Aktiengesellschaft
7 Market Opportunities and Future Outlook

 2026年全球氨肥市場報告
 2026-2030年全球磷肥市場
 化肥市場規模、佔有率、成長、全球產業分析、區域趨勢及2026-2034年預測。昆蟲衍生肥料市場規模、佔有率、成長、全球產業分析、區域趨勢及2026年至2034年預測。
 印尼化肥市場:市場佔有率分析、產業趨勢與統計、成長預測(2026-2031)全球昆蟲衍生肥料市場規模、佔有率、趨勢和成長分析報告(2026-2034)綠色氨肥:市場佔有率分析、產業趨勢與統計、成長預測(2026-2031)馬來西亞化肥市場:市場佔有率分析、產業趨勢與統計、成長預測(2026-2031)
 全球控釋肥料市場:按類型、施用方法、功能、產品等級、作物類型、配方和地區分類-預測至2031年2026年全球微粉化肥料市場報告