


 |
市場調查報告書
商品編碼
2113676
印尼化肥市場:市場佔有率分析、產業趨勢與統計、成長預測(2026-2031)Indonesia Fertilizer - Market Share Analysis, Industry Trends & Statistics, Growth Forecasts (2026 - 2031) |
||||||

※ 本網頁內容可能與最新版本有所差異。詳細情況請與我們聯繫。
據 Mordor Intelligence 稱,2025 年印尼化肥市場價值 90 億美元,預計到 2031 年將從 2026 年的 93.7 億美元成長至 114.9 億美元,預測期(2026-2031 年)複合年成長率為 4.15%。
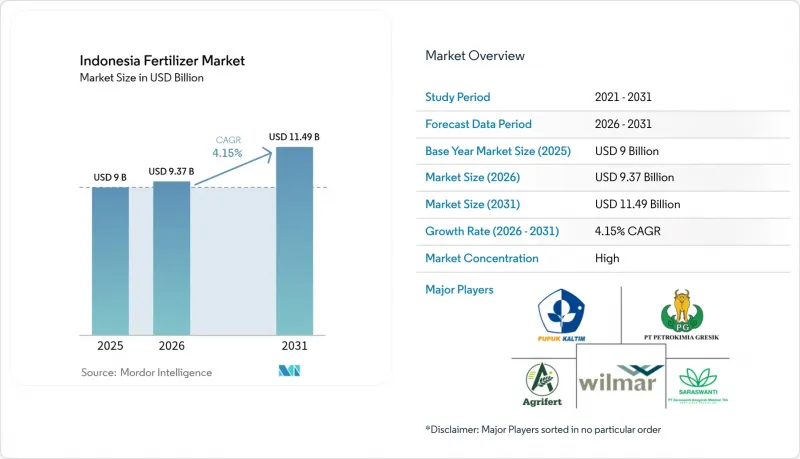
本報告按類型(複合肥和單質肥)和作物(穀物、豆類和油籽、經濟作物、水果和蔬菜等)進行分類。市場預測以美元計價。
印尼化肥市場趨勢與洞察
擴大政府化肥補貼(HET)
根據印尼政府的數據,2025年預算撥款950萬噸補貼化肥(其中尿素460萬噸,複合肥420萬噸,有機肥50萬噸),尿素價格維持在每公斤2250印尼幣(約0.14美元),複合肥價格維持在每公斤2300印尼幣(約印尼盾(約15美元),遠低於市場價格。這項有保障的供應支撐著印尼的化肥市場,即便政府支出已接近33億美元,約佔GDP的2.8%。當局正在將交付與農民資料庫「e-RDKK」連接起來,以最大限度地減少挪用,並確保優先作物獲得化肥供應。供應商也可以追蹤季度交付量,從而更順暢地調整生產計劃和營運資金規劃。
稻米和玉米自給自足計劃
普拉博沃總統設定了2026年實現水稻自給自足、三年內實現玉米自給自足的目標,這促使蘇拉威西島和加里曼丹島新開墾的地區更多地採用平衡型NPK複合肥,而非單一營養元素肥料。種植密度的增加和雙季種植提高了每公頃的養分需求,抵消了精密農業未來帶來的效率提升。 「卡蒂尼塔尼」計畫下分發的種子包包含建議的肥料用量,鼓勵農民以全面的方式管理土壤肥力。據私人經銷商稱,自2024年中期以來,東部島嶼對強化鋅NPK複合肥的需求增加了兩倍。
天然氣價格波動推高了尿素成本。
目前,再氣化液化天然氣的價格為每百萬英熱單位16.77美元,比尿素每噸成本高出50至70美元(此前補貼方案下尿素每噸成本僅為6美元),這給國內生產商的利潤率帶來了壓力。生產商正在尋求與布蘭特原油價格掛鉤的指數簽訂長期天然氣契約,該指數將從布蘭特原油價格中扣除一定金額,以穩定投入成本。一些工廠正在考慮引入與碳捕獲技術相結合的「藍氨」生產流程,以獲得優惠融資並對沖石化燃料價格波動的風險。
細分市場分析
2025年,單一肥料佔印尼化肥市場佔有率的53.42%。尿素佔據了這一市場主導地位,其用量佔氮肥總量的60%,政府根據最高零售價(HET)為2025年分配了460萬噸尿素。由於當地氨原料豐富,尿素成本得以維持在較低水準。同時,尿素透過廣泛的分銷網路供應給「蘇瓦森巴達·帕岸」(Suwasenbada Phangan)計劃下消耗大部分氮肥的偏遠稻米和玉米產區。硝酸銨鈣和硫酸銨則根據土壤特性填補了細分市場,而國產氨主要滿足國內需求,從而鞏固了氮肥在印尼化肥市場的主導地位。
微量元素肥料的成長速度最快,預計到2031年將以7.96%的複合年成長率成長,這得益於精密農業從爪哇島到蘇門答臘島的推廣,以及對出口導向園藝產業的支持。此外,新增的200萬噸混合產能使印尼的名義產能提升至1,400萬噸,從而降低了對進口的依賴。複合肥料(NPK)的銷售量也在穩定成長,因為它們能夠針對每個微區最佳化微量元素的配比。磷肥和鉀肥的價格仍容易受到運費波動的影響,因為印尼幾乎全部依賴進口磷酸二銨(DAP)、磷酸一銨(MAP)和氯化鉀(MOP)。同時,在加里曼丹島和蘇門答臘島的酸性土壤中,長期人工林產量受到限制,因此對次要營養元素的需求日益成長。
其他好處:
- Excel格式的市場預測(ME)表
- 3個月的分析師支持
目錄
第1章:引言
- 研究假設和市場定義
- 調查範圍
第2章:調查方法
第3章執行摘要
第4章 市場狀況
- 市場概覽
- 市場促進因素
- 擴大政府化肥補貼(HET)
- 稻米和玉米自給自足計劃
- Pupuku 印尼的新 NPK 混合工廠
- 棕櫚油人工林的再種植週期
- 出口導向園藝產業的發展需要特殊的營養物質
- 在爪哇島早期引進無人機精準施肥技術。
- 市場限制因素
- 補貼預算削減導致供不應求。
- 天然氣價格波動推高了尿素成本。
- 仿冒化肥透過非官方管道氾濫
- 泥炭地養分徑流面臨的環境壓力
- 監理情勢
- 技術展望
- 波特五力分析
第5章 市場規模與成長預測
- 依產品類型
- 複合肥
- 單一成分肥料
- 氮肥
- 尿素
- 硝酸銨鈣(CAN)
- 氨
- 硝酸銨
- 硫酸銨
- 其他氮肥
- 磷肥
- 磷酸一銨(MAP)
- 磷酸二銨(DAP)
- 三重過磷酸鈣(TSP)
- 其他磷肥
- 鉀肥
- 氯化鉀(MOP)
- 其他鉀肥
- 次要營養元素肥料
- 微量營養素
- 氮肥
- 按作物類型
- 穀物和穀類
- 豆類和油籽
- 經濟作物
- 水果和蔬菜
- 草坪和觀賞作物
第6章 競爭情勢
- 市場集中度
- 策略趨勢
- 市佔率分析
- 公司簡介
- PT Pupuk Kalimantan Timur(PKT)
- PT Petrokimia Gresik
- Wilmar International Limited
- Agrifert Marketing Pte Ltd(Kuok Group)
- PT Saraswanti Anugerah Makmur Tbk
- Yara International ASA
- EuroChem Group AG
- ICL Group Ltd.
- OCI Global NV
- PT Meroke Tetap Jaya
- PT Jadi Mas
- PT Dupan Anugerah Lestari
- PT Pupuk Sriwidjaya Palembang
- PT Pupuk Kujang Cikampek
- PT Pupuk Iskandar Muda
第7章 市場機會與未來展望
According to Mordor Intelligence, the Indonesia fertilizer market size was valued at USD 9 billion in 2025 and estimated to grow from USD 9.37 billion in 2026 to reach USD 11.49 billion by 2031, at a CAGR of 4.15% during the forecast period (2026-2031).
This report is Segmented by Type (Complex Fertilizers and Straight Fertilizers), and by Crop Type (Grains and Cereals, Pulses and Oilseeds, Commercial Crops, Fruits and Vegetables, and More). The Market Forecasts are Provided in Terms of Value (USD).
Indonesia Fertilizer Market Trends and Insights
Government Fertilizer Subsidy (HET) Expansion
As per the Indonesian ministry, the 2025 budget earmarked 9.5 million metric tons of subsidized fertilizer, 4.6 million metric tons of urea, 4.2 million metric tons of NPK, and 500,000 metric tons of organic keeping prices at IDR 2,250/kg (USD 0.14) for urea and IDR 2,300/kg (USD 0.15) for NPK, levels far below commercial quotations This guaranteed volume underpins the Indonesia fertilizer market even as fiscal outlays approach USD 3.3 billion, roughly 2.8% of GDP. By linking deliveries to the e-RDKK farmer database, authorities minimize leakages and channel nutrients to priority crops. Suppliers also gain visibility on quarterly offtake, allowing smoother production scheduling and working-capital planning.
Rice And Corn Self-Sufficiency Programs
President Prabowo targets rice self-sufficiency by 2026 and corn self-sufficiency within three years, spurring wider adoption of balanced NPK over single-nutrient products across new cultivation zones in Sulawesi and Kalimantan. Higher planting density and double-cropping schedules lift per-hectare nutrient requirements, offsetting future efficiency gains from precision farming. Seed packages issued under the Kartini Tani program include fertilizer recommendations, nudging farmers toward integrated soil fertility management. Private distributors report that demand for zinc-enriched NPK has tripled in the eastern islands since mid-2024.
Natural-Gas Price Volatility Raising Urea Costs
Regasified LNG now trades at USD 16.77 per MMBtu versus USD 6 under the previous subsidy, adding USD 50-70 to the cost of every metric ton of urea and squeezing margins for domestic manufacturers. Producers seek long-term gas contracts indexed to Brent-minus formulas to stabilize input costs. Several plants are evaluating carbon-capture linked blue ammonia pathways to unlock concessional finance and hedge against fossil fuel volatility.
Other drivers and restraints analyzed in the detailed report include:
- New NPK Blending Plants Under Pupuk Indonesia
- Palm-Oil Plantation Replanting Cycle
- Environmental Pressure on Peatland Nutrient Runoff
For complete list of drivers and restraints, kindly check the Table Of Contents.
Segment Analysis
Straight fertilizers led with 53.42% of the Indonesia fertilizer market share in 2025, a position anchored by urea's 60% slice of nitrogen volume and by the government's HET-backed allocation of 4.6 million metric tons for the 2025 season. Abundant local ammonia feedstock keeps urea costs low, while wide dealer networks push product into remote rice and corn belts that consume the bulk of nitrogen inputs under the swasembada pangan plan. Calcium ammonium nitrate and ammonium sulfate fill soil-specific niches, and in-country ammonia synthesis largely feeds domestic demand, reinforcing leadership for nitrogenous grades within the Indonesia fertilizer market size.
Micronutrient fertilizers post the quickest climb, advancing at an 7.96% CAGR to 2031 as precision farming spreads from Java to Sumatra and supports export-oriented horticulture. Complex NPK sales also rise steadily because 2 million metric tons of new blending capacity lifts national nameplate output to 14 million metric tons, curbing reliance on imports and tailoring micronutrient coatings by micro-region. Phosphatic and potash grades remain exposed to freight swings because Indonesia imports almost all DAP, MAP, and MOP, while secondary nutrients gain traction in acidic soils across Kalimantan and Sumatra that limit long-term plantation yields.
Complete Report Scope:
- By Product Type
- Complex Fertilizers
- Straight Fertilizers
- Nitrogenous Fertilizers
- Urea
- Calcium Ammonium Nitrate (CAN)
- Ammonia
- Ammonium Nitrate
- Ammonium Sulfate
- Other Nitrogenous Fertilizers
- Phosphatic Fertilizers
- Mono-ammonium Phosphate (MAP)
- Di-ammonium Phosphate (DAP)
- Triple Super-phosphate (TSP)
- Other Phosphatic Fertilizers
- Potash Fertilizers
- Muriate of Potash (MOP)
- Other Potash Fertilizers
- Secondary Nutrient Fertilizers
- Micronutrients
- Nitrogenous Fertilizers
- By Crop Type
- Grains and Cereals
- Pulses and Oil Seeds
- Commercial Crops
- Fruits and Vegetables
- Turf and Ornamental Crops
List of Companies Covered in this Report:
- PT Pupuk Kalimantan Timur (PKT)
- PT Petrokimia Gresik
- Wilmar International Limited
- Agrifert Marketing Pte Ltd (Kuok Group)
- PT Saraswanti Anugerah Makmur Tbk
- Yara International ASA
- EuroChem Group AG
- ICL Group Ltd.
- OCI Global N.V.
- PT Meroke Tetap Jaya
- PT Jadi Mas
- PT Dupan Anugerah Lestari
- PT Pupuk Sriwidjaya Palembang
- PT Pupuk Kujang Cikampek
- PT Pupuk Iskandar Muda
Additional Benefits:
- The market estimate (ME) sheet in Excel format
- 3 months of analyst support
TABLE OF CONTENTS
1 Introduction
- 1.1 Study Assumptions and Market Definition
- 1.2 Scope of the Study
2 Research Methodology
3 Executive Summary
4 Market Landscape
- 4.1 Market Overview
- 4.2 Market Drivers
- 4.2.1 Government fertilizer subsidy (HET) expansion
- 4.2.2 Rice and corn self-sufficiency programs
- 4.2.3 New NPK blending plants under Pupuk Indonesia
- 4.2.4 Palm-oil plantation replanting cycle
- 4.2.5 Growth in export-oriented horticulture needing specialty nutrients
- 4.2.6 Early adoption of drone-based precision fertilization in Java
- 4.3 Market Restraints
- 4.3.1 Subsidy budget cuts creating supply gaps
- 4.3.2 Natural-gas price volatility raising urea costs
- 4.3.3 Proliferation of counterfeit fertilizers in informal channels
- 4.3.4 Environmental pressure on peatland nutrient runoff
- 4.4 Regulatory Landscape
- 4.5 Technological Outlook
- 4.6 Porter's Five Forces Analysis
- 4.6.1 Bargaining Power of Suppliers
- 4.6.2 Bargaining Power of Buyers
- 4.6.3 Threat of New Entrants
- 4.6.4 Threat of Substitute Products
- 4.6.5 Intensity of Competitive Rivalry
5 Market Size and Growth Forecasts (Value)
- 5.1 By Product Type
- 5.1.1 Complex Fertilizers
- 5.1.2 Straight Fertilizers
- 5.1.2.1 Nitrogenous Fertilizers
- 5.1.2.1.1 Urea
- 5.1.2.1.2 Calcium Ammonium Nitrate (CAN)
- 5.1.2.1.3 Ammonia
- 5.1.2.1.4 Ammonium Nitrate
- 5.1.2.1.5 Ammonium Sulfate
- 5.1.2.1.6 Other Nitrogenous Fertilizers
- 5.1.2.2 Phosphatic Fertilizers
- 5.1.2.2.1 Mono-ammonium Phosphate (MAP)
- 5.1.2.2.2 Di-ammonium Phosphate (DAP)
- 5.1.2.2.3 Triple Super-phosphate (TSP)
- 5.1.2.2.4 Other Phosphatic Fertilizers
- 5.1.2.3 Potash Fertilizers
- 5.1.2.3.1 Muriate of Potash (MOP)
- 5.1.2.3.2 Other Potash Fertilizers
- 5.1.2.4 Secondary Nutrient Fertilizers
- 5.1.2.5 Micronutrients
- 5.1.2.1 Nitrogenous Fertilizers
- 5.2 By Crop Type
- 5.2.1 Grains and Cereals
- 5.2.2 Pulses and Oil Seeds
- 5.2.3 Commercial Crops
- 5.2.4 Fruits and Vegetables
- 5.2.5 Turf and Ornamental Crops
6 Competitive Landscape
- 6.1 Market Concentration
- 6.2 Strategic Moves
- 6.3 Market Share Analysis
- 6.4 Company Profiles (Includes Global Level Overview, Market Level Overview, Core Segments, Financials as Available, Strategic Information, Market Rank/Share for Key Companies, Products and Services, and Recent Developments)
- 6.4.1 PT Pupuk Kalimantan Timur (PKT)
- 6.4.2 PT Petrokimia Gresik
- 6.4.3 Wilmar International Limited
- 6.4.4 Agrifert Marketing Pte Ltd (Kuok Group)
- 6.4.5 PT Saraswanti Anugerah Makmur Tbk
- 6.4.6 Yara International ASA
- 6.4.7 EuroChem Group AG
- 6.4.8 ICL Group Ltd.
- 6.4.9 OCI Global N.V.
- 6.4.10 PT Meroke Tetap Jaya
- 6.4.11 PT Jadi Mas
- 6.4.12 PT Dupan Anugerah Lestari
- 6.4.13 PT Pupuk Sriwidjaya Palembang
- 6.4.14 PT Pupuk Kujang Cikampek
- 6.4.15 PT Pupuk Iskandar Muda
7 Market Opportunities and Future Outlook

 2026年全球氨肥市場報告
 2026-2030年全球磷肥市場
 東南亞化肥市場:市佔率分析、產業趨勢與統計及成長預測(2026-2031年)
 化肥市場規模、佔有率、成長、全球產業分析、區域趨勢及2026-2034年預測。昆蟲衍生肥料市場規模、佔有率、成長、全球產業分析、區域趨勢及2026年至2034年預測。全球昆蟲衍生肥料市場規模、佔有率、趨勢和成長分析報告(2026-2034)綠色氨肥:市場佔有率分析、產業趨勢與統計、成長預測(2026-2031)馬來西亞化肥市場:市場佔有率分析、產業趨勢與統計、成長預測(2026-2031)
 全球控釋肥料市場:按類型、施用方法、功能、產品等級、作物類型、配方和地區分類-預測至2031年2026年全球微粉化肥料市場報告