


 |
市場調查報告書
商品編碼
2117277
電子商務應用:市場佔有率分析、產業趨勢與統計、成長預測(2026-2031)E-commerce App - Market Share Analysis, Industry Trends & Statistics, Growth Forecasts (2026 - 2031) |
||||||

※ 本網頁內容可能與最新版本有所差異。詳細情況請與我們聯繫。
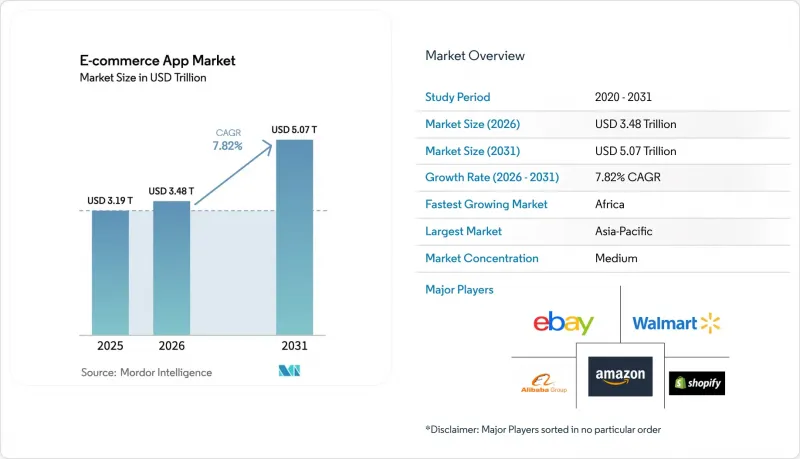
根據 Mordor Intelligence 預測,電子商務應用市場規模預計將在 2025 年達到 3.19 兆美元,2026 年達到 3.48 兆美元,到 2031 年達到 5.07 兆美元,2026 年至 2031 年的複合年成長率為 7.82%。
本報告按類型(廣告、交易費、訂閱費及其他)、平台(安卓、iOS及其他)、經營模式(B2C市場、B2B市場、C2C/ P2P及其他)、產品類型(時尚服飾、電子產品及媒體、食品雜貨及快速消費品、家居及家具、健康及美容及其他)及地區細分。市場預測以美元計價。
全球電子商務應用市場趨勢及洞察
透過 5G 的普及改善行動商務體驗。
5G 的毫秒延遲使得產品視覺化效果更加豐富,這是 4G 無法實現的。在韓國,預計到 2024 年 5G 普及率將達到 50%,而擴增實境 (AR) 產品清單的點擊率比靜態圖片高出 2.3 倍。零售商正在利用網路切片技術,確保在限時搶購期間支付處理時間低於 50 毫秒,從而減少每年因購物車遺棄造成的 180 億美元損失。此外,電信公司正在東南亞和拉丁美洲等價格敏感型市場推出捆綁免費資料通訊流量套餐的活動,以鼓勵用戶使用應用程式,從而促進電子商務應用程式的普及。
「先買後付 (BNPL)」整合快速擴展
2024年,先買後付(BNPL)占美國電子商務交易的9.8%,但由於其被重新歸類為信用卡卡片貸款,因此需遵守Z條例規定的爭議解決義務,合規成本可能每年增加12億美元。儘管監管力度加大,PayPal的數據顯示,先買後付用戶的終身價值(LTV)比一次性購買者高出35%,這證實了分期付款的柔軟性是推動需求成長的主要因素。隨著電子商務應用市場的不斷發展,那些能夠利用自身數據承擔風險的成熟企業有望進一步擴大其競爭優勢。
應用程式追蹤透明度的監管
到2024年,蘋果應用追蹤透明度框架的啟用率降至25%,導致支援重定向的跨應用程式識別碼圖譜碎片化,Meta因此損失了約100億美元的行動廣告收入。歐盟在2023年至2024年間對不遵守GDPR的電商應用處以總計21億歐元的罰款。這迫使開發者重組其使用者許可流程,將首次會話中可收集的資料量減少了40%。儘管該平台目前正將重點轉向情境廣告和第一忠誠度計畫,但整個電商應用市場仍面臨短期收入壓力。
細分市場分析
預計到2025年,交易手續費將佔總收入的39.34%,電商平台將從所有已完成的交易中獲得收入;而訂閱費預計到2031年將以8.82%的複合年成長率成長。亞馬遜Prime是此模式的典型代表,其2.3億會員在2025年支付了400億美元的年度會員費,有效緩解了消費者支出放緩對收入的影響。訂閱模式日益普及表明,對於許多消費者而言,可預測的物流優勢和獨家產品獲取途徑比失去柔軟性的擔憂更為重要,隨著電商應用市場的成熟,這一趨勢預計將會加劇。
收費模式正日益受到法律規範的推動。歐洲的《數位市場法》禁止強制使用專有支付系統,這削弱了應用程式內交易費的主導地位。整合了交易收入和訂閱模式的電商應用,其收入波動性降低了30%,凸顯了多元化經營的優勢。
2025年,Android系統將維持72.67%的裝置量,主要得益於亞洲和非洲地區售價低於100美元的熱門設備。同時,iOS的下載量僅佔19%,但北美和歐洲的高收入用戶群體為其提供了支持,其商品交易總額(GMV)佔比高達45%。 2025年,微信超級應用平台擁有450萬個小程序,交易總合達4,200億美元,該領域複合年成長率(CAGR)高達8.24%。
由於小程式繼承了母應用程式的認證資訊和付款方式,因此與獨立應用程式相比,它們的用戶留存率更高。獨立應用程式在首次安裝後的30天內會流失70%的用戶。中國監管機構現在要求小程式內顯示營業執照,這增加了合規負擔,但也鞏固了消費者的信任。儘管北美的反壟斷審查正在減緩超級應用的擴張,但小程式在亞洲的滲透率正在使其成為電子商務應用市場永續成長的支柱。
區域分析
預計到2025年,亞太地區將佔全球收入的42.48%。這主要得益於中國的超級應用生態系統,該系統將零售、支付和社交網路整合到一個平台上,每天透過小程式處理450萬筆交易。印度的統一支付介面(UPI)每月處理116億筆交易,甚至讓街頭小販也能透過Paytm和PhonePe接受QR碼支付。東南亞的即時電商交易總額(GMV)達到1,800億美元,將產品發現到購買的週期縮短至不到100秒。
到了2025年,北美將佔據28%的市場佔有率,其中美國貢獻8,200億美元。這主要歸功於亞馬遜Prime在美國擁有1.8億會員,推動了「隔日達」經營模式的發展。在墨西哥,由於MercadoPago的小額貸款為沒有銀行帳戶的消費者提供信貸,因此應用程式滲透率飆升至48%。加州《消費者隱私法案》限制了第三方資料共用,迫使整個電商應用程式市場轉向情境廣告策略。根據《數位市場法案》,歐洲強制推行互通支付,導致安全隔離網閘)的市佔率下降了8-12個百分點,第三方開發者從中受益。英國脫歐後,海關摩擦導致英國的配送時間延長了5天,迫使企業建立雙重履約中心,增加了物流成本。同時,俄羅斯支付網路受到製裁,帶來了挑戰,但該國的國內支付系統Mir在一定程度上緩解了製裁的影響。
非洲是成長最快的地區,複合年成長率高達8.89%,這主要得益於行動支付的互通性,跨境費用從7%降至1%以下。 Jumia在奈及利亞和埃及採用了一種模式,其中60%的交易採用貨到付款(COD),並在官方地址較少的地區設立了配備GPS的取貨點。非洲大陸自由貿易區(AfCFTA)的緩慢實施意味著清關仍然需要7-10天,這為數位仲介進入市場提供了絕佳機會。巴西的Pix每月處理32億筆即時支付交易,消除了3天的支付延遲。 MercadoLibre在主要大都會地區擁有1800個履約中心,可實現隔日送達,提高了全部區域對服務的期望。阿根廷消費者擴大使用分期付款計劃來避免通貨膨脹導致的購買力下降,這凸顯了宏觀經濟波動對電子商務應用市場的重大影響。
在中東市場,受沙烏地阿拉伯政府規定年銷售額超過100萬裡亞爾的公司必須接受數位支付的法規推動,預計到2025年,數位支付的普及率將達到48%。儘管夏季氣溫高達攝氏45度,為生鮮食品的物流配送帶來挑戰,Noon和Amazon.ae仍在當日送達服務領域競爭。阿拉伯聯合大公國的增值稅退稅應用程式允許遊客即時獲得符合條件的消費退稅,從而創造了便捷高效的流程。這項措施顯著促進了透過該應用程式購買奢侈品的人數增加14%,凸顯了其對國內消費支出的正面影響。
其他好處
- Excel格式的市場預測(ME)表
- 3個月的分析師支持
目錄
第1章:引言
- 研究假設和市場定義
- 調查範圍
第2章:調查方法
第3章執行摘要
第4章 市場狀況
- 市場概覽
- 市場促進因素
- 透過 5G 的普及改善行動商務體驗。
- 「先買後付 (BNPL)」整合快速擴展
- 透過短影片平台推廣社交商務的融合。
- 透過人工智慧驅動的個人化服務提高平均訂單價值
- 新興國家平價智慧型手機普及率不斷提高
- 政府推廣數位支付和電子帳單
- 市場限制因素
- 應用程式追蹤透明度的監管
- 中小企業跨境物流成本不斷上漲
- 消費者對資料外洩的擔憂日益加劇
- 行動網路安全工程師短缺
- 產業價值鏈分析
- 監理情勢
- 技術展望
- 宏觀經濟因素對市場的影響
- 波特五力分析
第5章 市場規模與成長預測
- 按類型
- 應用程式內收費
- 廣告
- 訂閱費
- 交易費用
- 免費增值提升銷售
- 按平台
- Android
- iOS
- 超級應用小程式
- 按經營模式
- B2C(企業對消費者)市場
- B2B(企業對企業)市場
- C2C(企業對企業)/P2P
- DtoC(直接面對消費者)品牌應用
- 產品類型
- 時尚與服裝
- 電子媒體
- 食品和快速消費品
- 居家及家具
- 健康與美容
- 其他產品類型
- 按地區
- 北美洲
- 美國
- 加拿大
- 墨西哥
- 歐洲
- 德國
- 英國
- 法國
- 俄羅斯
- 其他歐洲國家
- 亞太地區
- 中國
- 日本
- 印度
- 韓國
- 澳洲
- 其他亞太國家
- 中東和非洲
- 中東
- 沙烏地阿拉伯
- 阿拉伯聯合大公國
- 其他中東國家
- 非洲
- 南非
- 埃及
- 其他非洲國家
- 中東
- 南美洲
- 巴西
- 阿根廷
- 其他南美國家
- 北美洲
第6章 競爭情勢
- 市場集中度
- 策略趨勢
- 市佔率分析
- 公司簡介
- Amazon.com, Inc.
- eBay Inc.
- Walmart Inc.
- Alibaba Group Holding Limited
- Shopify Inc.
- Etsy, Inc.
- Tata UniStore Limited
- Reliance Retail Limited
- Fashnear Technologies Private Limited
- Roadget Business Pte. Ltd.
- MercadoLibre, Inc.
- Flipkart Internet Private Limited
- Rakuten Group, Inc.
- Lazada Group SA
- Shopee Pte. Ltd.
- JD.com, Inc.
- Zalando SE
- Jumia Technologies AG
- Coupang, Inc.
- Alibaba.com Hong Kong Limited
第7章 市場機會與未來展望
According to Mordor Intelligence, the e-commerce app market size is projected to be USD 3.19 trillion in 2025, USD 3.48 trillion in 2026, and reach USD 5.07 trillion by 2031, growing at a CAGR of 7.82% from 2026 to 2031.
This report is Segmented by Type (Advertisement, Transaction Fees, Subscription Fees, and More), Platform (Android, IOS, and More), Business Model (B2C Marketplace, B2B Marketplace, C2C/Peer-to-Peer, and More), Product Category (Fashion and Apparel, Electronics and Media, Grocery and FMCG, Home and Furniture, Health and Beauty, and More), and Geography. The Market Forecasts are Provided in Terms of Value (USD).
Global E-commerce App Market Trends and Insights
Proliferation of 5G Enhancing Mobile-Commerce Experiences
Single-digit-millisecond latency on 5G enables rich product visualization that had stalled on 4G. In South Korea, 5G penetration reached 50% in 2024, and AR-enabled listings achieved a 2.3x click-through rate compared to static images. Retailers exploit network slicing to guarantee sub-50-millisecond checkout during flash sales, curbing the USD 18 billion in annual losses from cart abandonment. Telcos are also bundling zero-rated data plans that subsidize app usage in price-sensitive markets across Southeast Asia and Latin America, thereby boosting e-commerce app adoption.
Rapid Expansion of Buy-Now-Pay-Later Integrations
BNPL accounted for 9.8% of U.S. e-commerce transactions in 2024, but its reclassification as credit card lending now imposes Regulation Z dispute-resolution obligations that may inflate compliance costs by USD 1.2 billion annually. Despite tighter oversight, PayPal disclosed that BNPL users exhibit a 35% higher lifetime value than one-time buyers, validating installment flexibility as a demand catalyst. Incumbents able to underwrite risk with proprietary data will likely widen moats as the e-commerce app market evolves.
Intensifying Regulatory Scrutiny on App Tracking Transparency
Opt-in rates for Apple's App Tracking Transparency framework slipped to 25% by 2024, severing cross-app identifier graphs that powered retargeting and costing Meta an estimated USD 10 billion in mobile-ad revenue. The European Union levied EUR 2.1 billion in GDPR fines on non-compliant e-commerce apps during 2023-2024, forcing developers to rebuild consent flows that capture 40% less first-session data. Platforms now pivot toward contextual ads and first-party loyalty schemes, yet short-term revenue pressure persists across the e-commerce app market.
Other drivers and restraints analyzed in the detailed report include:
- Growing Social-Commerce Convergence via Short-Video Platforms
- AI-Driven Personalization Increasing Average Order Value
- Escalating Cross-Border Logistics Costs for SMEs
For complete list of drivers and restraints, kindly check the Table Of Contents.
Segment Analysis
Transaction fees accounted for 39.34% of revenue share in 2025, as marketplaces monetized every completed sale, yet subscription fees are on track to expand at an 8.82% CAGR through 2031. Amazon Prime exemplifies the model with 230 million members who contributed USD 40 billion in annual fees during 2025, cushioning revenue against discretionary slowdowns. Rising subscription uptake indicates that predictable logistics perks and exclusive drops outweigh the perceived loss of flexibility for many shoppers, a trend expected to deepen as the e-commerce app market matures.
Recurring billing is increasingly supported by the regulatory framework. Europe's Digital Markets Act prohibits the mandatory use of proprietary payment systems, thereby reducing the dominance of in-app commissions associated with transaction fees. E-commerce applications that integrate transaction income with subscription models experience a 30% decrease in revenue volatility, emphasizing the benefits of diversification.
Android maintained 72.67% of the installed base in 2025, propelled by sub-USD 100 devices popular in Asia and Africa. iOS captured just 19% of downloads but 45% of GMV, driven by affluent user cohorts in North America and Europe. In 2025, WeChat boasted 4.5 million mini-programs on its super-app platform, collectively handling transactions worth USD 420 billion, marking an impressive 8.24% CAGR for the segment.
Mini-programs inherit parent-app credentials and payment methods, boosting retention compared with standalone apps, which lose 70% of new installs within 30 days. China's regulators now require business license displays in mini-programs, raising compliance overhead while solidifying consumer trust. Although North American antitrust scrutiny chills super-app expansion, mini-program traction across Asia positions the format as a durable growth pillar in the e-commerce app market.
Complete Report Scope:
- By Type
- In-app Purchases
- Advertisements
- Subscription Fees
- Transaction Fees
- Freemium Upsell
- By Platform
- Android
- iOS
- Super-App Mini-Programs
- By Business Model
- B2C Marketplace
- B2B Marketplace
- C2C / Peer-to-Peer
- Direct-to-Consumer Brand App
- By Product Category
- Fashion and Apparel
- Electronics and Media
- Grocery and FMCG
- Home and Furniture
- Health and Beauty
- Other Product Categories
- By Geography
- North America
- United States
- Canada
- Mexico
- Europe
- Germany
- United Kingdom
- France
- Russia
- Rest of Europe
- Asia-Pacific
- China
- Japan
- India
- South Korea
- Australia
- Rest of Asia-Pacific
- Middle East and Africa
- Middle East
- Saudi Arabia
- United Arab Emirates
- Rest of Middle East
- Africa
- South Africa
- Egypt
- Rest of Africa
- Middle East
- South America
- Brazil
- Argentina
- Rest of South America
- North America
Geography Analysis
Asia-Pacific generated 42.48% of 2025 revenue, as China's super-app ecosystems embedded retail, payments, and social networking into a single platform, processing 4.5 million daily mini-program transactions. India's Unified Payments Interface cleared 11.6 billion monthly transactions, enabling even street vendors to accept QR-code payments through Paytm and PhonePe. Southeast Asia's live-stream commerce hit USD 180 billion in GMV, compressing discovery-to-purchase cycles to sub-100 seconds.
North America held a 28% share in 2025, with the United States contributing USD 820 billion as Amazon Prime's 180 million domestic members fueled one-day shipping economics. Mexico's app penetration jumped to 48% on the back of MercadoPago micro-loans that extend credit to unbanked consumers. California's Consumer Privacy Act curtailed third-party data sharing, forcing a pivot toward contextual ad strategies across the e-commerce app market.In accordance with the Digital Markets Act, Europe mandated interoperable payments, resulting in an 8 to 12 percentage point reduction in gatekeeper take rates, thereby benefiting third-party developers. Following Brexit, customs frictions extended delivery times in the United Kingdom by 5 days, necessitating dual-fulfillment footprints and consequently increasing logistics costs. While Russia encountered challenges due to payment-network sanctions, these were partially mitigated by the country's domestic Mir rails.
Africa is the fastest-growing region at an 8.89% CAGR, propelled by mobile-money interoperability that cuts cross-border fees from 7% to under 1%. Jumia adopted a 60% cash-on-delivery model in Nigeria and Egypt, deploying GPS-tagged drop-off points where formal addresses are scarce. Implementation lags under the African Continental Free Trade Area still leave customs clearance at 7-10 days, a barrier ripe for digital brokers. Brazil's Pix processed 3.2 billion monthly instant-payment transactions, evaporating three-day settlement lags. MercadoLibre's 1,800 fulfillment sites now enable next-day delivery in major metros, raising service expectations across the region. Argentina's consumers lean on installment plans to hedge against inflationary erosion, underscoring macro volatility's sway over the e-commerce app market.
Middle East markets reached 48% penetration in 2025, buoyed by mandates requiring businesses with annual revenue above SAR 1 million to accept digital payments. Noon and Amazon.ae compete on same-day service despite the 45-degree Celsius summers that challenge perishable logistics. The UAE's VAT-refund app allows tourists to instantly reclaim taxes on eligible purchases, providing a seamless and efficient process. This initiative has significantly contributed to a 14% increase in luxury app purchases, highlighting its positive impact on consumer spending within the country.
- Amazon.com, Inc.
- eBay Inc.
- Walmart Inc.
- Alibaba Group Holding Limited
- Shopify Inc.
- Etsy, Inc.
- Tata UniStore Limited
- Reliance Retail Limited
- Fashnear Technologies Private Limited
- Roadget Business Pte. Ltd.
- MercadoLibre, Inc.
- Flipkart Internet Private Limited
- Rakuten Group, Inc.
- Lazada Group SA
- Shopee Pte. Ltd.
- JD.com, Inc.
- Zalando SE
- Jumia Technologies AG
- Coupang, Inc.
- Alibaba.com Hong Kong Limited
Additional Benefits:
- The market estimate (ME) sheet in Excel format
- 3 months of analyst support
TABLE OF CONTENTS
1 INTRODUCTION
- 1.1 Study Assumptions and Market Definition
- 1.2 Scope of the Study
2 RESEARCH METHODOLOGY
3 EXECUTIVE SUMMARY
4 MARKET LANDSCAPE
- 4.1 Market Overview
- 4.2 Market Drivers
- 4.2.1 Proliferation of 5G Enhancing Mobile-Commerce Experiences
- 4.2.2 Rapid Expansion of Buy-Now-Pay-Later (BNPL) Integrations
- 4.2.3 Growing Social-Commerce Convergence via Short-Video Platforms
- 4.2.4 AI-Driven Personalization Increasing Average Order Value
- 4.2.5 Rising Penetration of Affordable Smartphones in Emerging Economies
- 4.2.6 Government Push for Digital Payments and e-Invoices
- 4.3 Market Restraints
- 4.3.1 Intensifying Regulatory Scrutiny on App Tracking Transparency
- 4.3.2 Escalating Cross-Border Logistics Costs for SMEs
- 4.3.3 Heightened Consumer Concerns Around Data Privacy Breaches
- 4.3.4 Talent Shortage in Mobile Cyber-Security Engineering
- 4.4 Industry Value Chain Analysis
- 4.5 Regulatory Landscape
- 4.6 Technological Outlook
- 4.7 Impact of Macroeconomic Factors on the Market
- 4.8 Porter's Five Forces Analysis
- 4.8.1 Bargaining Power of Suppliers
- 4.8.2 Bargaining Power of Buyers
- 4.8.3 Threat of New Entrants
- 4.8.4 Threat of Substitutes
- 4.8.5 Intensity of Competitive Rivalry
5 MARKET SIZE AND GROWTH FORECASTS (VALUE)
- 5.1 By Type
- 5.1.1 In-app Purchases
- 5.1.2 Advertisements
- 5.1.3 Subscription Fees
- 5.1.4 Transaction Fees
- 5.1.5 Freemium Upsell
- 5.2 By Platform
- 5.2.1 Android
- 5.2.2 iOS
- 5.2.3 Super-App Mini-Programs
- 5.3 By Business Model
- 5.3.1 B2C Marketplace
- 5.3.2 B2B Marketplace
- 5.3.3 C2C / Peer-to-Peer
- 5.3.4 Direct-to-Consumer Brand App
- 5.4 By Product Category
- 5.4.1 Fashion and Apparel
- 5.4.2 Electronics and Media
- 5.4.3 Grocery and FMCG
- 5.4.4 Home and Furniture
- 5.4.5 Health and Beauty
- 5.4.6 Other Product Categories
- 5.5 By Geography
- 5.5.1 North America
- 5.5.1.1 United States
- 5.5.1.2 Canada
- 5.5.1.3 Mexico
- 5.5.2 Europe
- 5.5.2.1 Germany
- 5.5.2.2 United Kingdom
- 5.5.2.3 France
- 5.5.2.4 Russia
- 5.5.2.5 Rest of Europe
- 5.5.3 Asia-Pacific
- 5.5.3.1 China
- 5.5.3.2 Japan
- 5.5.3.3 India
- 5.5.3.4 South Korea
- 5.5.3.5 Australia
- 5.5.3.6 Rest of Asia-Pacific
- 5.5.4 Middle East and Africa
- 5.5.4.1 Middle East
- 5.5.4.1.1 Saudi Arabia
- 5.5.4.1.2 United Arab Emirates
- 5.5.4.1.3 Rest of Middle East
- 5.5.4.2 Africa
- 5.5.4.2.1 South Africa
- 5.5.4.2.2 Egypt
- 5.5.4.2.3 Rest of Africa
- 5.5.4.1 Middle East
- 5.5.5 South America
- 5.5.5.1 Brazil
- 5.5.5.2 Argentina
- 5.5.5.3 Rest of South America
- 5.5.1 North America
6 COMPETITIVE LANDSCAPE
- 6.1 Market Concentration
- 6.2 Strategic Moves
- 6.3 Market Share Analysis
- 6.4 Company Profiles (includes Global Level Overview, Market Level Overview, Core Segments, Financials as Available, Strategic Information, Market Rank/Share for Key Companies, Products and Services, and Recent Developments)
- 6.4.1 Amazon.com, Inc.
- 6.4.2 eBay Inc.
- 6.4.3 Walmart Inc.
- 6.4.4 Alibaba Group Holding Limited
- 6.4.5 Shopify Inc.
- 6.4.6 Etsy, Inc.
- 6.4.7 Tata UniStore Limited
- 6.4.8 Reliance Retail Limited
- 6.4.9 Fashnear Technologies Private Limited
- 6.4.10 Roadget Business Pte. Ltd.
- 6.4.11 MercadoLibre, Inc.
- 6.4.12 Flipkart Internet Private Limited
- 6.4.13 Rakuten Group, Inc.
- 6.4.14 Lazada Group SA
- 6.4.15 Shopee Pte. Ltd.
- 6.4.16 JD.com, Inc.
- 6.4.17 Zalando SE
- 6.4.18 Jumia Technologies AG
- 6.4.19 Coupang, Inc.
- 6.4.20 Alibaba.com Hong Kong Limited
7 MARKET OPPORTUNITIES AND FUTURE OUTLOOK
- 7.1 White-Space and Unmet-Need Assessment

 2026年全球叫車應用市場報告
 全球行動應用市場規模、佔有率、趨勢和成長分析報告(2026-2034)
 印度政府超級應用平台:市場佔有率分析、產業趨勢與統計及成長預測(2026-2031)
 行動應用與網路分析市場:全球市場預測,2026-2032年行動應用管理(MAM)軟體:市場佔有率分析、產業趨勢與統計及成長預測(2026-2031)數位筆記型電腦市場:2026-2032年全球市場預測(按產品類型、筆記型電腦格式、設備生態系統、連接方式、應用、部署和最終用戶分類)行動應用市場:2026-2032年全球市場預測(按平台、裝置類型、定價模式、連線需求、應用程式和最終用戶分類)黑色素瘤檢測行動應用:市佔率分析、產業趨勢與統計及成長預測(2026-2031)
 備忘錄應用市場規模、佔有率和成長分析:按平台、功能、最終用戶、通路和地區分類-2026-2033年產業預測
 分攤帳單應用市場規模、佔有率和成長分析:按產品/服務、平台、採用模式、最終用戶、收入模式、分銷管道和地區分類-2026-2033年產業預測