


 |
市場調查報告書
商品編碼
2117220
食品和農業檢測、檢驗和認證:市場佔有率分析、行業趨勢和統計數據、成長預測(2026-2031 年)Food And Agriculture Testing, Inspection, And Certification - Market Share Analysis, Industry Trends & Statistics, Growth Forecasts (2026 - 2031) |
||||||

※ 本網頁內容可能與最新版本有所差異。詳細情況請與我們聯繫。
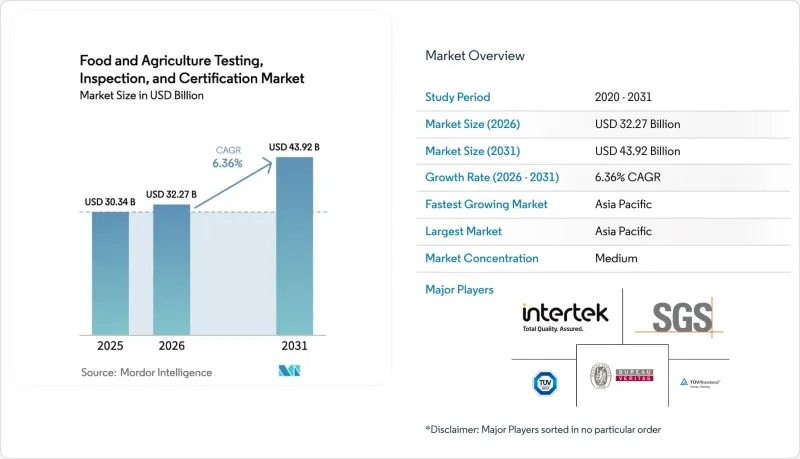
根據 Mordor Intelligence 預測,食品和農業領域的測試、檢驗和認證市場規模預計將從 2025 年的 303.4 億美元成長到 2026 年的 322.7 億美元,然後在 2031 年達到 439.2 億美元,2026 年至 2031 年的複合年成長率為 6.3%。
本報告按服務類型(測試服務、檢驗服務、認證服務)、採購方式(內部採購和外包)以及地區(北美、南美、歐洲、亞太、中東和非洲)進行細分。市場預測以美元計價。
全球食品和農業檢測、檢驗和認證市場趨勢及洞察
全球更嚴格的食品安全法規
美國《食品安全現代化法案》(FSMA)實驗室認可認證(LAAF)計畫於2024年全面啟動,該計畫強制要求檢測實驗室針對指定的分析項目獲得特定認證。這增加了合規成本,迫使食品公司使用經認證的第三方服務商。歐盟也出現了類似的監管收緊,歐洲食品安全局(EFSA)擴大了風險評估框架,並實施了更嚴格的殘留基準值,增加了強制性檢測的數量。基於全球食品安全計劃(GFSI)標準的體系,例如ISO 22000、BRCGS、IFS和FSSC 22000,在提高技術最低標準的同時,降低了監管差異。因此,以前依賴基本內部檢測的小規模生產商現在被迫外包更複雜的分析,擴大了食品安全檢測、審核和認證市場。符合多項標準意味著安全檢驗成為一項固定營運成本,使其支出與正常的經濟週期脫鉤。綜合檢測實驗室網路利用其廣泛的認證範圍來確保長期合約和價格溢價。
農產品和食品跨境貿易量不斷成長
在全球食品貿易中,每種產品所需的檢驗次數加倍,因為單次貨運需遵守多個管理體制。越南向歐盟出口加工水產品的企業必須同時滿足原產國和目的地的農藥、重金屬、微生物和標籤標準,這導致檢驗需求增加。由於出口商將業務重點放在能夠簽發全球認可證書的供應商身上,因此在多個司法管轄區獲得認證的檢驗機構處於有利地位。亞太地區是成長的驅動力,既是製造地,也是消費市場。這導致了雙向物流,需要在兩端檢驗。雖然互認協議簡化了一些文書工作,但諷刺的是,隨著小規模生產商進入新市場的門檻降低,檢驗總數反而增加了。這一趨勢導致區域檢驗機構的檢驗量實現了兩位數的成長,尤其是在泰國和越南等樞紐地區。
新興市場合規體系碎片化
在新興經濟體,各國的具體法規與國際標準有差異,迫使出口商應對重疊甚至相互矛盾的檢驗要求。例如,越南和奈及利亞已推出新的殘留物標準和認證框架,但這些標準和框架尚未與全球食品安全計劃(GFSI)系統接軌,導致需要重新取樣和重複提交文件。檢驗機構必須持有多個認證,這增加了營運成本並延長了檢驗時間。食品企業正透過限制產品線或避免出口某些目的地來應對,暫時抑制這些路線的檢驗需求成長,直到監管協調得到改善。
細分市場分析
至2025年,檢測服務將佔食品和農業檢測、檢驗和認證市場的57.62%。這反映了所有生產商都必須進行的病原體、化學殘留和營養成分分析。認證服務正以6.72%的複合年成長率快速成長,因為品牌利用第三方認證標誌在超級市場貨架上脫穎而出。檢驗服務雖然由於其勞動密集的特性而規模較小,但對於設施審核和流程驗證至關重要。在檢驗服務領域,對次世代定序和液相層析-串聯質譜(LC-MS/MS)的需求不斷成長,推高了價格,而SGS SMART等整合資料入口網站則支援高價值分析。在預測期內,檢測和認證的整合將催生符合合規要求的捆綁式解決方案,從而確保服務提供者的持續收入來源。
隨著新法規的不斷訂定,檢測項目清單持續擴展,從過敏原交叉污染閾值到微塑膠污染限值,檢測服務規模保持穩定。認證服務的蓬勃發展源自於自有品牌零售商對消費者可視化保證的需求。同時投資於檢測和認證領域的實驗室可以實現交叉銷售,獲得長期契約,並保持80%以上的運轉率。 SGS的SMART系統展示如何透過即時儀錶板整合檢測資料和審核結果,為客戶建立一致的合規方案。這種端到端的可視性凸顯了外包給領先的、技術驅動型供應商的重要性。
區域分析
預計到2025年,亞太地區將佔全球銷售額的43.12%,並在2031年之前以6.98%的複合年成長率成長。在中國、印度和東南亞,加工能力和消費需求都在不斷成長,推動了對認證檢測實驗室的投資。印度政府在2024財政年度預算中資助了100家新的NABL認證實驗室,以支持國內安全監測系統和出口競爭力。北美仍然是監管創新的中心,FDA的LAAF計劃加快了認證速度,並增加了外包檢體的數量。雖然歐洲市場已經成熟,但對新污染物篩檢以及基於永續性和動物福利標準的優質認證服務的需求仍然穩定。
中東和非洲是新興市場中發展最快的地區,這主要得益於食品進口的成長和基礎設施的建設。菲律賓利用科技部提供的500萬菲律賓披索資金,在卡加延河谷地區建立了第一個食品品質檢驗機構,以加強區域安全監管。海灣合作理事會(GCC)成員國正在實施以國際食品法典委員會(轉碼器 Alimentarius)為藍本的統一殘留標準,這有助於分析方法的協調統一。拉丁美洲的出口主要依靠大豆和肉類,這些產品需要獲得多個司法管轄區的認證,但國內法規的分散限制了其成長速度。
區域比較凸顯了不同區域的成長促進因素。亞太地區的擴張主要得益於製造業規模的擴大和出口導向,而北美和歐洲則受益於嚴格的執法力度和自有品牌的蓬勃發展。非洲的成長與捐助方資助的能力建設和進口監管密切相關。擁有全球檢驗網路和數位資料網路的服務供應商可以利用這些區域特徵來維持較高的運轉率。
其他好處:
- Excel格式的市場預測(ME)表
- 3個月的分析師支持
目錄
第1章:引言
- 研究假設和市場定義
- 調查範圍
第2章:調查方法
第3章執行摘要
第4章 市場狀況
- 市場概覽
- 市場促進因素
- 世界各地的食品安全法規正變得越來越嚴格。
- 農產品和食品跨境貿易量增加
- 零售業自有品牌食品的擴張
- 整合第三方檢驗機構
- 面向農場的AI驅動型預測風險分析
- 利用區塊鏈技術實現強制性端到端可追溯性
- 市場限制因素
- 新興市場管理體制的差異
- 中小企業多標準認證成本高。
- 合格的食品毒理學家和審核員短缺
- 氣候因素導致的抽樣代表性差異
- 產業價值鏈分析
- 宏觀經濟因素的影響
- 監理情勢
- 技術展望
- 五力分析
- 新進入者的威脅
- 買方的議價能力
- 供應商的議價能力
- 替代品的威脅
- 產業競爭
第5章 市場規模與成長預測
- 按服務類型
- 測試服務
- 檢查服務
- 身份驗證服務
- 透過採購方式
- 內部
- 外包
- 按地區
- 北美洲
- 美國
- 加拿大
- 墨西哥
- 南美洲
- 巴西
- 阿根廷
- 其他南美國家
- 歐洲
- 德國
- 英國
- 法國
- 義大利
- 西班牙
- 俄羅斯
- 其他歐洲國家
- 亞太地區
- 中國
- 日本
- 印度
- 韓國
- 東南亞
- 其他亞太國家
- 中東和非洲
- 中東
- 沙烏地阿拉伯
- 阿拉伯聯合大公國
- 土耳其
- 其他中東國家
- 非洲
- 南非
- 奈及利亞
- 其他非洲國家
- 中東
- 北美洲
第6章 競爭情勢
- 市場集中度
- 策略趨勢
- 市佔率分析
- 公司簡介
- ALS Limited
- AsureQuality Limited
- Bioagri Certificadora SA
- Bureau Veritas SA
- BSI Group
- Control Union Certifications BV
- Cotecna Inspection SA
- DNV AS
- Eurofins Scientific SE
- Intertek Group plc
- Kiwa NV
- Lloyd's Register Group Limited
- Merieux NutriSciences Corporation
- NSF International
- Perry Johnson Registrars Inc.
- QIMA Limited
- RINA SpA
- SGS SA
- SQI Services Inc.
- TUV NORD GROUP
- TUV Rheinland Group
- TUV SUD AG
- UL LLC
- VERT Laboratories Inc.
第7章 市場機會與未來展望
According to Mordor Intelligence, the food and agriculture testing, inspection, and certification market size is expected to grow from USD 30.34 billion in 2025 to USD 32.27 billion in 2026 and is forecast to reach USD 43.92 billion by 2031 at 6.36% CAGR over 2026-2031.
This report is Segmented by Service Type (Testing Services, Inspection Services, and Certification Services), Sourcing Type (In-House and Outsourced), and Geography (North America, South America, Europe, Asia-Pacific, and the Middle East and Africa). The Market Forecasts are Provided in Terms of Value (USD).
Global Food And Agriculture Testing, Inspection, And Certification Market Trends and Insights
Growing stringency of global food-safety regulations
The United States FSMA LAAF program became fully operational in 2024 and requires laboratories to secure specific accreditations for designated analyses, increasing compliance costs and pushing food companies toward accredited third-party providers. Comparable tightening is visible in the European Union, where EFSA broadens risk-assessment frameworks and enforces stricter maximum residue limits, thereby expanding mandatory test panels. ISO 22000 and GFSI-benchmarked schemes such as BRCGS, IFS, and FSSC 22000 reduce regulatory fragmentation, yet they simultaneously elevate the minimum technical bar. As a result, smaller producers that once relied on basic in-house tests must now outsource more complex analyses, enlarging the food safety testing, inspection, and certification market. The requirement for multi-standard compliance turns safety verification into a fixed operating expense, insulating spending from normal economic cycles. Consolidated laboratory networks leverage their accreditation breadth to win long-term contracts and secure price premiums.
Rising cross-border agri-food trade volumes
Global food trade exposes single shipments to multiple regulatory regimes, multiplying the number of required assays per product. An exporter shipping processed seafood from Vietnam to the European Union must satisfy origin and destination pesticide, heavy-metal, microbiological, and labeling standards in parallel, creating incremental testing demand. Laboratories with multi-jurisdictional accreditations are well-positioned as exporters consolidate work with providers that deliver certificates accepted worldwide. Asia-Pacific anchors the growth because it is simultaneously a manufacturing base and a consumer market, leading to bidirectional flows that require verification at both ends. Mutual recognition agreements streamline some documentation yet paradoxically raise total assay counts by lowering barriers for smaller producers to reach new destinations. This dynamic sustains double-digit volume growth for regional laboratories, particularly in hubs such as Thailand and Vietnam.
Fragmented compliance regimes across emerging markets
Country-specific rules in emerging economies diverge from international standards, forcing exporters to navigate overlapping and sometimes conflicting test requirements. Vietnam and Nigeria, for example, introduced new residue limits and certification frameworks that are not yet harmonized with GFSI schemes, driving repeat sampling and duplicate documentation. Laboratories must maintain multiple accreditations, raising operating costs and lengthening turnaround times. Food companies adjust by limiting product lines or avoiding certain destinations, temporarily suppressing testing growth in those corridors until regulatory alignment improves.
Other drivers and restraints analyzed in the detailed report include:
- Expansion of retail private-label food brands
- Consolidation of third-party laboratories
- High cost of multi-standard accreditations for SMEs
For complete list of drivers and restraints, kindly check the Table Of Contents.
Segment Analysis
Testing Services accounted for 57.62% of the food and agriculture testing, inspection, and certification market in 2025, reflecting mandated pathogen, chemical residue, and nutritional analyses that every producer must complete. Certification Services grow faster at a 6.72% CAGR because brands use third-party stamps to differentiate on supermarket shelves. Inspection Services remain a smaller component, constrained by labor intensity yet indispensable for facility audits and process validation. Within Testing Services, demand for next-generation sequencing and LC-MS/MS drives premium pricing, while integrated data portals such as SGS SMART support value-added analytics. Over the forecast period, convergence between testing and certification will create bundled compliance solutions that lock in recurring revenue streams for providers.
Testing Services retain a critical mass because every new regulation, from allergen cross-contact thresholds to microplastic contamination limits, lengthens the assay checklist. Certification's momentum stems from private-label retailers seeking consumer-visible assurances. Laboratories that invest in both categories can cross-sell, secure long contracts, and maintain utilization rates above 80%. SGS's SMART illustrates how real-time dashboards integrate lab data and audit findings, establishing a single compliance narrative for clients. This end-to-end visibility reinforces the importance of outsourcing to large, tech-enabled providers.
Complete Report Scope:
- By Service Type
- Testing Services
- Inspection Services
- Certification Services
- By Sourcing Type
- In-house
- Outsourced
- By Geography
- North America
- United States
- Canada
- Mexico
- South America
- Brazil
- Argentina
- Rest of South America
- Europe
- Germany
- United Kingdom
- France
- Italy
- Spain
- Russia
- Rest of Europe
- Asia-Pacific
- China
- Japan
- India
- South Korea
- South-East Asia
- Rest of Asia-Pacific
- Middle East and Africa
- Middle East
- Saudi Arabia
- United Arab Emirates
- Turkey
- Rest of Middle East
- Africa
- South Africa
- Nigeria
- Rest of Africa
- Middle East
- North America
Geography Analysis
Asia-Pacific posted 43.12% of global revenue in 2025 and is forecast to grow at a 6.98% CAGR through 2031. China, India, and Southeast Asia expand both processing capacity and consumer demand, prompting investments in accredited laboratories. The Government of India funded 100 new NABL-accredited labs in the 2024 budget to support domestic safety oversight and export competitiveness. North America remains a center of regulatory innovation with the FDA's LAAF program driving accreditation upgrades and increasing outsourced sample flows. Europe, while mature, shows steady demand for novel contaminant screening and premium certification services anchored on sustainability and animal-welfare criteria.
The Middle East and Africa represent the fastest emerging opportunity due to rising food imports and infrastructure development. The Philippines set up its first food quality lab in Cagayan Valley with PHP 5 million DOST funding to improve regional safety oversight. Countries in the Gulf Cooperation Council implement unified residue limits modeled on Codex Alimentarius, stimulating assay harmonization. Latin America benefits from soybean and meat export volumes that require multi-jurisdiction certificates, yet fragmented domestic regulations temper growth rates.
Regional comparison highlights divergent drivers. Asia-Pacific's expansion originates from manufacturing scale and export orientation, whereas North America and Europe rely on stringent enforcement and private-label uptake. Africa's growth is tied to donor-funded capacity building and import surveillance. Providers with global lab footprints and digital data networks can arbitrage these regional nuances and maintain high utilization.
- ALS Limited
- AsureQuality Limited
- Bioagri Certificadora S.A.
- Bureau Veritas SA
- BSI Group
- Control Union Certifications B.V.
- Cotecna Inspection SA
- DNV AS
- Eurofins Scientific SE
- Intertek Group plc
- Kiwa NV
- Lloyd's Register Group Limited
- Merieux NutriSciences Corporation
- NSF International
- Perry Johnson Registrars Inc.
- QIMA Limited
- RINA S.p.A.
- SGS SA
- SQI Services Inc.
- TUV NORD GROUP
- TUV Rheinland Group
- TUV SUD AG
- UL LLC
- VERT Laboratories Inc.
Additional Benefits:
- The market estimate (ME) sheet in Excel format
- 3 months of analyst support
TABLE OF CONTENTS
1 INTRODUCTION
- 1.1 Study Assumptions and Market Definition
- 1.2 Scope of the Study
2 RESEARCH METHODOLOGY
3 EXECUTIVE SUMMARY
4 MARKET LANDSCAPE
- 4.1 Market Overview
- 4.2 Market Drivers
- 4.2.1 Growing stringency of global food-safety regulations
- 4.2.2 Rising cross-border agri-food trade volumes
- 4.2.3 Expansion of retail private-label food brands
- 4.2.4 Consolidation of third-party laboratories
- 4.2.5 AI-driven predictive risk profiling of farms
- 4.2.6 Blockchain-enabled end-to-end traceability mandates
- 4.3 Market Restraints
- 4.3.1 Fragmented compliance regimes across emerging markets
- 4.3.2 High cost of multi-standard accreditations for SMEs
- 4.3.3 Shortage of qualified food toxicologists and auditors
- 4.3.4 Climate-driven volatility in sampling representativeness
- 4.4 Industry Value Chain Analysis
- 4.5 Impact of Macroeconomic Factors
- 4.6 Regulatory Landscape
- 4.7 Technological Outlook
- 4.8 Porter's Five Forces Analysis Analysis
- 4.8.1 Threat of New Entrants
- 4.8.2 Bargaining Power of Buyers
- 4.8.3 Bargaining Power of Suppliers
- 4.8.4 Threat of Substitutes
- 4.8.5 Industry Rivalry
5 MARKET SIZE AND GROWTH FORECASTS (VALUE)
- 5.1 By Service Type
- 5.1.1 Testing Services
- 5.1.2 Inspection Services
- 5.1.3 Certification Services
- 5.2 By Sourcing Type
- 5.2.1 In-house
- 5.2.2 Outsourced
- 5.3 By Geography
- 5.3.1 North America
- 5.3.1.1 United States
- 5.3.1.2 Canada
- 5.3.1.3 Mexico
- 5.3.2 South America
- 5.3.2.1 Brazil
- 5.3.2.2 Argentina
- 5.3.2.3 Rest of South America
- 5.3.3 Europe
- 5.3.3.1 Germany
- 5.3.3.2 United Kingdom
- 5.3.3.3 France
- 5.3.3.4 Italy
- 5.3.3.5 Spain
- 5.3.3.6 Russia
- 5.3.3.7 Rest of Europe
- 5.3.4 Asia-Pacific
- 5.3.4.1 China
- 5.3.4.2 Japan
- 5.3.4.3 India
- 5.3.4.4 South Korea
- 5.3.4.5 South-East Asia
- 5.3.4.6 Rest of Asia-Pacific
- 5.3.5 Middle East and Africa
- 5.3.5.1 Middle East
- 5.3.5.1.1 Saudi Arabia
- 5.3.5.1.2 United Arab Emirates
- 5.3.5.1.3 Turkey
- 5.3.5.1.4 Rest of Middle East
- 5.3.5.2 Africa
- 5.3.5.2.1 South Africa
- 5.3.5.2.2 Nigeria
- 5.3.5.2.3 Rest of Africa
- 5.3.5.1 Middle East
- 5.3.1 North America
6 COMPETITIVE LANDSCAPE
- 6.1 Market Concentration
- 6.2 Strategic Moves
- 6.3 Market Share Analysis
- 6.4 Company Profiles (includes Global level Overview, Market level overview, Core Segments, Financials as available, Strategic Information, Market Rank/Share for key companies, Products and Services, and Recent Developments)
- 6.4.1 ALS Limited
- 6.4.2 AsureQuality Limited
- 6.4.3 Bioagri Certificadora S.A.
- 6.4.4 Bureau Veritas SA
- 6.4.5 BSI Group
- 6.4.6 Control Union Certifications B.V.
- 6.4.7 Cotecna Inspection SA
- 6.4.8 DNV AS
- 6.4.9 Eurofins Scientific SE
- 6.4.10 Intertek Group plc
- 6.4.11 Kiwa NV
- 6.4.12 Lloyd's Register Group Limited
- 6.4.13 Merieux NutriSciences Corporation
- 6.4.14 NSF International
- 6.4.15 Perry Johnson Registrars Inc.
- 6.4.16 QIMA Limited
- 6.4.17 RINA S.p.A.
- 6.4.18 SGS SA
- 6.4.19 SQI Services Inc.
- 6.4.20 TUV NORD GROUP
- 6.4.21 TUV Rheinland Group
- 6.4.22 TUV SUD AG
- 6.4.23 UL LLC
- 6.4.24 VERT Laboratories Inc.
7 MARKET OPPORTUNITIES AND FUTURE OUTLOOK
- 7.1 White-space and Unmet-Need Assessment

 全球農藥殘留檢測市場規模、佔有率、趨勢及成長分析報告(2026-2034年)
 農業檢驗市場規模、佔有率和趨勢分析報告:按樣本、類型、技術、最終用途、地區和細分市場預測(2026-2033 年)
 農業檢驗:市場佔有率分析、產業趨勢與統計、成長預測(2026-2031)馬來西亞和越南花卉栽培材料:市場佔有率分析、行業趨勢和統計數據以及成長預測(2026-2031 年)
 農業檢驗市場:2026-2032年全球市場預測(按檢驗類型、作物類型、技術、服務形式、最終用戶和應用分類)
 農藥殘留檢測市場:商機、成長要素、產業趨勢分析及2026-2035年預測
 農業用品直銷市場:未來預測(至2034年)-依產品類型、平台類型、經營模式、作物類型、農場規模、最終用戶、通路和地區進行分析
 農業檢驗市場規模、佔有率、趨勢和預測:按樣本、技術、應用和地區分類(2026-2034 年)
 2026年全球農業材料市場報告
 農業檢驗市場:依樣本數和地區分類