


 |
市場調查報告書
商品編碼
2116018
生質柴油:市場佔有率分析、產業趨勢與統計、成長預測(2026-2031)Biodiesel - Market Share Analysis, Industry Trends & Statistics, Growth Forecasts (2026 - 2031) |
||||||

※ 本網頁內容可能與最新版本有所差異。詳細情況請與我們聯繫。
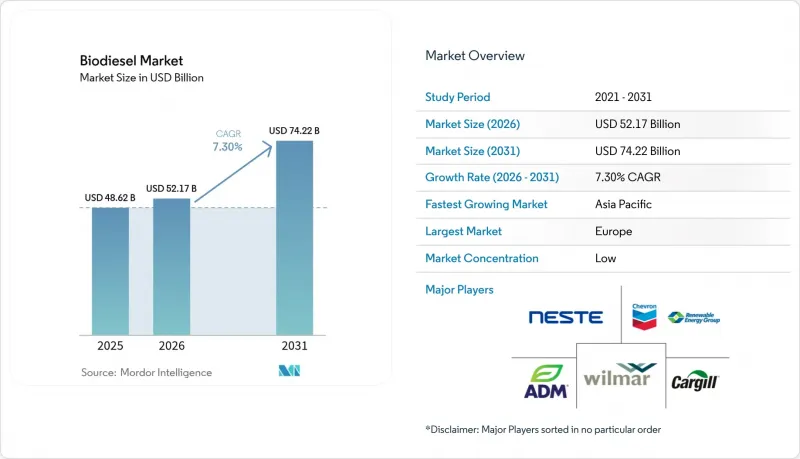
據 Mordor Intelligence 稱,2025 年生物柴油市場價值為 486.2 億美元,預計到 2031 年將達到 742.2 億美元,而 2026 年為 521.7 億美元,預測期(2026-2031 年)的複合年成長率為 7.30%。
本報告依原料(植物油、廢食用油、動物脂肪等)、製造流程(酯交換、氫化植物油、柴油共加工/共精煉)、混合比例(B5 及以下、B6-B20、B100)、應用(運輸及道路、工業及其他等)及地區(北美、歐洲、亞太地區、南美洲、中東和非洲)進行分類。
全球生物柴油市場趨勢與洞察
可再生的範圍擴大。
各國強制性生物柴油摻混計畫正在迅速擴展,確保了可觀的需求,並為生物柴油市場的長期資金籌措奠定了基礎。巴西的「未來燃料法」將強制性摻混比例從B14提高到2027年的B17,並預計在2020年代末過渡到B25,這將使巴西國內生物柴油使用量從2024年的93億升增加到2027年的123億升。印尼正在實施B40計劃,而所有歐盟成員國都必須遵守RED-III指令規定的更高先進生質燃料配額標準。不列顛哥倫比亞省強制規定,從2025年4月起,柴油燃料中8%的可再生成分必須在本地生產,這顯示各國正在製定優先考慮本地供應的法規。在美國,可再生燃料標準(RFS)仍然有效,為合規性提供了可靠的標準。這些法規設定了價格上限,使生產商能夠擴大生產能力並採用提高效率的技術。
在難以脫碳的產業中,推行「直接脫碳」方案。
在採礦、航運和鐵路等電氣化進程滯後的行業,生物柴油混合燃料的採用正在推進,旨在無需對基礎設施維修即可實現短期碳減排目標。全球礦業公司每年在柴油設備上的支出約為70億美元,但改用B20或可再生柴油可將生命週期排放量減少50%至85%,同時大幅降低粒狀物排放。在歐洲,雪佛龍再生能源集團(REG)供應符合EN 14214標準的燃料,可將礦場中的顆粒物濃度從300-800微克/立方公尺降低至50-200微克/立方公尺。在航運業,REG與Bunker Holding合作推廣B30,貨運鐵路的試點運作表明,B30與引擎不存在相容性問題。這些行業日益成長的脫碳成本意願支撐了生物柴油市場的高利潤銷售。
原物料價格波動
2024年全年,豆油價格波動劇烈。這主要是由於巴西高比例混合燃料的普及推高了需求,擠壓了生產商的利潤空間,並促使多家工廠最佳化生產。隨著低碳燃料標準(LCFS)積分的納入,廢棄食用油(UCO)的價格接近新油,削弱了其預期的成本優勢。儘管柴油價格基準保持不變,但Neste公司仍將原物料成本上漲列為2024年利潤率下降的主要原因。氣候變遷帶來的干擾以及持續不斷的糧食和燃料衝突進一步加劇了價格的不確定性,迫使生質柴油市場的企業盡可能實現原料多元化並採取避險策略。
細分市場分析
到2025年,植物油將佔生質柴油供應量的63.45%,維持生質柴油市場的基準供應水平,但隨著政策制定者和買家追求更低的碳排放強度,其成長速度正在放緩。棕櫚油在東南亞佔據主導地位,大豆油在南美洲則佔據主導地位,但兩者都面臨土地利用風險的嚴格審查。
預計廢棄食用油和動物脂肪將以10.15%的複合年成長率成長,顯著超過食用油的成長速度,這主要得益於低碳燃料標準(LCFS)的溢價以及新興的先進生質燃料配額。巴西牛油出口年增144%,顯示全球套利機會正在擴大。耐斯特(Neste)和拜耳(Bayer)合作開展的藻類油和冬季菜籽先導計畫,展現了原料研發領域的開拓性努力。目前,殘渣資源的競爭日益激烈,導致價格出現新的波動,同時也穩定提升整個生質柴油市場的永續性標準。
由於其資本投入相對較低且與現有供應鏈相容,人們熟知的酯交換製程預計到 2025 年將佔據生質柴油市場規模的 70.35% 佔有率。這仍然是許多中小生產者的主要驅動力,尤其是在煉油設施整合程度有限的開發中國家。
然而,隨著大型石油公司利用現有的加氫處理設備建造通用柴油、永續航空燃料油(SAF)和石腦油生產線,預計HVO的產能將以11.74%的複合年成長率成長。 HVO為生物柴油市場帶來顯著優勢,因為它與化石柴油的基礎設施相容性相當,並且可以生產出與B100相當的燃料,而不會出現低溫流動性問題。高價值的工業燃料和靈活的原料種類進一步提高了工廠的盈利,從而推動了全部區域現有設施改造和新建設項目的激增。
區域分析
至2025年,歐洲將佔全球銷售量的37.62%,並透過RED-III配額、國家碳排放稅以及廢棄物衍生原料補貼計畫等措施,持續推動低碳生物柴油的使用。德國、法國和英國都將在2025年加強其生物柴油摻混義務,北歐國家在從城市垃圾中回收廢棄食用油進行本地加工方面發揮著先鋒作用,從而促進了區域循環經濟目標的實現。然而,永續性認證標準依然嚴格,限制了原料的選擇,並增加了行政負擔。
預計亞太地區將成為成長最快的地區,到2031年複合年成長率(CAGR)將達到10.02%。這主要得益於印尼逐步提高其B40減排目標、印度為擴大產能提供津貼以及中國將生質柴油納入其「碳中和」藍圖。該地區是生物柴油市場的戰略成長引擎,其成長動力來自充足的棕櫚油供應、不斷成長的都市區柴油需求以及政府的財政獎勵。然而,由於與森林砍伐相關的法規限制了對歐洲的出口,迫使生產商加強可追溯性協議。
在北美,成熟的基礎設施和政策穩定性得益於美國可再生燃料標準(RFS)和各州不斷擴展的低碳燃料標準(LCFS)所構成的綜合框架。儘管成熟的碳權交易拓展了收入來源,但近期LCFS碳權供應過剩給價格帶來了壓力。南美洲引領巴西向B25標準過渡,既是原料供應地,也是重要的國內市場。阿根廷生產商憑藉其大豆油生產規模和成熟的酯化技術,儘管面臨出口關稅的挑戰,仍保持區域競爭力。
其他好處:
- Excel格式的市場預測(ME)表
- 3個月的分析師支持
目錄
第1章:引言
- 研究假設和市場定義
- 調查範圍
第2章:調查方法
第3章執行摘要
第4章 市場狀況
- 市場概覽
- 市場促進因素
- 在美國、巴西、印尼和歐盟,混合可再生燃料的強制性要求已擴大(從 B5 擴大到 B20)。
- 難以減少排放的產業(採礦、航運、鐵路)對可直接替代的低碳燃料的需求。
- 主要石油公司(道達爾能源、英國石油、殼牌)擴大HVO/SAF產能,推動了甘油的吸收利用。
- 由於廢棄物和殘渣(廢棄食用油、動物脂肪)產生的原料補貼,生物柴油和柴油之間的價格差異正在擴大。
- 利用現有煉油廠的協同加工技術降低資本支出(CAPEX)。
- 低碳燃料標準和歐盟排放交易體系中的優質碳強度(CI)評分
- 市場限制因素
- 原料價格(大豆油、動物脂肪)的波動給利潤率帶來了壓力。
- 對土地利用變化和歐盟RED-II法規中關於糧食作物衍生生質燃料上限的規定進行審查
- 美國低碳燃料標準 (LCFS) 中低合約碳權額度的過剩正在拉低生物柴油價格。
- 輕型商用車車隊的電氣化正在減少道路上的柴油車數量。
- 供應鏈分析
- 監管環境與政府政策
- 技術趨勢(脂肪酸甲酯、氫化植物油、共加工、藻類)
- 波特五力模型
- 投資分析
第5章 市場規模與成長預測
- 按原料
- 植物油
- 廢棄食用油和動物油脂
- 動物脂肪
- 藻類和新型原料
- 透過生產過程
- 酯交換反應(FAME)
- 氫化植物油(HVO)
- 柴油的共加工與共精煉
- 混合水平
- B5 或更低
- B6~B20
- B100
- 透過使用
- 交通運輸-道路
- 交通運輸-海運和鐵路
- 發電
- 工業及其他
- 按地區
- 北美洲
- 美國
- 加拿大
- 墨西哥
- 歐洲
- 德國
- 英國
- 法國
- 義大利
- 北歐國家
- 俄羅斯
- 其他歐洲國家
- 亞太地區
- 中國
- 印度
- 日本
- 韓國
- 東南亞國協
- 澳洲和紐西蘭
- 其他亞太國家
- 南美洲
- 巴西
- 阿根廷
- 其他南美國家
- 中東和非洲
- 沙烏地阿拉伯
- 阿拉伯聯合大公國
- 南非
- 埃及
- 其他中東和非洲國家
- 北美洲
第6章 競爭情勢
- 市場集中度
- 策略趨勢(併購、聯盟、購電協議)
- 市場佔有率分析(主要公司的市場排名和佔有率)
- 公司簡介
- Neste Oyj
- Chevron Renewable Energy Group
- Archer Daniels Midland(ADM)
- Cargill
- Bangchak Corp.
- Wilmar International
- Valero Energy
- TotalEnergies
- BP Biofuels
- Shell Renewables & Energy Solutions
- Marathon Petroleum(Green Bison)
- Louis Dreyfus Company
- Be8 Energy
- Incobrasa
- Pacific Biodiesel
- AG Processing Inc.
- Bunge Bioenergia
- Green Plains Inc.
- Eni Biofuels
- Petrobras BioRefino
第7章 市場機會與未來展望
According to Mordor Intelligence, the biodiesel market size was valued at USD 48.62 billion in 2025 and estimated to grow from USD 52.17 billion in 2026 to reach USD 74.22 billion by 2031, at a CAGR of 7.30% during the forecast period (2026-2031).
This report is Segmented by Feedstock (Vegetable Oils, Waste Cooking Oil and Tallow, and More), Production Process (Trans-Esterification, Hydro-Treated Vegetable Oil, and Co-processed/Co-refined Diesel), Blend Level (B5 and Below, B6 To B20, and B100), Application (Transportation-Road, Industrial and Others, and More), and Geography (North America, Europe, Asia-Pacific, South America, and Middle East and Africa).
Global Biodiesel Market Trends and Insights
Renewable-fuel Blend Mandates Expanding
National blend programmes are scaling rapidly, guaranteeing sizeable offtake volumes and underpinning long-term financing across the biodiesel market. Brazil's Fuel-of-the-Future law raises the obligatory blend from B14 to B17 by 2027 and foresees B25 later in the decade, lifting domestic biodiesel use from 9.3 billion litres in 2024 to 12.3 billion litres by 2027. Indonesia is rolling out its B40 programme, while all EU member states must align with higher advanced biofuel quotas under RED-III. British Columbia now insists that 8% of diesel renewable content be produced domestically from April 2025, signalling how mandates increasingly favour local supply. Renewable Fuel Standard obligations remain in force in the United States and provide a dependable compliance baseline. These rules establish price floors, enabling producers to expand capacity and adopt efficiency-enhancing technologies.
Hard-to-Abate Sectors Seeking Drop-in Decarbonisation
Mining, marine, and rail operators' segments, where electrification lags, are adopting biodiesel blends to meet near-term carbon-reduction goals without infrastructure overhauls. Global mining firms spend roughly USD 7 billion annually on diesel equipment; switching to B20 or renewable diesel delivers 50-85% lifecycle emission cuts while lowering particulate outputs sharply. In Europe, Chevron Renewable Energy Group supplies EN 14214-grade fuel that cuts particulate matter in mines from 300-800 µg m3 to 50-200 µg m3. Marine uptake is growing through REG-Bunker Holding alliances to deploy B30, and freight rail trials show seamless engine compatibility. Willingness to pay decarbonisation premiums in these sectors supports higher-margin sales within the biodiesel market.
Feedstock Price Volatility
Soybean-oil quotations oscillated sharply through 2024 as Brazil's higher blends drew more volumes, eroding producer margins and prompting output optimisation at several plants. UCO values approached virgin-oil parity once LCFS credits were incorporated, diluting expected cost advantages. Neste cited elevated feedstock costs as a principal factor behind depressed margins in 2024 despite flat diesel benchmarks. Climatic disruptions and ongoing food-versus-fuel tensions compound price uncertainty, compelling firms across the biodiesel market to diversify inputs or adopt hedging strategies where possible.
Other drivers and restraints analyzed in the detailed report include:
- HVO and SAF Capacity Build-outs
- Waste- & Residue-based Feedstock Credits
- Land-use Change Scrutiny
For complete list of drivers and restraints, kindly check the Table Of Contents.
Segment Analysis
Vegetable oils still delivered 63.45% of the 2025 supply, sustaining baseline volumes for the biodiesel market, yet their growth tempo is flattening as policymakers and buyers chase lower carbon-intensity scores. Palm oil dominates South-East Asia, whereas soybean oil prevails in the Americas, but each faces scrutiny over land-use risks.
Waste cooking oil and tallow are projected to expand at a 10.15% CAGR, well ahead of edible oils, thanks to premium LCFS credits and emerging advanced-biofuel quotas. Brazil's beef-tallow exports, rising 144% year-on-year, signal widening global arbitrage. Algae-based oils and winter-canola pilots from the Neste-Bayer alliance illustrate the exploratory edge of feedstock R&D. Competition for residues is now sharpening, inserting new price volatility while steadily raising the sustainability bar across the biodiesel market.
The familiar trans-esterification route retained 70.35% share of the biodiesel market size in 2025 by virtue of its comparatively light capital burden and well-established supply chain compatibility. It remains the mainstay for many small-to-mid producers, particularly in developing economies with limited refinery integration.
However, HVO capacity is forecast to clock a 11.74% CAGR as oil majors leverage existing hydrotreaters to create fungible diesel, SAF, and naphtha streams. The biodiesel market benefits because HVO commands infrastructure parity with fossil diesel, enabling B100 equivalents without cold-flow problems. Higher-value technical-grade glycerin and flexible feedstock windows further enhance plant returns, spurring a pipeline of conversions and greenfields across Europe, North America, and Asia-Pacific.
Complete Report Scope:
- By Feedstock
- Vegetable Oils
- Waste Cooking Oil and Tallow
- Animal Fat
- Algae and Novel Feedstocks
- By Production Process
- Trans-esterification (FAME)
- Hydro-treated Vegetable Oil (HVO)
- Co-processed/Co-refined Diesel
- By Blend Level
- B5 and Below
- B6 to B20
- B100
- By Application
- Transportation-Road
- Transportation-Marine and Rail
- Power Generation
- Industrial and Others
- By Geography
- North America
- United States
- Canada
- Mexico
- Europe
- Germany
- United Kingdom
- France
- Italy
- NORDIC Countries
- Russia
- Rest of Europe
- Asia-Pacific
- China
- India
- Japan
- South Korea
- ASEAN Countries
- Australia & New Zealand
- Rest of Asia-Pacific
- South America
- Brazil
- Argentina
- Rest of South America
- Middle East and Africa
- Saudi Arabia
- United Arab Emirates
- South Africa
- Egypt
- Rest of Middle East and Africa
- North America
Geography Analysis
Europe delivered 37.62% of global sales in 2025 and continues to reward low-carbon biodiesel through RED-III quotas, national carbon taxes, and subsidy schemes for waste-based feedstocks. Germany, France, and the United Kingdom each tightened blend obligations in 2025, and the Nordics are frontrunners in collecting municipal UCO for local processing, reinforcing regional circular-economy objectives. Sustainability certification remains stringent however, limiting feedstock choice and raising administrative overhead.
Asia-Pacific offers the fastest expansion path, showing a 10.02% CAGR projection to 2031 as Indonesia escalates toward B40, India allocates grants for capacity, and China integrates biodiesel into its dual-carbon roadmap. Accessible palm-oil supply, rising urban diesel demand, and supportive fiscal incentives make the region a strategic growth engine inside the biodiesel market. Nonetheless, export potential to Europe is checked by deforestation-linked rulings, compelling producers to upgrade traceability protocols.
North America holds mature infrastructure and policy stability via the U.S. Renewable Fuel Standard and an expanding patchwork of state-level Low Carbon Fuel Standards. Advanced credit trading deepens revenue pools, yet LCFS credit oversupply recently squeezed pricing. South America, led by Brazil's trajectory toward B25, is simultaneously a feedstock powerhouse and a major internal market. Argentina's producers navigate export tariffs but maintain competitiveness regionally through soybean-oil scale and established esterification expertise.
- Neste Oyj
- Chevron Renewable Energy Group
- Archer Daniels Midland (ADM)
- Cargill
- Bangchak Corp.
- Wilmar International
- Valero Energy
- TotalEnergies
- BP Biofuels
- Shell Renewables & Energy Solutions
- Marathon Petroleum (Green Bison)
- Louis Dreyfus Company
- Be8 Energy
- Incobrasa
- Pacific Biodiesel
- AG Processing Inc.
- Bunge Bioenergia
- Green Plains Inc.
- Eni Biofuels
- Petrobras BioRefino
Additional Benefits:
- The market estimate (ME) sheet in Excel format
- 3 months of analyst support
TABLE OF CONTENTS
1 Introduction
- 1.1 Study Assumptions & Market Definition
- 1.2 Scope of the Study
2 Research Methodology
3 Executive Summary
4 Market Landscape
- 4.1 Market Overview
- 4.2 Market Drivers
- 4.2.1 Renewable-fuel blend mandates expanding (B5 to B20) in U.S., Brazil, Indonesia, EU
- 4.2.2 Demand from hard-to-abate sectors (mining, marine, rail) seeking drop-in low-carbon fuels
- 4.2.3 HVO/SAF capacity build-outs by oil majors (TotalEnergies, BP, Shell) drive glycerin off-take
- 4.2.4 Waste- & residue-based feedstock credits (UCO, tallow) widen biodiesel-diesel margin
- 4.2.5 Co-processing tech lowering CAPEX via existing refineries
- 4.2.6 Carbon-intensity (CI) score premiums on LCFS & EU ETS
- 4.3 Market Restraints
- 4.3.1 Feedstock price volatility (soy-oil, tallow) squeezes margins
- 4.3.2 Land-use change scrutiny & EU RED-II cap on food-crop biofuels
- 4.3.3 Oversupply of low-CI credits in U.S. LCFS depresses biodiesel prices
- 4.3.4 Electrification of light-duty fleets slows on-road diesel pool
- 4.4 Supply-Chain Analysis
- 4.5 Regulatory Landscape & Government Policies
- 4.6 Technological Outlook (FAME, HVO, co-processing, algae)
- 4.7 Porter's Five Forces
- 4.7.1 Bargaining Power of Suppliers
- 4.7.2 Bargaining Power of Buyers
- 4.7.3 Threat of New Entrants
- 4.7.4 Threat of Substitutes
- 4.7.5 Intensity of Competitive Rivalry
- 4.8 Investment Analysis
5 Market Size & Growth Forecasts
- 5.1 By Feedstock
- 5.1.1 Vegetable Oils
- 5.1.2 Waste Cooking Oil and Tallow
- 5.1.3 Animal Fat
- 5.1.4 Algae and Novel Feedstocks
- 5.2 By Production Process
- 5.2.1 Trans-esterification (FAME)
- 5.2.2 Hydro-treated Vegetable Oil (HVO)
- 5.2.3 Co-processed/Co-refined Diesel
- 5.3 By Blend Level
- 5.3.1 B5 and Below
- 5.3.2 B6 to B20
- 5.3.3 B100
- 5.4 By Application
- 5.4.1 Transportation-Road
- 5.4.2 Transportation-Marine and Rail
- 5.4.3 Power Generation
- 5.4.4 Industrial and Others
- 5.5 By Geography
- 5.5.1 North America
- 5.5.1.1 United States
- 5.5.1.2 Canada
- 5.5.1.3 Mexico
- 5.5.2 Europe
- 5.5.2.1 Germany
- 5.5.2.2 United Kingdom
- 5.5.2.3 France
- 5.5.2.4 Italy
- 5.5.2.5 NORDIC Countries
- 5.5.2.6 Russia
- 5.5.2.7 Rest of Europe
- 5.5.3 Asia-Pacific
- 5.5.3.1 China
- 5.5.3.2 India
- 5.5.3.3 Japan
- 5.5.3.4 South Korea
- 5.5.3.5 ASEAN Countries
- 5.5.3.6 Australia & New Zealand
- 5.5.3.7 Rest of Asia-Pacific
- 5.5.4 South America
- 5.5.4.1 Brazil
- 5.5.4.2 Argentina
- 5.5.4.3 Rest of South America
- 5.5.5 Middle East and Africa
- 5.5.5.1 Saudi Arabia
- 5.5.5.2 United Arab Emirates
- 5.5.5.3 South Africa
- 5.5.5.4 Egypt
- 5.5.5.5 Rest of Middle East and Africa
- 5.5.1 North America
6 Competitive Landscape
- 6.1 Market Concentration
- 6.2 Strategic Moves (M&A, Partnerships, PPAs)
- 6.3 Market Share Analysis (Market Rank/Share for key companies)
- 6.4 Company Profiles (includes Global level Overview, Market level overview, Core Segments, Financials as available, Strategic Information, Products & Services, and Recent Developments)
- 6.4.1 Neste Oyj
- 6.4.2 Chevron Renewable Energy Group
- 6.4.3 Archer Daniels Midland (ADM)
- 6.4.4 Cargill
- 6.4.5 Bangchak Corp.
- 6.4.6 Wilmar International
- 6.4.7 Valero Energy
- 6.4.8 TotalEnergies
- 6.4.9 BP Biofuels
- 6.4.10 Shell Renewables & Energy Solutions
- 6.4.11 Marathon Petroleum (Green Bison)
- 6.4.12 Louis Dreyfus Company
- 6.4.13 Be8 Energy
- 6.4.14 Incobrasa
- 6.4.15 Pacific Biodiesel
- 6.4.16 AG Processing Inc.
- 6.4.17 Bunge Bioenergia
- 6.4.18 Green Plains Inc.
- 6.4.19 Eni Biofuels
- 6.4.20 Petrobras BioRefino
7 Market Opportunities & Future Outlook
- 7.1 White-space & Unmet-need Assessment

 酯交換催化劑市場:全球市場預測,2026-2032年
 歐洲生質柴油:市場佔有率分析、產業趨勢與統計及成長預測(2026-2031)可再生柴油市場:全球市場預測,2026-2032年生質柴油市場:依原料、純度等級、形態、應用及通路分類-2026-2032年全球市場預測
 可再生柴油市場機會、成長要素、產業趨勢分析及2026-2035年預測。
 生物柴油市場規模、佔有率和成長分析:按生質燃料類型、混合比例、生產技術、原料類型、應用、最終用戶、分銷管道和地區分類-2026-2033年產業預測
 生質柴油催化劑市場:依催化劑種類、催化劑原料、原料、催化劑應用、催化劑形式及地區分類。
 生質柴油市場規模、佔有率、趨勢和預測:按原料、應用、類型、製造技術和地區分類,2026-2034年生物柴油市場機會、成長要素、產業趨勢分析及2026-2035年預測
 可再生柴油市場規模、佔有率和趨勢分析報告:按來源、應用、地區和細分市場預測(2026-2033 年)