


 |
市場調查報告書
商品編碼
2071319
可再生柴油市場機會、成長要素、產業趨勢分析及2026-2035年預測。Renewable Diesel Market Opportunity, Growth Drivers, Industry Trend Analysis, and Forecast 2026 - 2035 |
||||||

全球可再生柴油市場預計到 2025 年將達到 258 億美元,年複合成長率為 8.7%,到 2035 年將達到 579 億美元。
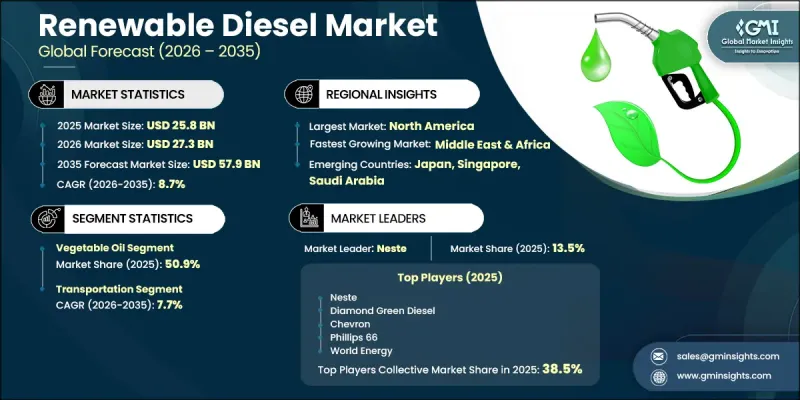
儘管交通運輸領域仍是主要的消費領域,但航空和發電領域正迅速崛起,成為具有高成長潛力的新興終端用戶領域。關鍵地區的法律規範透過明確長期燃料需求預測,提高了投資的確定性,從而推動了新工廠的建設和煉油廠的改造項目。可再生柴油在脫碳策略中正獲得顯著的結構性優勢,因為它可以直接取代現有引擎中的傳統柴油,且無需混合限制。與其他生質燃料相比,它與現有加油基礎設施的兼容性使其成為更具擴充性的解決方案。投資活動日益集中在大規模生物煉油廠和綜合煉油廠改造計畫。同時,物流、航空和產業部門的企業脫碳措施正在增強基於合約的需求。然而,由於廢棄物衍生原料(例如廢食用油和動物脂肪)的需求持續超過永續供應水平,原料供應仍受到限制。
| 市場範圍 | |
|---|---|
| 開始年份 | 2025 |
| 預測期 | 2026-2035 |
| 上市時的市場規模 | 258億美元 |
| 預計金額 | 579億美元 |
| 複合年成長率 | 8.7% |
植物油市佔率佔50.9%,預計到2025年將達到131億美元,到2035年將以6.2%的複合年成長率成長。儘管其成長率相對低於其他替代原料,但它仍然是最成熟的原料類別。需求趨勢受到主要生產和消費地區長期採購結構的影響,不同類型的油脂根據農業產量和工業加工能力在區域供應鏈中佔據主導地位。
預計到2035年,交通運輸領域的複合年成長率將達到7.7%。其優點在於可再生柴油可以直接取代石油柴油,無需對現有引擎或加油系統進行任何改造。這種相容性顯著降低了基礎設施轉型成本,並有助於其在貨運、物流和商用車行業的大規模應用。
預計到2025年,北美可再生柴油市場規模將達到1,24億美元,佔47.9%的市場佔有率,並將在2035年之前以8.9%的複合年成長率成長。美國是這一成長的核心,這主要得益於國內供應量的顯著增加,而這又源於產能的大幅擴張和煉油廠的大規模改造。對低碳燃料基礎設施的持續投資以及強力的政策支持,將繼續鞏固該地區在可再生柴油生產和消費領域的主導地位。
目錄
第1章:調查方法和範圍
第2章執行摘要
第3章 行業洞察
- 產業生態系統
- 原物料供應及採購分析
- 生產能力評估
- 供應鏈韌性與風險因素
- 配電網路分析
- 監理情勢
- 北美洲
- 歐洲
- 亞太地區
- 中東和非洲
- 拉丁美洲
- 影響產業的因素
- 促進因素
- 產業潛在風險與挑戰
- 成長潛力分析
- 波特的分析
- PESTLE分析
- 成本結構分析:可再生柴油
- 價格趨勢分析
- 美元/噸(以原料計)
- 依球員類型分類的定價策略(高級球員、超值球員、成本加成球員)
- 貿易數據分析
- 進出口額趨勢
- 主要貿易路線及關稅的影響
- 生產能力和運轉率
- 各國具體生產能力
- 運轉率和擴張計劃
- 人工智慧和生成式人工智慧對市場的影響
- 預測性維護和故障檢測
- 電網最佳化和負載預測
- 利用數位雙胞胎進行模擬和測試
- 風險、限制和監管考量
- 新機會和趨勢
- 數位化和物聯網整合
- 進入新興市場
- 整體投資情勢與未來展望
第4章 競爭情勢
- 介紹
- 企業市佔率分析:按地區分類
- 北美洲
- 歐洲
- 亞太地區
- 中東和非洲
- 拉丁美洲
- 主要市場公司的競爭分析
- 競爭定位矩陣
- 主要進展
- 併購
- 夥伴關係和聯盟
- 新產品發布
- 業務拓展計劃及資金籌措
- 按公司規模進行基準測試
- 排名分類標準與遴選標準
- 按銷售額、地區和創新能力分類的層級定位矩陣。
第5章 市場規模及預測:依原料分類,2022-2035年
- 動物脂肪
- 植物油
- 用過的食用油
- 其他
第6章 市場規模與預測:依應用領域分類,2022-2035年
- 運輸
- 發電
- 航空
- 其他
第7章 市場規模及預測:依產能分類,2022-2035年
- 小規模(小於15萬噸)
- 中型(15萬噸至90萬噸)
- 大型(超過90萬噸)
第8章 市場規模及預測:依地區分類,2022-2035年
- 北美洲
- 美國
- 加拿大
- 歐洲
- 德國
- 法國
- 西班牙
- 英國
- 義大利
- 亞太地區
- 中國
- 印度
- 印尼
- 澳洲
- 日本
- 新加坡
- 中東和非洲
- 沙烏地阿拉伯
- 南非
- 拉丁美洲
- 巴西
- 阿根廷
第9章:公司簡介
- BP
- Cargill
- Carolina Renewable Products
- Chevron
- Diamond Green Diesel
- Eni
- Gevo
- HollyFrontier
- Imperial Oil
- LanzaJet
- Marathon Petroleum
- Neste
- Petrobras
- Phillips 66
- Preem AB
- Repsol
- Shell
- TotalEnergies
- Valero
- World Energy
The Global Renewable Diesel Market was valued at USD 25.8 billion in 2025 and is estimated to grow at a CAGR of 8.7% to reach USD 57.9 billion by 2035.
Transportation remains the dominant consumption segment, while aviation and power generation are emerging as expanding end-use areas with strong growth potential. Regulatory frameworks in key regions are improving investment certainty by supporting long-term fuel demand visibility, which is encouraging both new plant development and refinery conversion projects. Renewable diesel is gaining strong structural advantages in decarbonization strategies because it can directly replace conventional diesel in existing engines without blending restrictions. This compatibility with current fueling infrastructure makes it a highly scalable solution compared to other biofuels. Investment activity is increasingly concentrated in large-scale biorefineries and integrated refinery transformation projects. At the same time, corporate decarbonization commitments from logistics, aviation, and industrial sectors are strengthening contracted demand. However, feedstock availability remains constrained as demand for waste-based inputs such as used cooking oil and animal fats continues to exceed sustainable supply levels.
| Market Scope | |
|---|---|
| Start Year | 2025 |
| Forecast Year | 2026-2035 |
| Start Value | $25.8 Billion |
| Forecast Value | $57.9 Billion |
| CAGR | 8.7% |
The vegetable oil segment accounted for 50.9% share, representing USD 13.1 billion in 2025, and is expected to grow at a CAGR of 6.2% through 2035. It remains the most established feedstock category, though its growth rate is comparatively lower than alternative sources. Demand patterns are influenced by long-standing sourcing structures across major producing and consuming regions, where different oil types dominate regional supply chains based on agricultural availability and industrial processing capacity.
The transportation segment is expected to grow at a CAGR of 7.7% by 2035. Its dominance is driven by the ability of renewable diesel to function as a direct substitute for petroleum diesel without requiring modifications to existing engines or fueling systems. This compatibility significantly reduces infrastructure transition costs and supports large-scale adoption across freight, logistics, and commercial vehicle operations.
North America Renewable Diesel Market held a 47.9% share in 2025, valued at USD 12.4 billion, and is projected to grow at a CAGR of 8.9% through 2035. The United States serves as the central growth hub, supported by extensive production capacity additions and large-scale refinery conversions that have significantly increased domestic supply availability. Expanding investment in low-carbon fuel infrastructure and strong policy support continue to reinforce regional leadership in renewable diesel production and consumption.
Major companies operating in the global renewable diesel market include Neste, Chevron, Valero, Marathon Petroleum, Shell, BP, TotalEnergies, Phillips 66, Repsol, Eni, Cargill, World Energy, Diamond Green Diesel, Gevo, LanzaJet, HollyFrontier, Preem AB, Imperial Oil, Petrobras, and Carolina Renewable Products. Companies operating in the renewable diesel market are focusing on scaling production capacity, securing long-term feedstock supply agreements, and expanding refinery conversion projects to strengthen their competitive positioning. A key strategic priority is vertical integration across the value chain, enabling better control over feedstock sourcing, refining processes, and distribution networks. Firms are increasingly investing in advanced hydrotreatment technologies to improve fuel yield efficiency and reduce production costs. Strategic partnerships with airlines, logistics operators, and industrial end users are helping secure long-term offtake agreements and stabilize revenue streams. Companies are also expanding geographically into high-demand regions with supportive policy environments.
Table of Contents
Chapter 1 Methodology & Scope
- 1.1 Research design
- 1.2 Quality commitment
- 1.2.1 GMI AI policy & data integrity commitment
- 1.2.1.1 Source consistency protocol
- 1.2.1 GMI AI policy & data integrity commitment
- 1.3 Research Trail & Confidence Scoring
- 1.3.1 Research Trail Components
- 1.3.2 Scoring Components
- 1.4 Data Collection
- 1.4.1 Partial list of primary sources
- 1.5 Data mining sources
- 1.5.1 Paid sources
- 1.5.1.1 Sources, by region
- 1.5.1 Paid sources
- 1.6 Base estimates and calculations
- 1.6.1 Base year calculation for any one approach
- 1.7 Forecast model
- 1.8 Research transparency addendum
- 1.8.1 Source attribution framework
- 1.8.2 Quality assurance metrics
- 1.8.3 Our commitment to trust
- 1.9 Market definitions
Chapter 2 Executive Summary
- 2.1 Industry synopsis, 2022 - 2035
- 2.2 Business trends
- 2.3 Feedstock trends
- 2.4 Application trends
- 2.5 Capacity trends
- 2.6 Regional trends
Chapter 3 Industry Insights
- 3.1 Industry ecosystem
- 3.1.1 Raw material availability & sourcing analysis
- 3.1.2 Manufacturing capacity assessment
- 3.1.3 Supply chain resilience & risk factors
- 3.1.4 Distribution network analysis
- 3.2 Regulatory landscape
- 3.2.1 North America
- 3.2.2 Europe
- 3.2.3 Asia Pacific
- 3.2.4 Middle East & Africa
- 3.2.5 Latin America
- 3.3 Industry impact forces
- 3.3.1 Growth drivers
- 3.3.2 Industry pitfalls & challenges
- 3.4 Growth potential analysis
- 3.5 Porter's analysis
- 3.5.1 Bargaining power of suppliers
- 3.5.2 Bargaining power of buyers
- 3.5.3 Threat of new entrants
- 3.5.4 Threat of substitutes
- 3.6 PESTEL analysis
- 3.6.1 Political factors
- 3.6.2 Economic factors
- 3.6.3 Social factors
- 3.6.4 Technological factors
- 3.6.5 Legal factors
- 3.6.6 Environmental factors
- 3.7 Cost structure analysis of renewable diesel
- 3.8 Price trend analysis (Driven by Primary Research)
- 3.8.1 By feedstock USD/Ton (Driven by Primary Research)
- 3.8.2 Pricing strategy by player type (Premium / Value / Cost-plus) (Driven by Primary Research)
- 3.9 Trade data analysis (Driven by Primary Research)
- 3.9.1 Import/export value trends (Driven by Primary Research)
- 3.9.2 Key trade corridors & tariff impact (Driven by Primary Research)
- 3.10 Production capacity & utilization (Driven by Primary Research)
- 3.10.1 Production capacity by country (Driven by Primary Research)
- 3.10.2 Utilization rates and expansion pipeline (Driven by Primary Research)
- 3.11 Impact of AI & generative AI on the market
- 3.11.1 Predictive maintenance & fault detection
- 3.11.2 Grid optimization & load forecasting
- 3.11.3 Digital twin simulation & testing
- 3.11.4 Risks, limitations & regulatory considerations
- 3.12 Emerging opportunities & trends
- 3.12.1 Digitalization & IoT integration
- 3.12.2 Emerging market penetration
- 3.13 Overall investment scenario and future outlook
Chapter 4 Competitive landscape, 2026
- 4.1 Introduction
- 4.2 Company market share analysis, by region, 2025
- 4.2.1 North America
- 4.2.2 Europe
- 4.2.3 Asia Pacific
- 4.2.4 Middle East & Africa
- 4.2.5 Latin America
- 4.3 Competitive analysis of major market players
- 4.4 Competitive positioning matrix
- 4.5 Key developments
- 4.5.1 Mergers & acquisitions
- 4.5.2 Partnerships & collaborations
- 4.5.3 New product launches
- 4.5.4 Expansion plans & funding
- 4.6 Company tier benchmarking
- 4.6.1 Tier classification criteria & qualifying thresholds
- 4.6.2 Tier positioning matrix by revenue, geography & innovation
Chapter 5 Market Size and Forecast, By Feedstock, 2022 - 2035 (USD Billion & MT)
- 5.1 Key trends
- 5.2 Animal fat
- 5.3 Vegetable oil
- 5.4 Used cooking oil
- 5.5 Others
Chapter 6 Market Size and Forecast, By Application, 2022 - 2035 (USD Billion & MT)
- 6.1 Key trends
- 6.2 Transportation
- 6.3 Power generation
- 6.4 Aviation
- 6.5 Others
Chapter 7 Market Size and Forecast, By Capacity, 2022 - 2035 (USD Billion & MT)
- 7.1 Key trends
- 7.2 Small scale (<150k tons)
- 7.3 Medium scale (150k-900k tons)
- 7.4 Large scale (>900k tons)
Chapter 8 Market Size and Forecast, By Region, 2022 - 2035 (USD Billion & MT)
- 8.1 Key trends
- 8.2 North America
- 8.2.1 U.S.
- 8.2.2 Canada
- 8.3 Europe
- 8.3.1 Germany
- 8.3.2 France
- 8.3.3 Spain
- 8.3.4 UK
- 8.3.5 Italy
- 8.4 Asia Pacific
- 8.4.1 China
- 8.4.2 India
- 8.4.3 Indonesia
- 8.4.4 Australia
- 8.4.5 Japan
- 8.4.6 Singapore
- 8.5 Middle East & Africa
- 8.5.1 Saudi Arabia
- 8.5.2 South Africa
- 8.6 Latin America
- 8.6.1 Brazil
- 8.6.2 Argentina
Chapter 9 Company Profiles
- 9.1 BP
- 9.2 Cargill
- 9.3 Carolina Renewable Products
- 9.4 Chevron
- 9.5 Diamond Green Diesel
- 9.6 Eni
- 9.7 Gevo
- 9.8 HollyFrontier
- 9.9 Imperial Oil
- 9.10 LanzaJet
- 9.11 Marathon Petroleum
- 9.12 Neste
- 9.13 Petrobras
- 9.14 Phillips 66
- 9.15 Preem AB
- 9.16 Repsol
- 9.17 Shell
- 9.18 TotalEnergies
- 9.19 Valero
- 9.20 World Energy

 酯交換催化劑市場:全球市場預測,2026-2032年
 歐洲生質柴油:市場佔有率分析、產業趨勢與統計及成長預測(2026-2031)生質柴油:市場佔有率分析、產業趨勢與統計、成長預測(2026-2031)可再生柴油市場:全球市場預測,2026-2032年生質柴油市場:依原料、純度等級、形態、應用及通路分類-2026-2032年全球市場預測
 生物柴油市場規模、佔有率和成長分析:按生質燃料類型、混合比例、生產技術、原料類型、應用、最終用戶、分銷管道和地區分類-2026-2033年產業預測
 生質柴油催化劑市場:依催化劑種類、催化劑原料、原料、催化劑應用、催化劑形式及地區分類。
 生質柴油市場規模、佔有率、趨勢和預測:按原料、應用、類型、製造技術和地區分類,2026-2034年
 生物柴油市場機會、成長要素、產業趨勢分析及2026-2035年預測
 可再生柴油市場規模、佔有率和趨勢分析報告:按來源、應用、地區和細分市場預測(2026-2033 年)