


 |
市場調查報告書
商品編碼
2113959
網路欺騙:市場佔有率分析、產業趨勢與統計、成長預測(2026-2031)Cyber Deception - Market Share Analysis, Industry Trends & Statistics, Growth Forecasts (2026 - 2031) |
||||||

※ 本網頁內容可能與最新版本有所差異。詳細情況請與我們聯繫。
據 Mordor Intelligence 稱,2025 年網路欺騙市場價值 19.8 億美元,預計到 2031 年將從 2026 年的 22.4 億美元成長至 41.2 億美元,預測期(2026-2031 年)的複合年成長率為 13.01%。
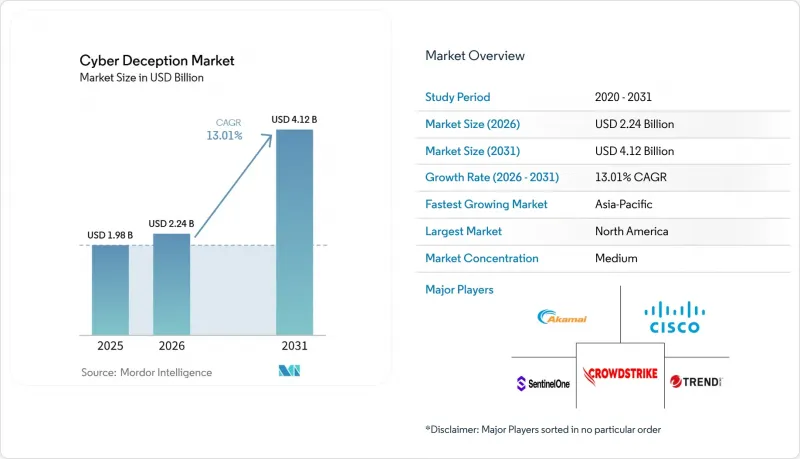
本報告按安全層級(應用安全、網路安全、資料安全等)、服務類型(專業服務、主機服務)、部署模式(本地部署、雲端部署)、最終用戶產業(銀行、金融服務和保險、IT與電信、醫療保健與生命科學、零售與電子商務等)以及地區進行細分。市場預測以美元計價。
全球網路欺騙市場趨勢與洞察
網路攻擊日益複雜化和規模化
高級持續性威脅 (APT) 目前利用「借力打力」的策略、供應鏈入侵以及繞過特徵碼引擎的 AI 生成的釣魚誘餌。欺騙手段透過誘使攻擊者落入高度精確的誘餌陷阱來填補偵測空白,這些誘餌會記錄所有命令和有效載荷。英國國家網路安全中心 (NCSC) 於 2024 年啟動的 5000 節點欺騙計劃,正是國家機構如何收集攻擊者策略並改進防禦策略的典範。企業也在採用類似的方法。例如,美國一家醫療保健網路在其電子病歷叢集部署了蜜罐令牌,將勒索軟體的延遲時間從幾天縮短到初始誘餌觸發後不到兩小時。
快速雲端遷移和 API 優先架構
無伺服器函數、微服務和多重雲端資料路徑正在擴大攻擊面,使其超出邊界防火牆的防禦範圍。容器化的欺騙設備現在可以透過 Terraform 腳本部署,並可隨 Kubernetes叢集自動擴展,使安全團隊能夠在幾分鐘內隱藏新的工作負載。發表在《科學報告》上的一項研究表明,單一租戶誘餌系統可以捕獲 67% 的 WAF 規則無法檢測到的憑證填充攻擊,同時將 API 呼叫延遲保持在 1% 以下。採用基礎設施即程式碼 (IaC) 的組織對這些結果寄予厚望,因為誘餌的運行速度與 DevOps 流水線的速度保持一致。
現有網路中較高的整合和協調成本
對於採用扁平化傳統網路的組織而言,缺乏適合部署欺騙性攻擊的有效分段點。在能源和製造業等行業,改造虛擬區域網路、鏡像連接埠和身分服務會增加專案成本,並使工期延長 12 個月甚至更久。一家歐洲石化公司報告稱,在第一個陷阱上線之前,必要的網路升級就使其最初的欺騙性攻擊預算加倍,這表明僅靠工具無法解決老舊架構的問題。
細分市場分析
到2025年,網路欺騙產品將佔網路欺騙市場34.88%的佔有率,這反映了它們作為邊界陷阱的傳統角色。然而,隨著每一台遠端連線的筆記型電腦和工業物聯網閘道都成為關鍵節點,終端欺騙正以17.63%的複合年成長率快速成長。這種成長正在重塑網路欺騙市場,因為以設備為中心的誘餌填補了網路監聽器無法監控加密隧道之外活動的可見性空白。
在實務中,供應商提供的輕量級代理程式會在攻擊者入侵終端機後建立虛假登錄單元、產生虛假瀏覽器 cookie 或啟動誘餌 USB 隨身碟。例如,一家東南亞電信業者在一名工程師的筆記型電腦上植入了一個虛假的 5G 管理腳本。攻擊者在數小時內對該誘餌做出回應,使得安全團隊能夠在核心交換機被攻破之前隔離受損帳戶。應用安全領域的欺騙手段也日益普及。模擬 GraphQL 端點的 API誘餌系統的興起,使得 SaaS 供應商能夠即時偵測憑證濫用。同時,以資料為中心的欺騙手段涉及將蜜罐令牌嵌入結構化查詢語言 (SQL) 表或物件儲存桶中。一家零售商利用這種策略在幾分鐘內就發現了一個惡意倉庫 API,該 API 竊取了客戶的個人識別資訊 (PII)。總而言之,這些多層方法正推動網路欺騙市場朝著統一主機的方向發展,該控制台能夠跨資料包、進程和資料工件協調誘餌。
預計到2025年,託管式欺騙服務將佔據網路欺騙市場佔有率的38.74%,複合年成長率(CAGR)為17.72%。這表明許多公司更傾向於將欺騙操作外包,而不是僱用稀缺的欺騙工程師。服務提供者經營一個集中式的“誘餌營運中心”,該中心管理著數千個陷阱,在租戶之間共用新的指標,並在事件發生後提供取證調查。這種模式符合董事會提出的在不顯著增加人員配置的情況下縮短「平均檢測時間(MTD)」的要求。
專業服務對於成功的欺騙至關重要,因為它需要網路基準設定、關鍵資產映射以及融入組織文化。諮詢顧問現在將現場演練、網路釣魚模擬和紫隊實驗室納入部署階段,確保內部響應負責人能夠根據誘餌遙測數據採取適當的行動。例如,一家財富 100 強製造商聘請了一家專業整合商,將欺騙警報直接整合到其 SAP GRC主機中,並在短短一個季度內就向負責人展示了其價值。這種綜合方法清楚地表明了網路欺騙產業為何能夠透過持續的管理費和高利潤的諮詢服務獲得收入。
區域分析
到2025年,北美將佔據網路欺騙市場43.10%的佔有率。這主要得益於成熟的預算、矽谷和特拉維夫的研發叢集,以及諸如總統關於向零信任過渡的行政命令等監管支持。美國技術整合商持續收購利基供應商。 SentinelOne以6.165億美元收購Attivo Networks,將欺騙和自主端點保護功能整合到一個代理程式中。加拿大電信業者也正在其5G核心網路中部署欺騙技術,以符合加拿大廣播電視和電信委員會(CRTC)的供應鏈指令。
亞太地區正經歷最快的成長,複合年成長率高達22.05%。新加坡、澳洲和日本等國家正在製定針對特定產業的網路安全框架,明確要求實施威脅狩獵應對措施,這為欺騙技術的試點部署提供了預算。例如,澳洲的能源網路部署了容器化的工業控制系統(ICS)誘餌,以符合《關鍵基礎設施安全法》的修訂要求,並在幾週內檢測到了收集憑證的機器人。中國的雲端超大規模資料中心業者正在捆綁欺騙技術API,使國內SaaS開發人員能夠將「誘餌系統即代碼」添加到其持續整合/持續交付(CI/CD)管道中。同時,印度的金融科技新創公司正在使用虛假的統一支付介面(UPI)端點來引誘卡片詐騙團夥,並將他們的資訊提供給當地的電腦緊急應變小組(CERT)。
在歐洲,網路安全技術持續穩定成長,成長率約15%。歐盟的《網路彈性法案》提倡持續監控,德國聯邦資訊安全局(BSI)也將欺騙技術列為建議措施。由於嚴格的資料居住要求,多家供應商目前在法蘭克福、巴黎和馬德里提供主權雲端節點。在中東和非洲,隨著利雅德和杜拜智慧城市的建設,政府正撥款在區域供冷廠部署OT誘餌系統。南美洲的成長雖然緩慢,但呈現上升趨勢。巴西即時支付系統「PIX」的普及促使銀行安裝模擬交易閘道的誘餌API,以阻止針對小規模商家的憑證噴灑攻擊。
其他好處:
- Excel格式的市場預測(ME)表
- 3個月的分析師支持
目錄
第1章:引言
- 研究假設和市場定義
- 調查範圍
第2章:調查方法
第3章執行摘要
第4章 市場狀況
- 市場概覽
- 市場促進因素
- 網路攻擊日益複雜化和規模化
- 快速雲端遷移和 API 優先架構
- 強制採用零信任原則和「侵權是必然的」立場。
- 網路安全專業人才短缺,推動了對自動化技術的需求。
- 與身分威脅偵測與回應 (ITDR) 整合
- 欺騙工具正在遷移到 XDR/SSE 平台。
- 市場限制因素
- 現有網路中較高的整合和協調成本
- 中小企業網路安全預算不足
- 開放原始碼誘餌框架的激增導致其感知價值下降。
- 對抗性人工智慧可以辨識誘餌目標的特徵。
- 產業價值鏈分析
- 監理情勢
- 技術展望
- 波特五力分析
第5章 市場規模與成長預測
- 一層一層
- 應用程式安全
- 網路安全
- 資料安全
- 端點安全
- 按服務類型
- 專業服務
- 託管服務
- 部署模式
- 現場
- 基於雲端的
- 按最終用戶行業分類
- BFSI
- 資訊科技/通訊
- 醫療保健和生命科學
- 零售與電子商務
- 能源公用事業
- 政府/國防
- 其他行業
- 按地區
- 北美洲
- 美國
- 加拿大
- 墨西哥
- 南美洲
- 巴西
- 阿根廷
- 其他南美國家
- 歐洲
- 德國
- 英國
- 法國
- 俄羅斯
- 其他歐洲國家
- 亞太地區
- 中國
- 日本
- 印度
- 韓國
- 澳洲
- 其他亞太國家
- 中東和非洲
- 中東
- 沙烏地阿拉伯
- 阿拉伯聯合大公國
- 其他中東國家
- 非洲
- 南非
- 埃及
- 其他非洲國家
- 中東
- 北美洲
第6章 競爭情勢
- 市場集中度
- 策略趨勢
- 市佔率分析
- 公司簡介
- SentinelOne Inc.
- Illusive Networks Ltd.
- Acalvio Technologies Inc.
- Akamai Technologies Inc.
- Rapid7 Inc.
- CrowdStrike Holdings Inc.
- TrapX Security Inc.
- Fidelis Cybersecurity LLC
- Trend Micro Incorporated
- Cisco Systems Inc.
- Fortinet Inc.
- Countercraft, SL,
- Morphisec Ltd.
- Zscaler Inc.
- LogRhythm Inc.
- Smokescreen Technologies Pvt Ltd.
- Cymmetria Ltd.
- Illumio Inc.
- ExtraHop Networks Inc.
- Darktrace plc
- Thales Group(Data Threat Deception)
- Palo Alto Networks Inc.
- Guardicore Ltd.(Akamai)
- Kaspersky Lab AO
- Allure Security Technology Inc.
- Minerva Labs Ltd.
第7章 市場機會與未來趨勢
- 評估閒置頻段和未滿足的需求
According to Mordor Intelligence, the cyber deception market size was valued at USD 1.98 billion in 2025 and estimated to grow from USD 2.24 billion in 2026 to reach USD 4.12 billion by 2031, at a CAGR of 13.01% during the forecast period (2026-2031).
This report is Segmented by Layer (Application Security, Network Security, Data Security, and More), Service Type (Professional Services, and Managed Services), Deployment Mode (On-Premises, and Cloud-Based), End-User Industry (BFSI, IT and Telecommunications, Healthcare and Life Sciences, Retail and E-Commerce, and More), and Geography. The Market Forecasts are Provided in Terms of Value (USD).
Global Cyber Deception Market Trends and Insights
Escalating Sophistication and Volume of Cyber-Attacks
Advanced persistent threats now leverage living-off-the-land tactics, supply-chain infiltration, and AI-generated phishing lures that bypass signature engines. Deception fills detection gaps by luring adversaries into high-fidelity decoys that log every command and payload. The U.K. National Cyber Security Centre's 5,000-node deception program, launched in 2024, illustrates how national agencies harvest attacker tradecraft to refine defense playbooks. Enterprises mirror that approach: a U.S. healthcare network, for example, seeded honey tokens across its electronic records cluster and cut ransomware dwell time from days to under two hours after the first decoy trigger.
Rapid Cloud Migration and API-First Architectures
Serverless functions, microservices, and multicloud data paths multiply attack surfaces beyond the reach of perimeter firewalls. Containerized deception appliances now deploy via Terraform scripts and autoscale with Kubernetes clusters, letting security teams cloak every new workload in minutes. Research published in Scientific Reports demonstrated that a single-tenant cloud honeypot caught 67% of credential-stuffing attempts missed by WAF rules while adding under 1% latency to API calls. Organizations adopting Infrastructure-as-Code rally around such evidence because decoys move at the same velocity as DevOps pipelines.
High Integration and Tuning Costs for Brown-Field Networks
Organizations running flat, legacy networks lack segmentation points for realistic decoy placement. Retrofitting virtual LANs, span ports, and identity services drives up project costs and extends timelines beyond 12 months in industries such as energy or manufacturing. One European petro-chemical firm reported that prerequisite network upgrades doubled its initial deception budget before the first trap was online, proving that tooling alone cannot solve architectural rot.
Other drivers and restraints analyzed in the detailed report include:
- Mandates for Zero-Trust and Breach-Assumed Postures
- Shortage of Skilled Cyber Workforce Boosting Automation Demand
- Limited Cybersecurity Budgets Among SMBs
For complete list of drivers and restraints, kindly check the Table Of Contents.
Segment Analysis
Network deception products accounted for a 34.88% share of the cyber deception market in 2025, reflecting their historical role as perimeter tripwires. Endpoint deception, however, is scaling at a 17.63% CAGR as every remote laptop and IIoT gateway becomes a pivot point. That growth reshapes the cyber deception market because device-centric lures close visibility gaps that network taps cannot monitor behind encrypted tunnels.
In practice, vendors push lightweight agents that spin up bogus registry hives, fake browser cookies, and decoy USB drives whenever a threat actor lands on an endpoint. For instance, a Southeast-Asian telecom placed false 5G management scripts on engineering laptops; attackers triggered the lure within hours, enabling security teams to isolate compromised accounts before any core switch was touched. Application security deception also gathers momentum-the rise of API honeypots that mimic GraphQL endpoints lets SaaS providers detect credential abuse in real time. Data-centric deception, meanwhile, embeds honey-tokens inside structured query language tables and object storage buckets; one retailer used that tactic to discover rogue warehouse APIs siphoning customer PII within minutes. Altogether, the layered approach moves the cyber deception market toward unified consoles that orchestrate decoys across packets, processes, and data artifacts.
Managed deception services held 38.74% of the cyber deception market share in 2025 and carry an 17.72% CAGR, evidence that many enterprises would rather outsource trickery than recruit scarce deception engineers. Providers run centralized "Decoy Operations Centers" that manage thousands of traps, share new indicators across tenants, and supply post-incident forensics. That model aligns with board mandates to reduce mean-time-to-detect without ballooning headcount.
Professional services still matter because successful deception demands network baselining, crown-jewel mapping, and cultural buy-in. Consultants now embed field exercises, phishing simulations, and purple-team labs into deployment phases so that internal responders learn how to act on decoy telemetry. For example, a Fortune 100 manufacturer hired a boutique integrator to knit deception alerts directly into its SAP GRC console, proving value to auditors within a single quarter. This blended approach underlines why the cyber deception industry monetizes both recurring managed fees and high-margin consulting.
Complete Report Scope:
- By Layer
- Application Security
- Network Security
- Data Security
- Endpoint Security
- By Service Type
- Professional Services
- Managed Services
- By Deployment Mode
- On-premises
- Cloud-based
- By End-user Industry
- BFSI
- IT and Telecommunications
- Healthcare and Life Sciences
- Retail and e-Commerce
- Energy and Utilities
- Government and Defense
- Other Industries
- By Geography
- North America
- United States
- Canada
- Mexico
- South America
- Brazil
- Argentina
- Rest of South America
- Europe
- Germany
- United Kingdom
- France
- Russia
- Rest of Europe
- Asia-Pacific
- China
- Japan
- India
- South Korea
- Australia
- Rest of Asia-Pacific
- Middle East and Africa
- Middle East
- Saudi Arabia
- United Arab Emirates
- Rest of Middle East
- Africa
- South Africa
- Egypt
- Rest of Africa
- Middle East
- North America
Geography Analysis
North America controlled 43.10% of the cyber deception market in 2025, anchored by mature budgets, R&D clusters in Silicon Valley and Tel Aviv, and regulatory catalysts such as executive orders on zero-trust migration. U.S. technology consolidators continue to absorb niche vendors; SentinelOne's USD 616.5 million purchase of Attivo Networks merged deception with autonomous endpoint protection in a single agent. Canadian telcos likewise deploy deception inside 5G cores to meet CRTC supply-chain directives.
Asia-Pacific is the fastest riser at 22.05% CAGR. Nations such as Singapore, Australia, and Japan issue sectoral cyber frameworks that explicitly call for threat-hunting controls, spawning budgets for deception pilots. For example, an Australian energy grid deployed containerized ICS decoys to comply with the Security of Critical Infrastructure Act amendments, catching credential-harvesting bots within weeks. Chinese cloud hyperscalers bundle deception APIs so that domestic SaaS developers can add "honeypot as code" to CI/CD pipelines. Meanwhile, Indian fintech start-ups lure carding gangs with fake Unified Payments Interface endpoints, feeding intelligence to local CERT teams.
Europe maintains steady mid-teens growth. The EU Cyber Resilience Act pushes continuous monitoring, and Germany's BSI agency cites deception as a recommended control. Strict data-residency rules mean several vendors now offer sovereign-cloud nodes in Frankfurt, Paris, and Madrid. In the Middle East and Africa, smart-city build-outs in Riyadh and Dubai allocate funding for OT decoys inside district cooling plants. South American growth is modest yet rising; Brazil's PIX instant-payment rails drive banks to plant decoy APIs that emulate transaction gateways, intercepting credential sprays directed at small merchants.
- SentinelOne Inc.
- Illusive Networks Ltd.
- Acalvio Technologies Inc.
- Akamai Technologies Inc.
- Rapid7 Inc.
- CrowdStrike Holdings Inc.
- TrapX Security Inc.
- Fidelis Cybersecurity LLC
- Trend Micro Incorporated
- Cisco Systems Inc.
- Fortinet Inc.
- Countercraft, S.L.,
- Morphisec Ltd.
- Zscaler Inc.
- LogRhythm Inc.
- Smokescreen Technologies Pvt Ltd.
- Cymmetria Ltd.
- Illumio Inc.
- ExtraHop Networks Inc.
- Darktrace plc
- Thales Group (Data Threat Deception)
- Palo Alto Networks Inc.
- Guardicore Ltd. (Akamai)
- Kaspersky Lab AO
- Allure Security Technology Inc.
- Minerva Labs Ltd.
Additional Benefits:
- The market estimate (ME) sheet in Excel format
- 3 months of analyst support
TABLE OF CONTENTS
1 INTRODUCTION
- 1.1 Study Assumptions and Market Definition
- 1.2 Scope of the Study
2 RESEARCH METHODOLOGY
3 EXECUTIVE SUMMARY
4 MARKET LANDSCAPE
- 4.1 Market Overview
- 4.2 Market Drivers
- 4.2.1 Escalating sophistication and volume of cyber-attacks
- 4.2.2 Rapid cloud migration and API-first architectures
- 4.2.3 Mandates for zero-trust and breach-assumed postures
- 4.2.4 Shortage of skilled cyber workforce boosting automation demand
- 4.2.5 Convergence with Identity Threat Detection and Response (ITDR)
- 4.2.6 Shift of deception tooling into XDR/SSE platforms
- 4.3 Market Restraints
- 4.3.1 High integration and tuning costs for brown-field networks
- 4.3.2 Limited cybersecurity budgets among SMBs
- 4.3.3 Proliferation of open-source decoy frameworks lowering perceived value
- 4.3.4 Adversarial-AI capable of fingerprinting decoy
- 4.4 Industry Value Chain Analysis
- 4.5 Regulatory Landscape
- 4.6 Technological Outlook
- 4.7 Porter's Five Forces Analysis
- 4.7.1 Bargaining Power of Suppliers
- 4.7.2 Bargaining Power of Consumers
- 4.7.3 Threat of New Entrants
- 4.7.4 Threat of Substitutes
- 4.7.5 Intensity of Competitive Rivalry
5 MARKET SIZE AND GROWTH FORECASTS (VALUE)
- 5.1 By Layer
- 5.1.1 Application Security
- 5.1.2 Network Security
- 5.1.3 Data Security
- 5.1.4 Endpoint Security
- 5.2 By Service Type
- 5.2.1 Professional Services
- 5.2.2 Managed Services
- 5.3 By Deployment Mode
- 5.3.1 On-premises
- 5.3.2 Cloud-based
- 5.4 By End-user Industry
- 5.4.1 BFSI
- 5.4.2 IT and Telecommunications
- 5.4.3 Healthcare and Life Sciences
- 5.4.4 Retail and e-Commerce
- 5.4.5 Energy and Utilities
- 5.4.6 Government and Defense
- 5.4.7 Other Industries
- 5.5 By Geography
- 5.5.1 North America
- 5.5.1.1 United States
- 5.5.1.2 Canada
- 5.5.1.3 Mexico
- 5.5.2 South America
- 5.5.2.1 Brazil
- 5.5.2.2 Argentina
- 5.5.2.3 Rest of South America
- 5.5.3 Europe
- 5.5.3.1 Germany
- 5.5.3.2 United Kingdom
- 5.5.3.3 France
- 5.5.3.4 Russia
- 5.5.3.5 Rest of Europe
- 5.5.4 Asia-Pacific
- 5.5.4.1 China
- 5.5.4.2 Japan
- 5.5.4.3 India
- 5.5.4.4 South Korea
- 5.5.4.5 Australia
- 5.5.4.6 Rest of Asia-Pacific
- 5.5.5 Middle East and Africa
- 5.5.5.1 Middle East
- 5.5.5.1.1 Saudi Arabia
- 5.5.5.1.2 United Arab Emirates
- 5.5.5.1.3 Rest of Middle East
- 5.5.5.2 Africa
- 5.5.5.2.1 South Africa
- 5.5.5.2.2 Egypt
- 5.5.5.2.3 Rest of Africa
- 5.5.5.1 Middle East
- 5.5.1 North America
6 COMPETITIVE LANDSCAPE
- 6.1 Market Concentration
- 6.2 Strategic Moves
- 6.3 Market Share Analysis
- 6.4 Company Profiles (includes Global level Overview, Market level overview, Core Segments, Financials as available, Strategic Information, Market Rank/Share for key companies, Products and Services, and Recent Developments)
- 6.4.1 SentinelOne Inc.
- 6.4.2 Illusive Networks Ltd.
- 6.4.3 Acalvio Technologies Inc.
- 6.4.4 Akamai Technologies Inc.
- 6.4.5 Rapid7 Inc.
- 6.4.6 CrowdStrike Holdings Inc.
- 6.4.7 TrapX Security Inc.
- 6.4.8 Fidelis Cybersecurity LLC
- 6.4.9 Trend Micro Incorporated
- 6.4.10 Cisco Systems Inc.
- 6.4.11 Fortinet Inc.
- 6.4.12 Countercraft, S.L.,
- 6.4.13 Morphisec Ltd.
- 6.4.14 Zscaler Inc.
- 6.4.15 LogRhythm Inc.
- 6.4.16 Smokescreen Technologies Pvt Ltd.
- 6.4.17 Cymmetria Ltd.
- 6.4.18 Illumio Inc.
- 6.4.19 ExtraHop Networks Inc.
- 6.4.20 Darktrace plc
- 6.4.21 Thales Group (Data Threat Deception)
- 6.4.22 Palo Alto Networks Inc.
- 6.4.23 Guardicore Ltd. (Akamai)
- 6.4.24 Kaspersky Lab AO
- 6.4.25 Allure Security Technology Inc.
- 6.4.26 Minerva Labs Ltd.
7 MARKET OPPORTUNITIES AND FUTURE TRENDS
- 7.1 White-space and Unmet-Need Assessment

 全球網路安全代理人工智慧市場規模、佔有率、趨勢和成長分析報告(2026-2034)
 印度網路安全:市場佔有率分析、產業趨勢與統計及成長預測(2026-2031)菲律賓網路安全:市場佔有率分析、產業趨勢與統計及成長預測(2026-2031 年)義大利網路安全:市場佔有率分析、產業趨勢與統計、成長預測(2026-2031)
 2026-2030年全球安全態勢管理(SPM)市場
 2026-2030年全球網路安全市場全球IT與通訊網路安全市場規模、佔有率、趨勢及成長分析報告(2026-2034年)
 銀行、金融服務和保險 (BFSI) 網路安全市場規模、佔有率和趨勢分析報告:按組件、部署模式、安全類型、行業、最終用戶、地區和細分市場預測 (2026–2033)
 2026年全球網路安全管理市場報告全球油氣網路安全市場規模、佔有率、趨勢和成長分析報告(2026-2034)