


 |
市場調查報告書
商品編碼
2113756
CNG 和 LPG 汽車:市場佔有率分析、行業趨勢和統計數據以及成長預測(2026-2031 年)CNG And LPG Vehicle - Market Share Analysis, Industry Trends & Statistics, Growth Forecasts (2026 - 2031) |
||||||

※ 本網頁內容可能與最新版本有所差異。詳細情況請與我們聯繫。
預計到 2026 年,全球 CNG 和 LPG 汽車市場規模將達到 77.1 億美元,高於 2025 年的 72.2 億美元,預計到 2031 年將達到 107 億美元。
預計從 2026 年到 2031 年,其複合年成長率將達到 6.78%。
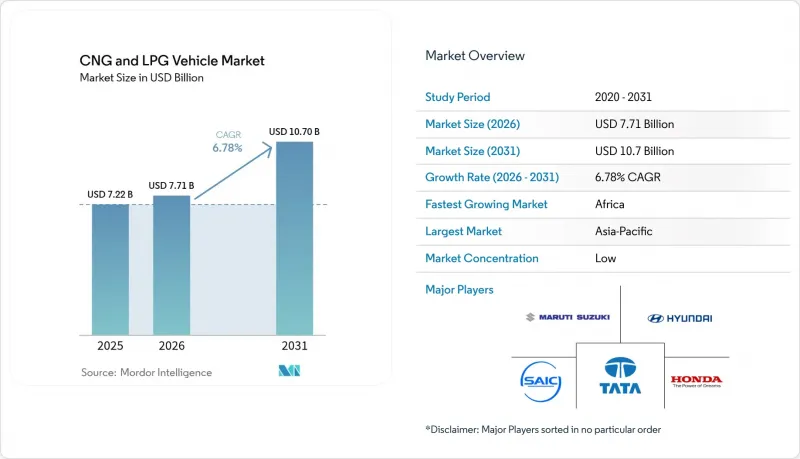
本報告按燃料類型(例如,壓縮天然氣 (CNG))、車輛類型(例如,乘用車)、銷售管道(OEM 設備和售後市場)、最終用途(例如,個人用途)、氣瓶類型(例如,I 型)和地區(例如,北美)進行分類。市場預測以貨幣價值(美元)和數量(單位)兩種形式呈現。
全球 CNG 與 LPG 汽車市場趨勢與洞察
政府獎勵和燃油價格平價計劃
多層次的獎勵計劃正在改變車隊的經濟格局。奈及利亞耗資4.5億美元的總統天然氣舉措將加氣站建設與改裝代金券結合,完成了超過1萬輛汽車的改裝,並培訓了4000名技術人員。加州的「清潔駕駛!」計劃為每輛小型車提供高達3000美元的補貼,加上提案的可再生天然氣(RNG)稅額扣抵,進一步縮短了投資回收期。阿拉伯聯合大公國的「車輛天然氣計畫」建造了每日服務能力達1萬輛汽車的加氣站,確保了早期採用者的天然氣供應。這些措施共同推動天然氣和液化石油氣(LPG)汽車市場的發展,使其不再只是權宜之計,而是邁向淨零排放的戰略橋樑。
CNG/LPG加氣基礎設施的快速擴張
加氣站數量的成長正從公共津貼轉向私人資本,這反映了現金流的永續性。清潔能源燃料公司(Clean Energy Fuels)正在休士頓興建首個私人公車車庫CNG加氣站,年產供給能力達200萬加侖。道達爾能源公司(Total Energy)在三大洲營運1200多個公共加氣站,這些加氣站策略性地分佈在貨運路線沿線,以確保充分利用。印度計劃在2030年建成1萬個加氣站,以支持馬爾蒂鈴木公司(Malti Suzuki)在2025會計年度銷售60萬輛原廠配備CNG的汽車的計劃。網路密度的提高將緩解續航里程的擔憂,拓展城際貨運機會,並推動CNG和LPG汽車市場的持續需求。
缺乏針對燃油車輛的撞擊測試規程
2024年2月發生在威爾明頓的卡車爆炸事故凸顯了全球標準的不足。儘管聯邦標準304規定了儲罐的完整性,但整車的全面測試仍然缺乏,這增加了車主和保險公司的責任風險。 ISO 11439制定了氣瓶標準,但由於缺乏碰撞模擬,風險規避型地區的汽車製造商(OEM)採用該標準的速度有所放緩。在相關機構制定動態測試標準之前,這些安全方面的不確定性可能會在一定程度上限制壓縮天然氣(CNG)和液化石油氣(LPG)汽車市場的成長潛力。
細分市場分析
預計到2031年,壓縮生物氣(CBG)的複合年成長率將達到12.42%,而壓縮天然氣(CNG)預計在2025年將維持在CNG和LPG汽車市場80.95%的佔有率。農業廢棄物消化器的引進將推動印度對生物CNG的需求在2030年前成長40倍,凸顯了對可再生能源的轉型。早期進入市場的車輛,例如每公斤燃料可行駛25.51公里的Martii Brezza CBG,證明了其商業性可行性。另一方面,LPG在基礎設施完善的地區仍然保持強勁勢頭,並受益於卡達和阿拉伯聯合大公國液化天然氣(LNG)項目不斷成長的LNG供應。因此,區域燃料選擇更反映了當地原料的可用性和政策激勵,而非純粹的技術優勢。
生物壓縮天然氣(bio-CNG)乘用車市場預計將以每年14.6%的速度成長,這主要得益於酪農、釀酒廠和市政垃圾處理業者簽訂的原料採購協議,這些協議可以鎖定原料成本。同時,由於營運商對沖碳排放稅風險,化石燃料汽車的成長率僅為個位數。這些相互矛盾的趨勢表明,儘管壓縮天然氣(CNG)和液化石油氣(LPG)汽車市場整體持續擴張,但其組成正在向混合可再生氣體的燃料轉變。
預計到2025年,乘用車將佔總支出的62.10%,其中摩托車和三輪車的複合年成長率預計將達到10.55%,成長率最高。 Bajaj Auto公司在2020年至2023年間成功將其CNG三輪車的滲透率從26%提升至57%,這增強了人們對該公司計劃於2025年推出的首款CNG摩托車的技術信心。輕型商用車和公車也扮演著重要角色,它們的運作週期也使得投資興建現場加氣站成為必要,這將推動CNG和LPG汽車市場在預測期內整體規模在商用領域持續成長。
都市區柴油貨運監管的日益嚴格正在加速輕型卡車的普及,而公共交通運營商則傾向於選擇12年期的公車競標,以便提前鎖定可再生天然氣(RNG)供應合約。這些趨勢共同作用,正在鞏固CNG和LPG汽車市場的多元化需求結構,該結構以注重成本的摩托車和以銷售為導向的商用車隊為中心。
區域分析
亞太地區預計在2025年佔全球銷售量的45.60%。印度的CNG乘用車銷量在2025年初超過柴油乘用車銷量,這一里程碑事件顯示消費者對CNG的接受度很高。 6959個加氣站提升了便利性,雙缸佈局也解決了行李箱空間不足的問題。在中國,由於電池重量仍然不經濟,CNG正被廣泛應用於重型貨運路線,這進一步鞏固了中國在CNG和LPG汽車市場的核心地位。
非洲是成長最快的地區,預計到2031年將維持12.97%的複合年成長率。奈及利亞4.5億美元的基礎建設項目(目標是改造100萬輛汽車)保障了供應的穩定性,而南非的「天然氣發電」計畫則進一步刺激了需求。豐富的國內天然氣資源和對傳統汽車產業的有限投資降低了轉型門檻,加速了壓縮天然氣(CNG)和液化石油氣(LPG)汽車市場的滲透。南美洲預計複合年成長率為7.98%,主要得益於巴西的生質燃料文化和阿根廷的天然氣蘊藏量。巴西在乙醇彈性燃料方面擁有悠久的歷史,這有助於消費者了解相關知識,而可再生天然氣(RNG)試點計畫的供應正在交通運輸領域尋找買家,從而推動了CNG和LPG汽車市場的發展。現代汽車11億美元的綠色旅行計畫表明,汽車製造商正將非洲視為替代燃料的戰略樞紐。歐洲保持著 5.12% 的成長率,德國正在透過增加生物甲烷產量和加強對加油站網路的供應來擴大其應用範圍。
其他好處:
- Excel格式的市場預測(ME)表
- 3個月的分析師支持
目錄
第1章:引言
- 研究假設和市場定義
- 調查範圍
第2章:調查方法
第3章執行摘要
第4章 市場狀況
- 市場概覽
- 市場促進因素
- 政府激勵措施和努力使燃油價格趨於平衡
- CNG和LPG加氣基礎設施的快速擴張
- OEM產品線正轉向出廠即標配CNG規格的車型。
- 加強對城市地區廢氣中一氧化碳和氮氧化物的監管
- 創新的雙缸引擎套件,可擴展後行李箱空間。
- 商用車隊優先選擇生物壓縮天然氣和可再生石油氣
- 市場限制因素
- 汽油動力車輛碰撞測試規程的局限性
- 城市燃氣公司液化天然氣原料價格波動
- 電動車資本投資的補貼正在降低大都會圈對壓縮天然氣的需求。
- 人們對車輛使用甲烷氣體的安全性存在認知差距,並擔心其對續航里程的影響。
- 價值供應鏈分析
- 監理情勢
- 技術展望
- 波特五力模型
- 基礎建設發展狀況分析
第5章 市場規模與成長預測
- 按燃料類型
- 壓縮天然氣(CNG)
- 液化石油氣(LPG)
- 壓縮生物氣(CBG)
- 車輛類型
- 搭乘用車
- 輕型商用車
- 巴士和長途汽車
- 卡車(中型和大型)
- 二輪車和三輪車
- 按銷售管道
- OEM 原廠設備
- 售後/改裝
- 按最終用途
- 私人/個人用途
- 計程車和叫車
- 大眾運輸
- 工業及公共產業車輛
- 依氣缸類型
- I 型(全金屬)
- 第二類(金屬箍包覆)
- III型(全複合型)
- IV型(聚合物襯裡複合材料)
- 按地區
- 北美洲
- 美國
- 加拿大
- 其他北美國家
- 南美洲
- 巴西
- 阿根廷
- 哥倫比亞
- 其他南美國家
- 歐洲
- 德國
- 英國
- 法國
- 義大利
- 西班牙
- 俄羅斯
- 其他歐洲國家
- 亞太地區
- 中國
- 印度
- 日本
- 韓國
- 印尼
- 泰國
- 其他亞太國家
- 中東和非洲
- 土耳其
- 沙烏地阿拉伯
- 阿拉伯聯合大公國
- 卡達
- 南非
- 奈及利亞
- 埃及
- 肯亞
- 其他中東和非洲國家
- 北美洲
第6章 競爭情勢
- 市場集中度
- 策略趨勢
- 市佔率分析
- 公司簡介
- Hyundai Motor Company
- Suzuki Motor Corporation(Maruti Suzuki)
- Tata Motors Limited
- SAIC Motor Corporation
- IVECO Group
- AB Volvo
- Volkswagen AG
- Ford Motor Company
- Honda Motor Co., Ltd.
- Nissan Motor Co., Ltd.
- General Motors Company
- Mahindra & Mahindra Ltd.
- Great Wall Motor Co.
- Kia Corporation
- Dongfeng Motor Corporation
- Bajaj Auto Limited
- Ashok Leyland
- TVS Motor Company
第7章 市場機會與未來展望
According to Mordor Intelligence, the global CNG and LPG vehicle market size in 2026 is estimated at USD 7.71 billion, growing from 2025 value of USD 7.22 billion with 2031 projections showing USD 10.7 billion, growing at 6.78% CAGR over 2026-2031.
This report is Segmented by Fuel Type (Compressed Natural Gas (CNG) and More), Vehicle Type (Passenger Cars and More), Sales Channel (OEM-Fitted and Retrofitted/After-market), by End-Use Application (Private/Personal Use and More), by Cylinder Type (Type I and More), and Geography (North America and More). The Market Forecasts are Provided in Terms of Value (USD) and Volume (Units).
Global CNG And LPG Vehicle Market Trends and Insights
Government Incentives and Fuel-Price Parity Initiatives
Multi-layered incentive programs are rewriting fleet economics. Nigeria's USD 450 million Presidential CNG Initiative couples station rollout with conversion vouchers, completing more than 10,000 vehicle upgrades and training 4,000 technicians. California's Drive Clean! rebates of up to USD 3,000 per light-duty vehicle plus an RNG tax credit proposal further sweeten payback periods. The UAE's Natural Gas for Vehicles program has installed dispensers able to serve 10,000 cars daily, guaranteeing supply for early adopters. Together, these actions reposition the CNG and LPG vehicle market as a strategic bridge to net-zero rather than a stop-gap.
Rapid Expansion of CNG/LPG Refueling Infrastructure
Station growth has shifted from public grants to commercial capital, signaling cash-flow viability. Clean Energy Fuels is constructing Houston's first private bus-depot CNG station sized for 2 million gallons per year. TotalEnergies operates more than 1,200 public pumps across three continents, strategically co-located on freight corridors to secure utilization. India targets 10,000 stations by 2030, underpinning Maruti Suzuki's plan to sell 600,000 factory-fitted CNG units in FY2025. A denser network alleviates range anxiety and unlocks intercity freight opportunities, driving sustained demand across the CNG and LPG vehicle market.
Limited Crash-Test Protocols for Gaseous-Fuel Vehicles
The February 2024 Wilmington truck explosion unveiled gaps in global standards. While Federal Standard 304 addresses tank integrity, holistic vehicle-level tests remain scarce, raising liability for fleets and insurers. ISO 11439 sets cylinder criteria but lacks crash simulations, slowing OEM roll-outs in risk-averse regions. Until authorities harmonize dynamic tests, these safety uncertainties will trim some upside from the CNG and LPG vehicle market.
Other drivers and restraints analyzed in the detailed report include:
- OEM Portfolio Shift Toward Factory-Fitted CNG Variants
- Stricter Tail-Pipe CO2 and NOx Norms in Urban Clusters
- Price-Volatility in LNG Feedstock for City-Gas Operators
For complete list of drivers and restraints, kindly check the Table Of Contents.
Segment Analysis
Compressed Bio-Gas is forecast to clock a 12.42% CAGR to 2031, while Compressed Natural Gas maintains an 80.95% 2025 CNG and LPG vehicle market share. India's planned 40-fold jump in bio-CNG demand by FY2030, enabled by agriculture-waste digesters, highlights the pivot to renewables. Early launches such as the Maruti Brezza CBG posting 25.51 km/kg underline commercial viability. Concurrently, LPG maintains pockets of strength where legacy infrastructure exists, supported by Qatar and the UAE's LNG projects that swell LPG supply. Regional fuel choices, therefore, mirror local feedstock abundance and policy pushes rather than pure technology merit.
The CNG and LPG vehicle market size for bio-CNG passenger cars is projected to expand at 14.6% yearly as dairy, distillery, and municipal-waste producers sign offtake deals that lock in input costs. Conversely, fossil-gas variants are growing in single digits as operators hedge against carbon taxes. The divergent trajectories show that while the overarching CNG and LPG vehicle market continues to widen, the internal mix is tilting toward renewable gas formulations.
Passenger cars controlled 62.10% of spending in 2025, yet two- and three-wheelers will deliver the sharpest 10.55% CAGR. Bajaj Auto's success in pushing CNG three-wheeler penetration from 26% to 57% between 2020 and 2023 builds technical confidence for its first CNG motorcycle in 2025. Light commercial vehicles and buses also feature prominently as duty cycles justify on-site station investments, amplifying the total CNG and LPG vehicle market size for commercial segments over the forecast window.
Increasing urban freight restrictions on diesel accelerate mini-truck adoption, while transit authorities opt for 12-year bus tenders that secure RNG supply contracts upfront. Together, these dynamics cement a diverse demand profile in the CNG and LPG vehicle market, anchored by cost-conscious two-wheelers and volume-driven commercial fleets.
Complete Report Scope:
- By Fuel Type
- Compressed Natural Gas (CNG)
- Liquefied Petroleum Gas (LPG)
- Compressed Bio-Gas (CBG)
- By Vehicle Type
- Passenger Cars
- Light Commercial Vehicles
- Buses and Coaches
- Trucks (Medium and Heavy-Duty)
- Two and Three-Wheelers
- By Sales Channel
- OEM-fitted
- Retrofitted / After-market
- By End-use Application
- Private / Personal Use
- Taxi and Ride-hailing Fleets
- Public Transit Authorities
- Industrial and Utility Fleets
- By Cylinder Type
- Type I (All-metal)
- Type II (Metal hoop-wrapped)
- Type III (Full composite)
- Type IV (Polymer-liner composite)
- By Geography
- North America
- United States
- Canada
- Rest of North America
- South America
- Brazil
- Argentina
- Colombia
- Rest of South America
- Europe
- Germany
- United Kingdom
- France
- Italy
- Spain
- Russia
- Rest of Europe
- Asia-Pacific
- China
- India
- Japan
- South Korea
- Indonesia
- Thailand
- Rest of Asia-Pacific
- Middle East and Africa
- Turkey
- Saudi Arabia
- United Arab Emirates
- Qatar
- South Africa
- Nigeria
- Egypt
- Kenya
- Rest of Middle East and Africa
- North America
Geography Analysis
Asia-Pacific commanded 45.60% of 2025 revenue. India's milestone-CNG car sales overtaking diesel in early 2025-illustrates consumer acceptance; 6,959 stations underpin convenient access while twin-cylinder packaging addresses boot-space objections. China relies on CNG for heavy-duty freight routes where battery mass remains uneconomic, reinforcing the region's anchor role in the CNG and LPG vehicle market.
Africa is the fastest-advancing territory, posting a 12.97% CAGR to 2031. Nigeria's USD 450 million infrastructure program, with a 1 million-conversion target, anchors supply certainty, while South Africa's gas-to-power ambitions create additional pull. Abundant domestic gas and limited legacy automotive investment lower switching friction, accelerating the CNG and LPG vehicle market's penetration. South America delivers an 7.98% CAGR, underpinned by Brazil's biofuel culture and Argentina's gas reserves. Brazil's ethanol flex-fuel heritage eases consumer education, and RNG pilot volumes seek transport buyers, feeding the CNG and LPG vehicle market. Hyundai's USD 1.1 billion green-mobility plan suggests OEMs perceive the continent as strategic for alternative fuels. Europe maintains a 5.12% pace, with Germany expanding biomethane output that feeds into station networks and broadens adoption.
- Hyundai Motor Company
- Suzuki Motor Corporation (Maruti Suzuki)
- Tata Motors Limited
- SAIC Motor Corporation
- IVECO Group
- AB Volvo
- Volkswagen AG
- Ford Motor Company
- Honda Motor Co., Ltd.
- Nissan Motor Co., Ltd.
- General Motors Company
- Mahindra & Mahindra Ltd.
- Great Wall Motor Co.
- Kia Corporation
- Dongfeng Motor Corporation
- Bajaj Auto Limited
- Ashok Leyland
- TVS Motor Company
Additional Benefits:
- The market estimate (ME) sheet in Excel format
- 3 months of analyst support
TABLE OF CONTENTS
1 Introduction
- 1.1 Study Assumptions and Market Definition
- 1.2 Scope of the Study
2 Research Methodology
3 Executive Summary
4 Market Landscape
- 4.1 Market Overview
- 4.2 Market Drivers
- 4.2.1 Government incentives and fuel-price parity initiatives
- 4.2.2 Rapid expansion of CNG/LPG refueling infrastructure
- 4.2.3 OEM portfolio shift toward factory-fitted CNG variants
- 4.2.4 Stricter tail-pipe CO? and NOx norms in urban clusters
- 4.2.5 Breakthrough twin-cylinder packaging freeing boot-space
- 4.2.6 Commercial-fleet preference for bio-CNG and renewable LPG
- 4.3 Market Restraints
- 4.3.1 Limited crash-test protocols for gaseous-fuel vehicles
- 4.3.2 Price-volatility in LNG feedstock for city-gas operators
- 4.3.3 EV-capex subsidies diluting CNG demand in metros
- 4.3.4 Perception gaps on in-cab methane safety and range anxiety
- 4.4 Value / Supply-Chain Analysis
- 4.5 Regulatory Landscape
- 4.6 Technological Outlook
- 4.7 Porter's Five Forces
- 4.7.1 Threat of New Entrants
- 4.7.2 Bargaining Power of Buyers
- 4.7.3 Bargaining Power of Suppliers
- 4.7.4 Threat of Substitutes
- 4.7.5 Intensity of Competitive Rivalry
- 4.8 Infrastructure Readiness Analysis
5 Market Size & Growth Forecasts (Value (USD) and Volume (Units))
- 5.1 By Fuel Type
- 5.1.1 Compressed Natural Gas (CNG)
- 5.1.2 Liquefied Petroleum Gas (LPG)
- 5.1.3 Compressed Bio-Gas (CBG)
- 5.2 By Vehicle Type
- 5.2.1 Passenger Cars
- 5.2.2 Light Commercial Vehicles
- 5.2.3 Buses and Coaches
- 5.2.4 Trucks (Medium and Heavy-Duty)
- 5.2.5 Two and Three-Wheelers
- 5.3 By Sales Channel
- 5.3.1 OEM-fitted
- 5.3.2 Retrofitted / After-market
- 5.4 By End-use Application
- 5.4.1 Private / Personal Use
- 5.4.2 Taxi and Ride-hailing Fleets
- 5.4.3 Public Transit Authorities
- 5.4.4 Industrial and Utility Fleets
- 5.5 By Cylinder Type
- 5.5.1 Type I (All-metal)
- 5.5.2 Type II (Metal hoop-wrapped)
- 5.5.3 Type III (Full composite)
- 5.5.4 Type IV (Polymer-liner composite)
- 5.6 By Geography
- 5.6.1 North America
- 5.6.1.1 United States
- 5.6.1.2 Canada
- 5.6.1.3 Rest of North America
- 5.6.2 South America
- 5.6.2.1 Brazil
- 5.6.2.2 Argentina
- 5.6.2.3 Colombia
- 5.6.2.4 Rest of South America
- 5.6.3 Europe
- 5.6.3.1 Germany
- 5.6.3.2 United Kingdom
- 5.6.3.3 France
- 5.6.3.4 Italy
- 5.6.3.5 Spain
- 5.6.3.6 Russia
- 5.6.3.7 Rest of Europe
- 5.6.4 Asia-Pacific
- 5.6.4.1 China
- 5.6.4.2 India
- 5.6.4.3 Japan
- 5.6.4.4 South Korea
- 5.6.4.5 Indonesia
- 5.6.4.6 Thailand
- 5.6.4.7 Rest of Asia-Pacific
- 5.6.5 Middle East and Africa
- 5.6.5.1 Turkey
- 5.6.5.2 Saudi Arabia
- 5.6.5.3 United Arab Emirates
- 5.6.5.4 Qatar
- 5.6.5.5 South Africa
- 5.6.5.6 Nigeria
- 5.6.5.7 Egypt
- 5.6.5.8 Kenya
- 5.6.5.9 Rest of Middle East and Africa
- 5.6.1 North America
6 Competitive Landscape
- 6.1 Market Concentration
- 6.2 Strategic Moves
- 6.3 Market Share Analysis
- 6.4 Company Profiles (includes Global Level Overview, Market Level Overview, Core Segments, Financials as Available, Strategic Information, Market Rank/Share for Key Companies, Products and Services, SWOT Analysis, and Recent Developments)
- 6.4.1 Hyundai Motor Company
- 6.4.2 Suzuki Motor Corporation (Maruti Suzuki)
- 6.4.3 Tata Motors Limited
- 6.4.4 SAIC Motor Corporation
- 6.4.5 IVECO Group
- 6.4.6 AB Volvo
- 6.4.7 Volkswagen AG
- 6.4.8 Ford Motor Company
- 6.4.9 Honda Motor Co., Ltd.
- 6.4.10 Nissan Motor Co., Ltd.
- 6.4.11 General Motors Company
- 6.4.12 Mahindra & Mahindra Ltd.
- 6.4.13 Great Wall Motor Co.
- 6.4.14 Kia Corporation
- 6.4.15 Dongfeng Motor Corporation
- 6.4.16 Bajaj Auto Limited
- 6.4.17 Ashok Leyland
- 6.4.18 TVS Motor Company
7 Market Opportunities and Future Outlook
- 7.1 White-space and Unmet-Need Assessment

 壓縮氣體儲存解決方案市場報告:趨勢、預測和競爭分析(至2035年)
 CNG汽車:市佔率分析、產業趨勢與統計、成長預測(2026-2031年)
 2026-2030年全球壓縮天然氣燃料箱市場非洲 CNG 和 LPG 汽車:市場佔有率分析、行業趨勢和統計數據以及成長預測(2026-2031 年)
 CNG 和 LPG 汽車市場:按燃料類型、引擎系統、汽缸類型、車輛類型、應用和銷售管道分類 - 全球市場預測(2026-2032 年)
 CNG 和 LPG 汽車市場 - 全球產業規模、佔有率、趨勢、機會和預測:按燃料類型、車輛類型、需求類別、地區和競爭格局分類,2021-2031 年
 2026年全球CNG和LPG汽車市場報告
 壓縮天然氣(CNG)汽車系統市場機會、成長促進因素、產業趨勢分析及預測(2025-2034年)印度 CNG 汽車市場:市場佔有率分析、行業趨勢和統計數據、成長預測(2025-2030 年)