


 |
市場調查報告書
商品編碼
2113357
美國油氣中游業務:市場佔有率分析、產業趨勢與統計及成長預測(2026-2031 年)United States Oil And Gas Midstream - Market Share Analysis, Industry Trends & Statistics, Growth Forecasts (2026 - 2031) |
||||||

※ 本網頁內容可能與最新版本有所差異。詳細情況請與我們聯繫。
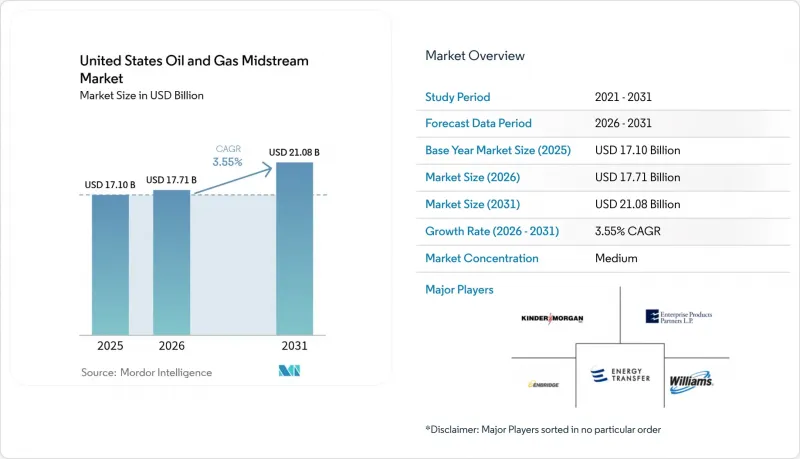
據 Mordor Intelligence 稱,2025 年美國中游油氣市場價值 171 億美元,預計到 2031 年將從 2026 年的 177.1 億美元成長至 210.8 億美元,預測期(2026-2031 年)複合年成長率為 3.55%。
本報告按基礎設施(管道、碼頭、倉儲設施)、產品類型(原油、天然氣、成品油、液化天然氣)和服務類型(管道建設、管道維護和維修、倉儲和裝卸服務、運輸和物流)進行細分。市場規模和預測均以美元計價。
美國中游油氣市場趨勢與洞察
墨西哥灣沿岸主導天然氣出口能力激增
到2028年,液化天然氣(LNG)的運作能力預計將增加至每日212億立方英尺(Bcf),這預計將成為美國中游油氣市場管道輸送能力的最大需求促進因素。 Venture Global公司投資280億美元的Calcachieux Pass 2項目,擁有91英里的輸氣管道,顯示每個終端的建成將如何帶動州際管道建設和壓縮設備升級。 Chenier公司的Corpus Christi 8號和9號生產線每年將新增超過300萬噸/年的產能,高壓連接的每條互連線路成本在5000萬美元至1億美元之間。雙向管道設計正在逐步標準化,允許在維護或颶風造成的管道中斷期間改變管道的流向。這將增加成本,但會提高管道的韌性。墨西哥灣沿岸地區的活動集中導致勞動力和特殊鋼材供應緊張,推高了小規模的新參與企業的資本支出。
擴大二疊紀盆地原油及聯產氣產量
二疊紀盆地的產量持續超過供應量,推動了對原油、天然氣和液化天然氣管道新增收集、加工和長途運輸能力的需求。菲利普斯66公司投資3億美元的鐵梅薩工廠計劃於2027年運作,該工廠將回收先前被燃燒掉的天然氣;而塔格拉斯公司日輸氣量達24億立方英尺的連接洛基快線管道將為西部市場提供通道。在美國油氣中游市場,綜合營運商正透過根據樞紐之間的價格差異調整原油、天然氣和液化天然氣管道的運輸量,來最大化系統現金流。流量最佳化軟體正在推遲新幹線管道的鋪設,直到運輸量確認永續為止。生產商往往更傾向於能夠提供多種商品照付不議合約的托運人,這使得大型成熟業者在談判中佔據優勢。
聯邦許可程序中的瓶頸(NEPA 第 401 條)
儘管內政部設定的一年內完成環境影響評估 (EIS) 的目標減輕了行政負擔,但訴訟仍在阻礙土地徵用,導致每英里土地的延誤成本高達 200 萬美元。由於各州即使聯邦機構批准項目,也可以叫停項目,因此第 401 條款水資源審查也拖慢了進度。能源傳輸公司 (Energy Transfer) 的查爾斯湖液化天然氣擴建計畫就是一個典型的例子,說明在美國中游油氣市場,向聯邦能源管理委員會 (FERC) 提交的持續申請已成為常態。開發商在早期階段集中精力進行基準調查和社區參與,在最終投資決定 (FID) 前增加支出,同時仍能維持進度。只有財務實力雄厚的公司才能承受數年的延誤而不損害其信用評級。
細分市場分析
到2025年,管道運輸將占美國中游油氣市場收入的44.25%,成為連接盆地、加工廠和碼頭的核心基礎設施。儘管幹線管道的投資規模龐大,陸上建設成本平均每英里高達400萬美元,但只要有20年的照付不議合約作為保障,這種投資就是合理的。金德摩根公司93億美元的累積訂單(其中三分之二是天然氣運輸)表明,人們對擴大美國大陸電網規模仍然充滿信心。
新建設注重雙向輸氣、分段專用閥門和高功率壓縮機,從而能夠靈活地在出口和電力市場需求之間分配天然氣。這些都是老舊管線所缺乏的。到2025年,終端基礎設施僅佔總收入的17.85%,但隨著液化天然氣(LNG)和液化石油氣(LPG)碼頭數量的激增,預計到2031年將以4.95%的複合年成長率成長。光是卡爾卡修克斯通道2號計畫就新建了近100英里的支線管道和兩個裝卸泊位,凸顯了每個碼頭將如何擴大系統投資。常被忽略的儲氣洞和儲槽提供了柔軟性,既可用於淡季套利,也可在許可證問題出現時作為乙烷出口的緩衝。
其他好處:
- Excel格式的市場預測(ME)表
- 3個月的分析師支持
目錄
第1章:引言
- 研究假設和市場定義
- 調查範圍
第2章:調查方法
第3章執行摘要
第4章 市場狀況
- 市場概覽
- 市場促進因素
- 墨西哥灣沿岸出口能力的快速成長(主要由液化天然氣推動)是一個重要因素。
- 二疊紀盆地原油及聯產氣產量成長
- 人工智慧驅動的資料中心對電力需求不斷成長,推動了天然氣處理能力的提升。
- 增加作為石油化學原料的乙烷回收量
- 企業引進數位化和預測性維護
- CCUS管道開發激勵措施(IRA 45Q)
- 市場限制因素
- 聯邦政府許可流程中的瓶頸(《國家環境政策法案》第 401 條)
- 激進分子反對/因ESG導致的資金限制
- 傳統路線長距離石油管線供應過剩
- 中國乙烷出口許可證的不確定性
- 供應鏈分析
- 監理情勢
- 技術展望
- 管道設置容量分析
- 波特五力模型
- PESTLE分析
第5章 市場規模與成長預測
- 透過基礎設施
- 管道
- 終端
- 倉儲設施(地下和地上)
- 依產品類型
- 原油
- 天然氣
- 精煉產品
- LNG
- 按服務類型
- 管道建置
- 管道維護和維修
- 倉儲及搬運服務
- 運輸/物流
第6章 競爭情勢
- 市場集中度
- 策略趨勢(併購、聯盟、購電協議)
- 市場佔有率分析(主要公司的市場排名和佔有率)
- 公司簡介
- Kinder Morgan Inc.
- Energy Transfer LP
- Enterprise Products Partners LP
- Enbridge Inc.(US assets)
- Williams Companies Inc.
- MPLX LP
- ONEOK Inc.
- Plains All American Pipeline LP
- Targa Resources Corp.
- DT Midstream Inc.
- Cheniere Energy Inc.
- TC Energy Corp.(Columbia Gas)
- Magellan Midstream(ONEOK)
- WhiteWater Midstream LLC
- Atlantic Coast Pipeline LLC
- Maritimes & Northeast Pipeline LLC
- Tallgrass Energy LP
- Genesis Energy LP
- Shell Pipeline Company LP
- Freeport LNG Development LP
第7章 市場機會與未來展望
According to Mordor Intelligence, the United States oil and gas midstream market size was valued at USD 17.10 billion in 2025 and estimated to grow from USD 17.71 billion in 2026 to reach USD 21.08 billion by 2031, at a CAGR of 3.55% during the forecast period (2026-2031).
This report is Segmented by Infrastructure (Pipelines, Terminals, and Storage Facilities), Product Type (Crude Oil, Natural Gas, Refined Products, and LNG), and Service Type (Pipeline Construction, Pipeline Maintenance and Repair, Storage and Handling Services, and Transportation and Logistics). The Market Sizes and Forecasts are Provided in Terms of Value (USD).
United States Oil And Gas Midstream Market Trends and Insights
LNG-led Surge in Gulf Coast Export Capacity
Operational LNG capability is expected to increase to 21.2 Bcf/d by 2028, creating the single largest draw on pipeline throughput in the US oil and gas midstream market. Venture Global's USD 28 billion Calcasieu Pass 2, featuring a 91-mile feeder line, demonstrates how each terminal triggers interstate pipeline builds and compression upgrades. Cheniere's Corpus Christi Trains 8 & 9 add more than 3 Mtpa and require USD 50-100 million per interconnection for high-pressure tie-ins. Bidirectional design becomes standard, allowing lines to reverse during maintenance or hurricane disruptions, which adds cost but boosts resiliency. Concentrated Gulf activity tightens labor and specialty steel supply, elevating capital expenditures for smaller entrants.
Permian Crude & Associated-gas Production Growth
Permian output continues to outstrip takeaway, driving the need for new gathering, processing, and long-haul capacity across crude, gas, and NGL streams. Phillips 66's USD 300 million Iron Mesa plant, starting in 2027, captures gas once flared, while Tallgrass's 2.4 Bcf/d connector to Rockies Express unlocks western markets. Integrated operators switch volumes among crude, gas, and NGL pipelines based on hub spreads, maximizing system cash flow in the US oil and gas midstream market. Flow-optimization software defers the installation of new trunklines until volumes prove to be durable. Producers favor shippers that can offer multi-commodity take-or-pay contracts, tilting negotiation leverage toward large incumbents.
Federal Permitting Bottlenecks (NEPA, Sec 401)
One-year EIS targets set by Interior reduce paperwork, but lawsuits still stall rights-of-way, resulting in delay costs of up to USD 2 million per mile. Section 401 water reviews allow states to halt projects even when federal agencies approve, thereby prolonging the queue. Energy Transfer's Lake Charles LNG extension shows how serial FERC filings become routine in the US oil and gas midstream market. Developers front-load baseline studies and community outreach, inflating pre-FID spend but safeguarding schedules. Only the largest balance sheets can absorb multi-year delays without jeopardizing credit metrics.
Other drivers and restraints analyzed in the detailed report include:
- AI-Driven Data-Center Power Demand Boosting Gas Throughput
- Rising Ethane Recovery for Petrochemical Feedstock
- Activist Opposition / ESG Capital Constraints
For complete list of drivers and restraints, kindly check the Table Of Contents.
Segment Analysis
Pipelines supplied 44.25% of 2025 revenue for the US oil and gas midstream market and form the connective backbone among basins, processors, and docks. Capital cost averages USD 4 million per mile onshore, making trunkline investments sizable yet defensible when underpinned by 20-year take-or-pay contracts. Kinder Morgan's USD 9.3 billion backlog, two-thirds of which is dedicated to gas transmission, signals continued faith in continental grid expansion.
New builds emphasize bidirectional flow, sectionalized valves, and high-horsepower compression to swing gas between export and power-market pulls, features that older pipe lacks. Terminal infrastructure, although accounting for only 17.85% of 2025 revenue, is expected to advance at a 4.95% CAGR through 2031 as LNG and LPG docks proliferate. Calcasieu Pass 2 alone drives nearly 100 miles of new lateral pipe and twin loading berths, underscoring how each dock multiplies system spend. Storage caverns and tanks, often overlooked, yield optionality to capture shoulder-season arbitrage and to buffer ethane exports during license upheavals.
Complete Report Scope:
- By Infrastructure
- Pipelines
- Terminals
- Storage Facilities (Underground and Above-ground)
- By Product Type
- Crude Oil
- Natural Gas
- Refined Products
- LNG
- By Service Type
- Pipeline Construction
- Pipeline Maintenance and Repair
- Storage and Handling Services
- Transportation and Logistics
List of Companies Covered in this Report:
- Kinder Morgan Inc.
- Energy Transfer LP
- Enterprise Products Partners LP
- Enbridge Inc. (U.S. assets)
- Williams Companies Inc.
- MPLX LP
- ONEOK Inc.
- Plains All American Pipeline LP
- Targa Resources Corp.
- DT Midstream Inc.
- Cheniere Energy Inc.
- TC Energy Corp. (Columbia Gas)
- Magellan Midstream (ONEOK)
- WhiteWater Midstream LLC
- Atlantic Coast Pipeline LLC
- Maritimes & Northeast Pipeline LLC
- Tallgrass Energy LP
- Genesis Energy LP
- Shell Pipeline Company LP
- Freeport LNG Development LP
Additional Benefits:
- The market estimate (ME) sheet in Excel format
- 3 months of analyst support
TABLE OF CONTENTS
1 Introduction
- 1.1 Study Assumptions & Market Definition
- 1.2 Scope of the Study
2 Research Methodology
3 Executive Summary
4 Market Landscape
- 4.1 Market Overview
- 4.2 Market Drivers
- 4.2.1 LNG-led surge in Gulf Coast export capacity
- 4.2.2 Permian crude & associated-gas production growth
- 4.2.3 AI-driven data-center power demand boosting gas throughput
- 4.2.4 Rising ethane recovery for petrochemical feedstock
- 4.2.5 Digitization & predictive-maintenance adoption by operators
- 4.2.6 CCUS pipeline build-out incentives (IRA 45Q)
- 4.3 Market Restraints
- 4.3.1 Federal permitting bottlenecks (NEPA, Sec. 401)
- 4.3.2 Activist opposition / ESG capital constraints
- 4.3.3 Long-haul oil pipeline over-capacity in legacy corridors
- 4.3.4 China-focused ethane export license uncertainty
- 4.4 Supply-Chain Analysis
- 4.5 Regulatory Landscape
- 4.6 Technological Outlook
- 4.7 Installed Pipeline Capacity Analysis
- 4.8 Porter's Five Forces
- 4.8.1 Threat of New Entrants
- 4.8.2 Bargaining Power of Suppliers
- 4.8.3 Bargaining Power of Buyers
- 4.8.4 Threat of Substitutes
- 4.8.5 Industry Rivalry
- 4.9 PESTLE Analysis
5 Market Size & Growth Forecasts
- 5.1 By Infrastructure
- 5.1.1 Pipelines
- 5.1.2 Terminals
- 5.1.3 Storage Facilities (Underground and Above-ground)
- 5.2 By Product Type
- 5.2.1 Crude Oil
- 5.2.2 Natural Gas
- 5.2.3 Refined Products
- 5.2.4 LNG
- 5.3 By Service Type
- 5.3.1 Pipeline Construction
- 5.3.2 Pipeline Maintenance and Repair
- 5.3.3 Storage and Handling Services
- 5.3.4 Transportation and Logistics
6 Competitive Landscape
- 6.1 Market Concentration
- 6.2 Strategic Moves (M&A, Partnerships, PPAs)
- 6.3 Market Share Analysis (Market Rank/Share for key companies)
- 6.4 Company Profiles (includes Global level Overview, Market level overview, Core Segments, Financials as available, Strategic Information, Products & Services, and Recent Developments)
- 6.4.1 Kinder Morgan Inc.
- 6.4.2 Energy Transfer LP
- 6.4.3 Enterprise Products Partners LP
- 6.4.4 Enbridge Inc. (U.S. assets)
- 6.4.5 Williams Companies Inc.
- 6.4.6 MPLX LP
- 6.4.7 ONEOK Inc.
- 6.4.8 Plains All American Pipeline LP
- 6.4.9 Targa Resources Corp.
- 6.4.10 DT Midstream Inc.
- 6.4.11 Cheniere Energy Inc.
- 6.4.12 TC Energy Corp. (Columbia Gas)
- 6.4.13 Magellan Midstream (ONEOK)
- 6.4.14 WhiteWater Midstream LLC
- 6.4.15 Atlantic Coast Pipeline LLC
- 6.4.16 Maritimes & Northeast Pipeline LLC
- 6.4.17 Tallgrass Energy LP
- 6.4.18 Genesis Energy LP
- 6.4.19 Shell Pipeline Company LP
- 6.4.20 Freeport LNG Development LP
7 Market Opportunities & Future Outlook
- 7.1 White-space & Unmet-Need Assessment


