


 |
市場調查報告書
商品編碼
2100546
水力發電:市場佔有率分析、行業趨勢和統計數據、成長預測(2026-2031 年)Hydropower - Market Share Analysis, Industry Trends & Statistics, Growth Forecasts (2026 - 2031) |
||||||

※ 本網頁內容可能與最新版本有所差異。詳細情況請與我們聯繫。
據 Mordor Intelligence 稱,2026 年水力發電市場規模估計為 1.5兆瓦,高於 2025 年的 1.47兆瓦,預計到 2031 年將達到 1.67兆瓦,2026 年至 2031 年的複合年成長率為 2.19%。
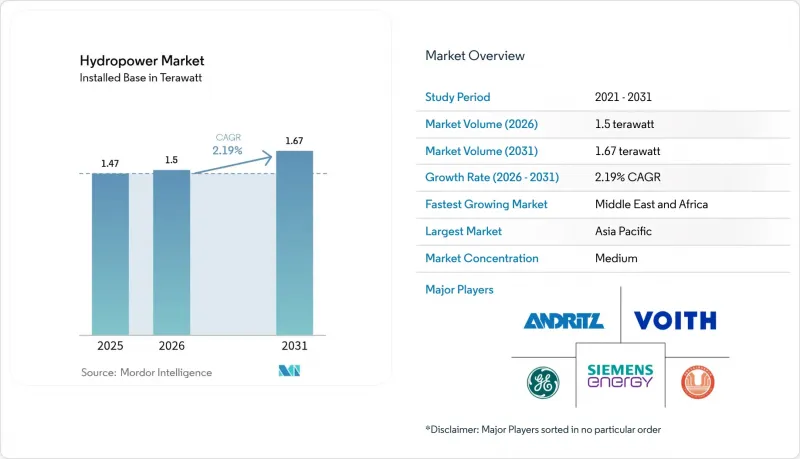
本報告按裝置容量(大型水力發電、中型水力發電、小規模和微型水力發電)、技術(水庫式、徑流式、抽水蓄能式、河道式和微型管道式)、最終用戶(公共產業、獨立發電企業、工業和私人用途)以及地區(北美、歐洲、亞太地區及其他地區)進行細分。市場規模和預測以裝置容量(吉瓦,GW)為單位。
全球水力發電市場趨勢與洞察
將老舊水壩改造成抽水蓄能水力發電廠的維修正在迅速增加。
維修計畫透過可逆式水泵水輪機升級現有水壩,與新建水庫計畫相比,可減少高達 60% 的資本投資,並將電網平衡反應提高一倍。由於可變可再生能源佔尖峰負載的 50% 以上,歐洲電力公司正主導這一領域的應用,而北美營運商則推遲新建峰值發電廠,轉而將目標轉向輸電受限山谷中的水庫。 880 兆瓦的克魯阿昌水力發電廠擴建計畫表明,現代化改造後的機組可在六分鐘內啟動,系統營運商正擴大透過輔助服務市場來利用這一特性獲利。數位孿生平台使負責人能夠即時模擬水量、渦輪機疲勞和市場價格,從而將傳統基礎設施轉變為靈活的儲能樞紐,並將資產壽命延長至 2050 年以後。
與燃氣調峰電廠相比,其平準化發電成本更低。
儘管現有水力發電廠的營業成本低於50美元/兆瓦時,但由於燃料價格飆升,燃氣調峰電廠的營運成本卻超過80美元/兆瓦時,而且成本差距還在逐季擴大。碳定價機制進一步加重了燃氣發電的負擔,而水力發電廠的零燃料特性則可透過零排放證書帶來額外收入。由於運轉率優勢,水力發電廠每年可發電的時間是燃氣調峰電廠的兩倍,營運商不僅可以從售電中獲得收入,還可以從頻率調節中獲得收入。中西部獨立電網營運商(MISO)管轄範圍內的電力公司已批准在其2025年併網備用名單中升級3.2吉瓦的水力發電容量,從而遏制了過去十年燃氣調峰電廠建設不斷擴張的趨勢。
社會接受度面臨的風險日益增加,可能遭到原住民的反對
如果開發商無法獲得受影響社區的“自由、事先和充分知情同意(FPIC)”,則專案延期平均可達三年。卡利瓦大壩等備受矚目的項目取消案例凸顯了聲譽風險的嚴重性,保險公司目前已將社會認可度爭議排除在標準保單之外。開發商將高達25%的資本預算用於利潤分成,而貸款方則要求進行詳細的人權風險評估。投資者預計,未來將轉向社區規模的徑流式水力發電項目,這類項目繞過爭議地區,最大限度地減少人口遷移帶來的挑戰。
細分市場分析
2025年,裝置容量低於10兆瓦的小規模和超小規模水力發電廠將佔全年裝置容量的9.20%,預計到2031年,隨著電力公司和微電網開發商推進分散式電氣化,其成長速度將超過其他任何規模的水力發電廠。同時,裝置容量超過100兆瓦的水力發電廠仍佔絕對數量優勢,在2025年將佔水力發電市場佔有率的72.85%。這類規模水力發電廠的擁有者正致力於提高渦輪機的效率,將使水力發電效率提高3至5個百分點,並將使用壽命延長至80年。
安裝物流便利性的提升促使小規模水力發電開發商採用容器化組件供應設備,從而降低了土木工程成本並擴大了可用水頭範圍。基於機器學習的數位孿生技術能夠預測空化現象並調整導葉角度,從而將疲勞度降低99%。大型水壩如今不僅在電力市場競爭,還在競標服務領域競爭。隨著抽水蓄能電站的日益維修,到2031年,許多高水頭電站的運作方式將更像儲能電池而非基本負載發電機。中型(10-100兆瓦)專案則兼顧了這些策略,在規模經濟和較低的社會接受度之間取得了平衡。
區域分析
亞太地區在水力發電領域繼續發揮主導作用。預計到2025年,該地區將佔全球發電量的45.60%,這主要得益於中國正在建設中的耗資1,370億美元的西藏超級大壩(史上最大的單體水力發電發電工程)。去年,該地區的總發電量達到5,19吉瓦。這得歸功於中國大力推動高海拔地區的水力發電項目,以及印度建設的數十座小規模電站,這些電站為農村地區提供穩定的電力供應,同時減少了對環境的影響。日本正大力投資維修老舊水壩,更換渦輪機並引入數位化控制系統,使設備的使用壽命遠遠超過通常的50年。寮國和巴基斯坦等國正在建造水壩,旨在向鄰國出口電力,將水資源轉化為區域間交易的商品。世界上大部分水力發電製造技術都集中在亞太地區,這使得該地區的開發商能夠受益於更短的前置作業時間和更低的成本。
儘管中東和非洲目前的規模較小,2024年運作發電裝置容量僅為2吉瓦,但它們卻是市場成長最快的地區,預計到2031年將以6.95%的複合年成長率成長。諸如耗資50億美元的巴特卡峽谷計畫和埃塞俄比亞的復興大壩等大型計畫表明,水力發電正被用於為工廠供電並連接區域電網。安哥拉和南非正在為新建電廠資金籌措,同時也對現有電廠進行現代化改造以提高發電量。大型石油公司也密切關注著這一趨勢。道達爾能源公司最近收購了斯卡特克在非洲的水電資產組合,這清楚地表明了資金正轉向可再生能源。開發銀行認為水壩對於電力供應和氣候適應能力都至關重要,並正在支持許多此類計畫。
這一趨勢在北美和歐洲正在加速發展。由於大部分最佳河段已被築壩,人們的關注點正轉向提高現有設施的發電量。在美國,隨著水庫從乾旱中恢復,預計水力發電將在2025年復甦,同時新的聯邦法規正在加快設備升級的許可核准程序。加拿大的清潔能源計畫正將越來越多的水力發電輸送到美國。在歐洲,挪威正在吸引投資者將剩餘的水力發電轉化為綠色氫氣出口。南美洲的情況則介於兩者之間。在巴西,儘管氣候變遷導致的乾旱使長期發電規劃變得困難,但像聖西芒水力發電廠這樣的大型發電廠仍在進行維修。在整個南美洲,各國政府都在努力平衡廉價穩定的水力發電的無可否認的優勢與降雨模式變化帶來的日益嚴峻的挑戰。
其他好處:
- Excel格式的市場預測(ME)表
- 3個月的分析師支持
目錄
第1章:引言
- 研究假設和市場定義
- 調查範圍
第2章:調查方法
第3章執行摘要
第4章 市場狀況
- 市場概覽
- 市場促進因素
- 將老舊水壩改造成抽水蓄能水力發電廠的維修正在迅速增加。
- 與燃氣調峰電廠相比,其平準化發電成本更低。
- 為了增強應對氣候變遷的能力,需要加強基本負載可再生能源的發展。
- 整合併網逆變器,以實現水力發電和太陽能發電混合電站的建造。
- 為資料中心叢集提供全天候清潔能源採購
- 市場限制因素
- 社會接受度上升以及原住民反對的風險增加
- 在經合組織市場獲得批准前置作業時間很長。
- 熱帶流域因泥沙淤積導致排水能力下降
- 極端天氣引發的水壩潰決導致保險費上漲。
- 供應鏈分析
- 監理情勢
- 技術展望
- 波特五力模型
第5章 市場規模與成長預測
- 按產能
- 大型水力發電(100兆瓦或以上)
- 中型水力發電(10-100兆瓦)
- 小規模和超小規模水力發電(小於10兆瓦)
- 透過技術
- 儲存底部
- 河川利用類型
- 抽水蓄能水力發電
- 串流內和微型導管
- 依成分(僅限定性分析)
- 渦輪
- 發電機
- 控制與自動化
- 工廠周邊設備
- 最終用戶
- 公共產業(州和公共)
- 獨立發電機
- 工業和專有用途
- 按地區
- 北美洲
- 美國
- 加拿大
- 墨西哥
- 歐洲
- 俄羅斯
- 挪威
- 土耳其
- 法國
- 義大利
- 西班牙
- 瑞士
- 瑞典
- 奧地利
- 其他歐洲國家
- 亞太地區
- 中國
- 印度
- 日本
- 巴基斯坦
- 寮國
- 其他亞太國家
- 南美洲
- 巴西
- 阿根廷
- 哥倫比亞
- 委內瑞拉
- 其他南美國家
- 中東和非洲
- 伊朗
- 衣索比亞
- 安哥拉
- 南非
- 其他中東和非洲國家
- 北美洲
第6章 競爭情勢
- 市場集中度
- 策略趨勢(併購、聯盟、購電協議)
- 市場佔有率分析(主要公司的市場排名和佔有率)
- 公司簡介
- GE Renewable Energy
- Siemens Energy AG
- Andritz AG
- Voith GmbH & Co. KGaA
- China Yangtze Power Co. Ltd
- PJSC RusHydro
- EDF SA
- Iberdrola SA
- Power Construction Corp of China
- Alstom Hydro China
- Toshiba Energy Systems
- Harbin Electric Corporation
- BC Hydro
- Statkraft AS
- Engie SA
- Kansai Electric Power
- Hydro-Quebec
- Voith Hydro(India)
- Andritz Hydro(Germany)
- Duke Energy Corp
第7章 市場機會與未來展望
According to Mordor Intelligence, hydropower market size in 2026 is estimated at 1.5 terawatt, growing from 2025 value of 1.47 terawatt with 2031 projections showing 1.67 terawatt, growing at 2.19% CAGR over 2026-2031.
This report is Segmented by Capacity (Large Hydro, Medium Hydro, and Small and Micro Hydro), Technology (Reservoir-Based, Run-Of-River, Pumped-Storage, and In-Stream and Micro-Conduit), End-User (Utilities, Independent Power Producers, and Industrial and Captive), and Geography (North America, Europe, Asia Pacific, and More). The Market Sizes and Forecasts are Provided in Terms of Installed Capacity (GW).
Global Hydropower Market Trends and Insights
Surge in Pumped-Storage Retrofits of Ageing Dams
Retrofit programs are upgrading conventional dams with reversible pump-turbines, cutting capital outlays by up to 60% relative to greenfield storage projects and doubling response speeds for grid balancing. European utilities lead deployments as variable renewables exceed 50% of peak load, while North American operators target reservoirs inside transmission-constrained valleys to defer new peaker plants. The 880 MW Cruachan expansion demonstrates how modernized units start in six minutes, a feature system operators increasingly monetize through ancillary-service markets. Digital twin platforms allow planners to model water, turbine fatigue, and market prices in real time, turning legacy infrastructure into flexible storage hubs that extend asset lives beyond 2050.
Declining Levelized Cost Versus Gas-Peaking Plants
Existing hydropower plants run below USD 50/MWh, while gas-peaking facilities exceed USD 80/MWh in fuel-driven price spikes, widening the cost gap each quarter. Carbon pricing mechanisms further penalize gas, and hydropower's zero-fuel profile generates bonus revenues through emissions-free certificates. Capacity-factor superiority keeps hydropower dispatchable for twice as many hours per year as gas peakers, and operators can stack frequency-regulation payments on top of energy sales. Utilities in the Midcontinent Independent System Operator cleared 3.2 GW of hydropower upgrades in 2025 interconnection queues, reversing a decade-long gas-peaking build-out trend.
Escalating Social-Licence Risk & Indigenous Opposition
Project delays average three years when developers fail to secure free, prior, and informed consent from affected communities. High-profile cancellations such as the Kaliwa dam underscore reputational danger, and insurers now exclude social-licence disputes from standard policies. Developers allocate up to 25% of capital budgets for benefit-sharing, while lenders demand detailed human-rights risk assessments. Investors foresee a tilt toward community-scale run-of-river schemes that bypass contested territories and minimize resettlement challenges.
Other drivers and restraints analyzed in the detailed report include:
- Climate-Resilience Mandates Strengthening Baseload Renewables
- Grid-Forming Inverter Integration Enabling Hybrid Hydro-Solar Plants
- Long Permitting Lead-Times in OECD Markets
For complete list of drivers and restraints, kindly check the Table Of Contents.
Segment Analysis
Small and micro facilities below 10 MW captured 9.20% of annual installs in 2025 and are forecast to expand more than any other class through 2031 as utilities and mini-grid developers pursue decentralized electrification. Meanwhile, stations above 100 MW still dominate absolute totals, holding 72.85% of the hydropower market share in 2025. Asset owners in this tier concentrate on turbine-efficiency upgrades that lift water-to-wire yields by 3-5 percentage points and extend lifespans to 80 years.
Easier installation logistics push small hydro developers to bundle equipment in containerized kits, cutting civil works costs and widening viable head ranges. Machine-learning-enabled digital twins predict cavitation and adjust wicket-gate angles to reduce fatigue by 99%. Large dams now compete in ancillary-service auctions rather than energy-only markets, and rising pumped-storage retrofits mean many high-head plants will operate more like batteries than base-load generators by 2031. Medium-sized (10-100 MW) projects bridge these strategies, balancing economies of scale against lower social-licence hurdles.
Complete Report Scope:
- By Capacity
- Large Hydro (Above 100 MW)
- Medium Hydro (10 to 100 MW)
- Small and Micro Hydro (Below 10 MW)
- By Technology
- Reservoir-Based
- Run-of-River
- Pumped-Storage
- In-Stream and Micro-conduit
- By Component (Qualitative Analysis only)
- Turbines
- Generators
- Control and Automation
- Balance-of-Plant
- By End-User
- Utilities (State and Public)
- Independent Power Producers
- Industrial and Captive
- By Geography
- North America
- United States
- Canada
- Mexico
- Europe
- Russia
- Norway
- Turkey
- France
- Italy
- Spain
- Switzerland
- Sweden
- Austria
- Rest of Europe
- Asia Pacific
- China
- India
- Japan
- Pakistan
- Laos
- Rest of Asia-Pacific
- South America
- Brazil
- Argentina
- Colombia
- Venezuela
- Rest of South America
- Middle East and Africa
- Iran
- Ethiopia
- Angola
- South Africa
- Rest of Middle East and Africa
- North America
Geography Analysis
Asia Pacific keeps setting the pace for hydropower. The region controlled 45.60% of global capacity in 2025, thanks largely to China's USD 137 billion Tibet mega-dam, the biggest single hydropower project ever attempted. Total regional capacity reached 519 GW last year as China pushed ahead with high-elevation schemes and India added dozens of small plants that bring reliable power to rural districts while cutting ecological footprints. Japan is pouring money into overhauling its aging dams, swapping out turbines and layering in digital controls that push equipment lifetimes well past the usual 50-year mark. Countries such as Laos and Pakistan are building dams aimed at exporting power to neighbors, turning water into a traded regional commodity. Because so much of the world's hydropower manufacturing know-how sits in the Asia-Pacific, developers everywhere benefit from faster lead times and lower costs.
The Middle East and Africa might be small today, just 2 GW of new capacity came online in 2024, but it is the fastest-growing pocket of the market, on track for a 6.95% CAGR through 2031. Big-ticket ventures like the USD 5 billion Batoka Gorge project and Ethiopia's Grand Ethiopian Renaissance Dam show how hydropower is being used to power factories and knit together regional grids. Angola and South Africa are modernizing existing plants to squeeze out extra megawatts while they line up funding for new ones. Even oil majors are taking notice: TotalEnergies recently bought Scatec's African hydropower portfolio, a clear signal that the money is shifting toward renewables. Development banks are backing many of these efforts, viewing dams as critical for both electrification and climate resilience.
North America and Europe are further along the curve. Most of their best river sites are already dammed, so the focus has turned to squeezing more output from what's there. The United States expects hydropower production to bounce back in 2025 as reservoirs recover from drought, while new federal rules aim to speed up license amendments for upgrades. Canada's clean-energy push is sending ever more hydro-generated electrons south of the border. In Europe, Norway is courting investors to turn surplus water power into green hydrogen for export. South America sits somewhere in the middle: Brazil is refurbishing big plants such as Sao Simao even as climate-driven droughts make long-term output harder to plan. Across the continent, governments are trying to balance the undeniable benefits of cheap, steady hydropower with the mounting challenges of changing rainfall patterns.
- GE Renewable Energy
- Siemens Energy AG
- Andritz AG
- Voith GmbH & Co. KGaA
- China Yangtze Power Co. Ltd
- PJSC RusHydro
- EDF SA
- Iberdrola SA
- Power Construction Corp of China
- Alstom Hydro China
- Toshiba Energy Systems
- Harbin Electric Corporation
- BC Hydro
- Statkraft AS
- Engie SA
- Kansai Electric Power
- Hydro-Quebec
- Voith Hydro (India)
- Andritz Hydro (Germany)
- Duke Energy Corp
Additional Benefits:
- The market estimate (ME) sheet in Excel format
- 3 months of analyst support
TABLE OF CONTENTS
1 Introduction
- 1.1 Study Assumptions & Market Definition
- 1.2 Scope of the Study
2 Research Methodology
3 Executive Summary
4 Market Landscape
- 4.1 Market Overview
- 4.2 Market Drivers
- 4.2.1 Surge in pumped-storage retrofits of ageing dams
- 4.2.2 Declining levelized cost versus gas-peaking plants
- 4.2.3 Climate-resilience mandates strengthening baseload renewables
- 4.2.4 Grid-forming inverter integration enabling hybrid hydro-solar plants
- 4.2.5 Corporate 24/7 clean-power procurement for data-centre clusters
- 4.3 Market Restraints
- 4.3.1 Escalating social licence risk & indigenous opposition
- 4.3.2 Long permitting lead-times in OECD markets
- 4.3.3 Sedimentation-induced capacity loss in tropical basins
- 4.3.4 Rising insurance premiums for extreme-weather dam failures
- 4.4 Supply-Chain Analysis
- 4.5 Regulatory Landscape
- 4.6 Technological Outlook
- 4.7 Porter's Five Forces
- 4.7.1 Bargaining Power of Suppliers
- 4.7.2 Bargaining Power of Buyers
- 4.7.3 Threat of New Entrants
- 4.7.4 Threat of Substitutes
- 4.7.5 Competitive Rivalry
5 Market Size & Growth Forecasts
- 5.1 By Capacity
- 5.1.1 Large Hydro (Above 100 MW)
- 5.1.2 Medium Hydro (10 to 100 MW)
- 5.1.3 Small and Micro Hydro (Below 10 MW)
- 5.2 By Technology
- 5.2.1 Reservoir-Based
- 5.2.2 Run-of-River
- 5.2.3 Pumped-Storage
- 5.2.4 In-Stream and Micro-conduit
- 5.3 By Component (Qualitative Analysis only)
- 5.3.1 Turbines
- 5.3.2 Generators
- 5.3.3 Control and Automation
- 5.3.4 Balance-of-Plant
- 5.4 By End-User
- 5.4.1 Utilities (State and Public)
- 5.4.2 Independent Power Producers
- 5.4.3 Industrial and Captive
- 5.5 By Geography
- 5.5.1 North America
- 5.5.1.1 United States
- 5.5.1.2 Canada
- 5.5.1.3 Mexico
- 5.5.2 Europe
- 5.5.2.1 Russia
- 5.5.2.2 Norway
- 5.5.2.3 Turkey
- 5.5.2.4 France
- 5.5.2.5 Italy
- 5.5.2.6 Spain
- 5.5.2.7 Switzerland
- 5.5.2.8 Sweden
- 5.5.2.9 Austria
- 5.5.2.10 Rest of Europe
- 5.5.3 Asia Pacific
- 5.5.3.1 China
- 5.5.3.2 India
- 5.5.3.3 Japan
- 5.5.3.4 Pakistan
- 5.5.3.5 Laos
- 5.5.3.6 Rest of Asia-Pacific
- 5.5.4 South America
- 5.5.4.1 Brazil
- 5.5.4.2 Argentina
- 5.5.4.3 Colombia
- 5.5.4.4 Venezuela
- 5.5.4.5 Rest of South America
- 5.5.5 Middle East and Africa
- 5.5.5.1 Iran
- 5.5.5.2 Ethiopia
- 5.5.5.3 Angola
- 5.5.5.4 South Africa
- 5.5.5.5 Rest of Middle East and Africa
- 5.5.1 North America
6 Competitive Landscape
- 6.1 Market Concentration
- 6.2 Strategic Moves (M&A, Partnerships, PPAs)
- 6.3 Market Share Analysis (Market Rank/Share for key companies)
- 6.4 Company Profiles (includes Global level Overview, Market level overview, Core Segments, Financials as available, Strategic Information, Products & Services, and Recent Developments)
- 6.4.1 GE Renewable Energy
- 6.4.2 Siemens Energy AG
- 6.4.3 Andritz AG
- 6.4.4 Voith GmbH & Co. KGaA
- 6.4.5 China Yangtze Power Co. Ltd
- 6.4.6 PJSC RusHydro
- 6.4.7 EDF SA
- 6.4.8 Iberdrola SA
- 6.4.9 Power Construction Corp of China
- 6.4.10 Alstom Hydro China
- 6.4.11 Toshiba Energy Systems
- 6.4.12 Harbin Electric Corporation
- 6.4.13 BC Hydro
- 6.4.14 Statkraft AS
- 6.4.15 Engie SA
- 6.4.16 Kansai Electric Power
- 6.4.17 Hydro-Quebec
- 6.4.18 Voith Hydro (India)
- 6.4.19 Andritz Hydro (Germany)
- 6.4.20 Duke Energy Corp
7 Market Opportunities & Future Outlook
- 7.1 White-space & Unmet-need Assessment

 水力發電廠狀態監測解決方案市場:全球市場預測,2026-2032年
 全球水力發電廠維修市場規模、佔有率、趨勢及成長分析報告(2026-2034)
 美國水力發電:市場佔有率分析、行業趨勢和統計數據以及成長預測(2026-2031 年)水力發電市場-2026-2032年全球市場預測
 水力發電市場:2034 年預測 - 全球電廠類型、裝置容量、組件、渦輪機類型、應用、所有權、最終用戶、技術、服務和區域分析
 2026 年至 2035 年水力發電廠維修的市場機會、成長動力、產業趨勢與預測。北美水力發電:市場佔有率分析、產業趨勢與統計及成長預測(2026-2031 年)
 水力發電市場規模、佔有率、趨勢和預測:按規模、應用和地區分類,2026-2034年水力發電控制系統市場:按產品類型、渦輪機類型、電壓等級、應用和最終用戶分類-2026-2032年全球市場預測水力發電閘門市場:2026-2032年全球市場預測(以閘門類型、閘門操作方式、材質、安裝配置和最終用戶分類)