


 |
市場調查報告書
商品編碼
2097193
北美水力發電:市場佔有率分析、產業趨勢與統計及成長預測(2026-2031 年)North America Hydropower - Market Share Analysis, Industry Trends & Statistics, Growth Forecasts (2026 - 2031) |
||||||

※ 本網頁內容可能與最新版本有所差異。詳細情況請與我們聯繫。
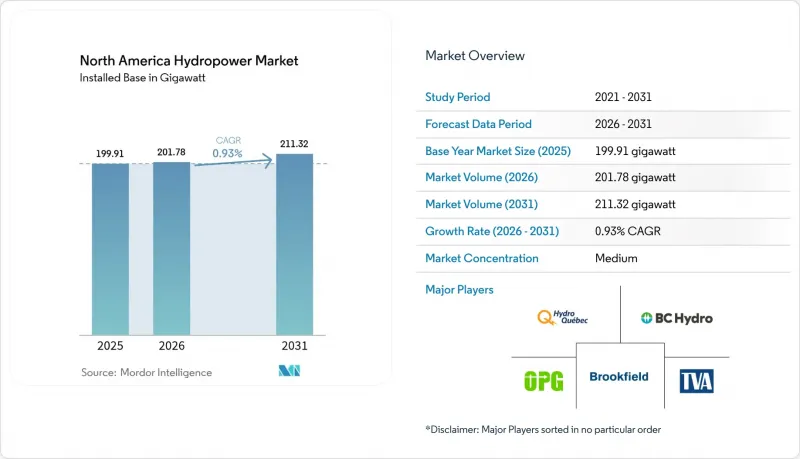
據 Mordor Intelligence 稱,2025 年北美水力發電市場價值為 199.91 吉瓦,預計到 2031 年將達到 211.32 吉瓦,而 2026 年為 201.78 吉瓦,預測期(2026-2031 年)的複合年成長率為 0.93%。
本報告按容量(大型、中型、小規模和微型水力發電)、技術(水庫式、徑流式、抽水蓄能式、河流式和微型管道式)、最終用戶(公共產業、獨立發電企業、工業用戶和私人用戶)以及地區(美國、加拿大和墨西哥)進行細分。市場規模和預測均以總容量(吉瓦)為基礎。
北美水力發電市場的趨勢與洞察
透過美國BIL和IRA獎勵進行現代化融資
聯邦法律將於2024年撥款4.3億美元專門用於水力發電設施的維修,合格的機械和數位升級可享有30%的投資稅額扣抵。業主正將原本用於新建大壩的資本投資轉向高效轉輪、發電機繞組更換以及大壩安全維修,將使用壽命延長30年。該法律中包含的國內採購要求鼓勵了本地渦輪機製造,並降低了供應鏈對海外供應商的依賴。這些規定也導致零件價格上漲,迫使電力業者透過複雜的性能分析來提高專案層面的盈利。因此,這筆資金正在支撐北美水力發電市場的短期成長勢頭,尤其是在支撐區域電網可靠性的現有多用途發電廠方面。
從加拿大向美國進口清潔電力的合約
目前,長期購電協議透過新英格蘭清潔能源連接輸電線路向麻薩諸塞州輸送1,200兆瓦魁北克水力發電,確保未來20年穩定的現金流。加拿大北部季節性電力盈餘與新英格蘭冬季用電高峰完美匹配,無需在美國境內新建水庫即可提升電網供給能力。這些協議為在魁北克上游流域建設更多水力發電發電工程提供了依據,同時顯著減少了新英格蘭地區石化燃料發電的尖峰響應運作。此外,這些協議還支持對輸電走廊的雙邊投資,深化了北美水力發電市場的洲際交易。
聯邦能源管理委員會(FERC)長達數年的許可核准流程和訴訟風險
2024年,聯邦政府對新計畫的等待核可為7.2年,但40%的申請面臨法律挑戰,導致核准時間延長2-3年。這種不確定性導致建設期間利息成本上升,並使投資者的回報預測變得更加複雜。抽水蓄能電站提案受到的影響尤其嚴重,因為環境評估必須同時考慮水資源再利用和場地改造。因此,開發商正將重心轉向現有設施的維修,他們對擴大發電容量的熱情也從北美水力發電市場的待開發區項目轉向了其他領域。
細分市場分析
到2025年,裝置容量超過100兆瓦的發電廠將佔北美總發電量的絕大部分,佔據北美水力發電市場佔有率的85.60%。這些電廠受惠於聯邦政府的現代化改造資金,因為即使效率提高1個百分點,也能帶來吉瓦時級的收益。變速轉輪、發電機重繞和數位孿生技術的結合,使得在不擴建水庫的情況下增加年發電量成為可能,同時還能滿足嚴格的環保標準。裝置容量在10至100兆瓦之間的中型電廠確保了所在區域的電力可靠性,並且通常與優先考慮全天候基本負載的工業用電企業配套使用。容量、能源和輔助服務帶來的收入累積支撐了維修的經濟效益,從而實現了穩定成長。
10兆瓦以下的小規模和超小規模電廠預計將成為成長的主要驅動力,預計到2031年將以3.28%的複合年成長率成長,這得益於聯邦能源監管委員會(FERC)的快速核准和各州層級的上網電價補貼政策。對不具備發電能力的堤防進行改造,使得「即時開工」的場地具備了完整的土木工程,從而顯著縮短了投資回收期。國產模組化設備包的平均效率目前已達到92%,足以媲美大型機組的性能。地方電力合作社和地方政府電力公司正在採用這些分散式電廠,以應對電網擁塞和野火造成的停電。這種分散化趨勢正推動北美水力發電市場向更多元化的資產組合轉型,降低整個電網出現單點故障的風險。
其他好處:
- Excel格式的市場預測(ME)表
- 3個月的分析師支持
目錄
第1章:引言
- 研究假設和市場定義
- 調查範圍
第2章:調查方法
第3章執行摘要
第4章 市場狀況
- 市場概覽
- 市場促進因素
- 利用美國BIL和IRA的獎勵進行現代化建設的資金。
- 從加拿大向美國進口清潔電力的合約
- 為調節風能和太陽能發電的擴張,發電廠熱能(PSH)大幅增加。
- 數位孿生維修提高了工廠效率。
- 非發電大壩的維修管道可釋放超過 10 吉瓦的發電量。
- 在西部地區開展大型企劃
- 市場限制因素
- 聯邦能源監管委員會的多年許可計劃和訴訟風險
- 老化的社會基礎設施(超過50年)
- 部落和漁業社區之間因用水權而產生的衝突
- 300兆瓦以上大型風力渦輪機的供應鏈面臨壓力
- 供應鏈分析
- 監理情勢
- 技術展望
- 波特五力模型
第5章 市場規模與成長預測
- 按產能
- 大型水力發電(100兆瓦或以上)
- 中型水力發電(10-100兆瓦)
- 小規模和超小規模水力發電(小於10兆瓦)
- 透過技術
- 水庫類型
- 流入型
- 水泵型
- 水內盆地和微管道
- 依成分(僅限定性分析)
- 渦輪
- 發電機
- 控制與自動化
- 工廠周邊設備
- 最終用戶
- 公共產業(國有和公有)
- 獨立發電機
- 工業和專屬式
- 國家
- 美國
- 加拿大
- 墨西哥
第6章 競爭情勢
- 市場集中度
- 策略趨勢(併購、聯盟、購電協議)
- 市場佔有率分析(主要公司的市場排名和佔有率)
- 公司簡介
- Hydro-Quebec
- Ontario Power Generation
- Tennessee Valley Authority
- BC Hydro
- Duke Energy
- Brookfield Renewable Partners
- Andritz AG
- GE Vernova(ex-GE Renewable Energy)
- Voith Hydro
- Toshiba Energy Systems
- SNC-Lavalin/AtkinsRealis
- Alstom Hydro Canada
- FirstLight Power
- Innergex Renewable Energy
- Pattern Energy
- Georgia Power
- Absaroka Energy
- American Municipal Power
- Voith Siemens Hydro Canada
- Mavel Americas
第7章 市場機會與未來展望
According to Mordor Intelligence, the North America hydropower market size was valued at 199.91 gigawatt in 2025 and estimated to grow from 201.78 gigawatt in 2026 to reach 211.32 gigawatt by 2031, at a CAGR of 0.93% during the forecast period (2026-2031).
This report is Segmented by Capacity (Large Hydro, Medium Hydro, and Small and Micro Hydro), Technology (Reservoir-Based, Run-Of-River, Pumped-Storage, and In-Stream and Micro-Conduit), End-User (Utilities, Independent Power Producers, and Industrial and Captive), and Geography (United States, Canada, and Mexico). The Market Size and Forecasts are Provided in Terms of Installed Capacity (GW).
North America Hydropower Market Trends and Insights
Modernization Funding via U.S. BIL & IRA Incentives
Federal law released USD 430 million in 2024 strictly for hydro refurbishments, with 30% investment tax credits covering qualified mechanical and digital upgrades. Owners are redirecting capex from new dams to higher-efficiency runners, generator rewinds, and dam-safety retrofits that extend useful life by 30 years. Domestic-content provisions embedded in the legislation spur local turbine manufacturing, reducing supply-chain exposure to overseas vendors. These rules also raise component prices, requiring utilities to sharpen project-level returns through advanced performance analytics. The funding pipeline, therefore, underwrites the near-term momentum of the North America hydropower market, especially at legacy multipurpose sites that anchor regional grid reliability.
Canada-to-U.S. Clean-Power Import Contracts
Long-term power purchase agreements now funnel 1,200 MW of Quebec hydro to Massachusetts via the New England Clean Energy Connect line, locking in 20 years of predictable cash flows. Seasonal flow surpluses north of the border dovetail with winter demand peaks in New England, enhancing grid adequacy without additional U.S. reservoir buildout. The contracts justify further upstream watershed projects in Quebec while slashing fossil peaker dispatch in New England. They also underpin bilateral investments in transmission corridors that strengthen continental trading depth across the North America hydropower market.
Multi-Year FERC Licensing Timelines & Litigation Risk
New projects averaged 7.2 years in the federal queue during 2024, while 40% of filings faced court challenges that stretched approvals by another two to three years. The uncertainty inflates interest during construction costs and complicates revenue modeling for investors. Pumped-storage proposals are disproportionately affected because environmental assessments must address both water reuse and site alterations. Developers therefore pivot toward brownfield upgrades, diverting fresh megawatt ambitions away from the North America hydropower market's greenfield space.
Other drivers and restraints analyzed in the detailed report include:
- PSH Surge to Balance Growing Wind & Solar
- Digital-Twin Retrofits Lifting Plant Efficiency
- Aging Civil Infrastructure Above 50 Years
For complete list of drivers and restraints, kindly check the Table Of Contents.
Segment Analysis
Installations above 100 MW delivered the bulk of continental output and captured 85.60% of the North America hydropower market share in 2025. These assets benefit most from federal modernization dollars, as one percentage-point efficiency gain yields gigawatt-hour scale dividends. Variable-speed runners, generator rewinds, and digital twins combine to lift annual energy production without reservoir expansion, aligning with stringent environmental norms. Medium plants between 10-100 MW provide sub-regional reliability, often tied to industrial off-takers that value 24/7 baseload. Revenue stacking from capacity, energy, and ancillary services buttresses refurbishment economics, anchoring their steady, although slower, growth trajectory.
Small and micro facilities below 10 MW headline the growth narrative at a 3.28% CAGR to 2031, aided by expedited FERC review and state-level feed-in tariffs. Conversions of non-powered dams supply shovel-ready sites complete with civil works, slashing payback periods. Modular equipment packages manufactured domestically now reach 92% average efficiency, rivaling larger units. Rural cooperatives and municipal utilities adopt these distributed plants to hedge against transmission congestion and wildfire-related outages. Such decentralization pushes the North America hydropower market toward a more diversified asset mix, mitigating single-point failure risks across the grid.
Complete Report Scope:
- By Capacity
- Large Hydro (Above 100 MW)
- Medium Hydro (10 to 100 MW)
- Small and Micro Hydro (Below 10 MW)
- By Technology
- Reservoir-Based
- Run-of-River
- Pumped-Storage
- In-Stream and Micro-conduit
- By Component (Qualitative Analysis only)
- Turbines
- Generators
- Control and Automation
- Balance-of-Plant
- By End-User
- Utilities (State and Public)
- Independent Power Producers
- Industrial and Captive
- By Country
- United States
- Canada
- Mexico
List of Companies Covered in this Report:
- Hydro-Quebec
- Ontario Power Generation
- Tennessee Valley Authority
- BC Hydro
- Duke Energy
- Brookfield Renewable Partners
- Andritz AG
- GE Vernova (ex-GE Renewable Energy)
- Voith Hydro
- Toshiba Energy Systems
- SNC-Lavalin / AtkinsRealis
- Alstom Hydro Canada
- FirstLight Power
- Innergex Renewable Energy
- Pattern Energy
- Georgia Power
- Absaroka Energy
- American Municipal Power
- Voith Siemens Hydro Canada
- Mavel Americas
Additional Benefits:
- The market estimate (ME) sheet in Excel format
- 3 months of analyst support
TABLE OF CONTENTS
1 Introduction
- 1.1 Study Assumptions & Market Definition
- 1.2 Scope of the Study
2 Research Methodology
3 Executive Summary
4 Market Landscape
- 4.1 Market Overview
- 4.2 Market Drivers
- 4.2.1 Modernization funding via U.S. BIL & IRA incentives
- 4.2.2 Canada-to-U.S. clean-power import contracts
- 4.2.3 PSH surge to balance growing wind & solar
- 4.2.4 Digital twin retrofits lifting plant efficiency
- 4.2.5 Non-powered-dam retrofit pipeline unlocking >10 GW
- 4.2.6 Western drought resiliency megaproject spending
- 4.3 Market Restraints
- 4.3.1 Multi-year FERC licensing timelines & litigation risk
- 4.3.2 Aging civil infrastructure >50 yrs
- 4.3.3 Competing tribal & fisheries water-rights claims
- 4.3.4 Supply-chain crunch for large turbines >300 MW
- 4.4 Supply-Chain Analysis
- 4.5 Regulatory Landscape
- 4.6 Technological Outlook
- 4.7 Porter's Five Forces
- 4.7.1 Bargaining Power of Suppliers
- 4.7.2 Bargaining Power of Consumers
- 4.7.3 Threat of New Entrants
- 4.7.4 Threat of Substitutes
- 4.7.5 Competitive Rivalry
5 Market Size & Growth Forecasts
- 5.1 By Capacity
- 5.1.1 Large Hydro (Above 100 MW)
- 5.1.2 Medium Hydro (10 to 100 MW)
- 5.1.3 Small and Micro Hydro (Below 10 MW)
- 5.2 By Technology
- 5.2.1 Reservoir-Based
- 5.2.2 Run-of-River
- 5.2.3 Pumped-Storage
- 5.2.4 In-Stream and Micro-conduit
- 5.3 By Component (Qualitative Analysis only)
- 5.3.1 Turbines
- 5.3.2 Generators
- 5.3.3 Control and Automation
- 5.3.4 Balance-of-Plant
- 5.4 By End-User
- 5.4.1 Utilities (State and Public)
- 5.4.2 Independent Power Producers
- 5.4.3 Industrial and Captive
- 5.5 By Country
- 5.5.1 United States
- 5.5.2 Canada
- 5.5.3 Mexico
6 Competitive Landscape
- 6.1 Market Concentration
- 6.2 Strategic Moves (M&A, Partnerships, PPAs)
- 6.3 Market Share Analysis (Market Rank/Share for key companies)
- 6.4 Company Profiles (includes Global level Overview, Market level overview, Core Segments, Financials as available, Strategic Information, Products & Services, and Recent Developments)
- 6.4.1 Hydro-Quebec
- 6.4.2 Ontario Power Generation
- 6.4.3 Tennessee Valley Authority
- 6.4.4 BC Hydro
- 6.4.5 Duke Energy
- 6.4.6 Brookfield Renewable Partners
- 6.4.7 Andritz AG
- 6.4.8 GE Vernova (ex-GE Renewable Energy)
- 6.4.9 Voith Hydro
- 6.4.10 Toshiba Energy Systems
- 6.4.11 SNC-Lavalin / AtkinsRealis
- 6.4.12 Alstom Hydro Canada
- 6.4.13 FirstLight Power
- 6.4.14 Innergex Renewable Energy
- 6.4.15 Pattern Energy
- 6.4.16 Georgia Power
- 6.4.17 Absaroka Energy
- 6.4.18 American Municipal Power
- 6.4.19 Voith Siemens Hydro Canada
- 6.4.20 Mavel Americas
7 Market Opportunities & Future Outlook
- 7.1 White-Space & Unmet-Need Assessment

 水力發電廠狀態監測解決方案市場:全球市場預測,2026-2032年
 全球水力發電廠維修市場規模、佔有率、趨勢及成長分析報告(2026-2034)
 美國水力發電:市場佔有率分析、行業趨勢和統計數據以及成長預測(2026-2031 年)水力發電市場-2026-2032年全球市場預測
 水力發電市場:2034 年預測 - 全球電廠類型、裝置容量、組件、渦輪機類型、應用、所有權、最終用戶、技術、服務和區域分析
 2026 年至 2035 年水力發電廠維修的市場機會、成長動力、產業趨勢與預測。水力發電:市場佔有率分析、行業趨勢和統計數據、成長預測(2026-2031 年)
 水力發電市場規模、佔有率、趨勢和預測:按規模、應用和地區分類,2026-2034年水力發電控制系統市場:按產品類型、渦輪機類型、電壓等級、應用和最終用戶分類-2026-2032年全球市場預測水力發電閘門市場:2026-2032年全球市場預測(以閘門類型、閘門操作方式、材質、安裝配置和最終用戶分類)