


 |
市場調查報告書
商品編碼
2100246
網站開發:市場佔有率分析、產業趨勢與統計、成長預測(2026-2031)Web Development - Market Share Analysis, Industry Trends & Statistics, Growth Forecasts (2026 - 2031) |
||||||

※ 本網頁內容可能與最新版本有所差異。詳細情況請與我們聯繫。
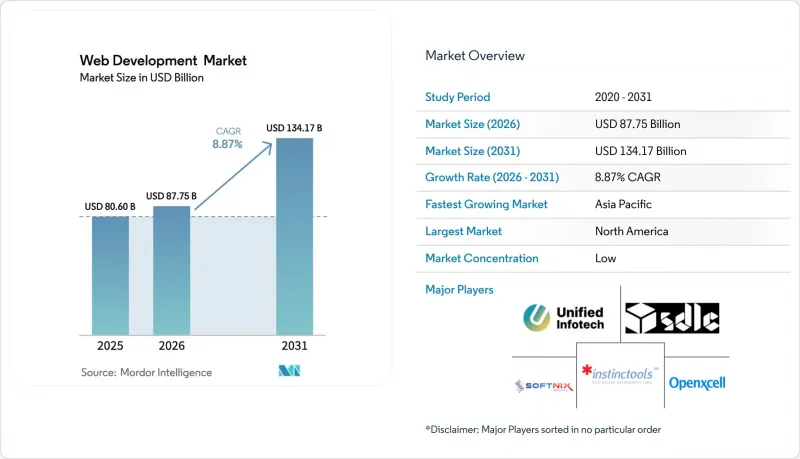
據 Mordor Intelligence 稱,2025 年網路開發服務市值為 806 億美元,預計到 2031 年將達到 1341.7 億美元,而 2026 年為 877.5 億美元,預測期(2026-2031 年)的複合年成長率為 8.87%。
本報告按類型(網站、Web應用程式等)、公司規模(中小企業、大型企業)、最終用戶產業(零售/電子商務、IT/電信等)、技術堆疊(無頭CMS/可組合式、API優先、無伺服器等)、部署模式(雲端、本地部署、混合部署)和地區進行細分。市場預測以美元計價。
全球網站開發市場趨勢與洞察
電子商務和全通路的快速成長
2024 年旺季期間的一次服務中斷導致單日數百萬美元的銷售額損失,零售商們如今不再僅僅將網站可靠性視為維護問題,而是將其視為成長的驅動力。領先的零售商正在採用「可組合商務」模式,這種模式允許他們在不中斷核心結帳流程的情況下替換搜尋、購物車和支付等單一服務,從而將發布週期從數週縮短至數天。零售業的案例研究表明,精心設計的漸進式 Web 應用 (PWA) 可以將行動端轉換率提高四倍,這也印證了決策者為何將 Web 開發視為直接的收入來源。由於訂單、會員和履約資料都透過單一平台傳輸,平台擴充性已成為經營團隊的關鍵指標,這進一步推動了對 Web 開發服務市場的需求。
企業數位轉型預算
儘管可自由支配的IT支出受到限制,但由於確保客戶體驗與原生數位競爭對手保持一致這一緊迫的經營團隊挑戰,與網路相關的預算仍在維持。全球系統整合商正在簽訂多年期管理服務契約,將人工智慧、資料架構和設計能力整合到單一協議中,確保可預測的收入來源。典型的財富500強客戶現在將兩位數百分比的技術預算分配給與網路相關的項目,尋求雲端重構和以隱私為中心的架構方面的專業知識。這些優先事項支撐了網路開發服務市場的高價位。
跨瀏覽器/裝置碎片化
不同瀏覽器間 CSS 和 JavaScript 行為的不一致會延長品質保證 (QA) 週期,並需要使用 polyfill(替代實作)。這會增加有效負載大小並推高託管成本。 Safari 和 Internet Explorer 中會出現佈局問題,需要使用條件式樣式表,這對沒有自動化測試環境的團隊來說是一個沉重的負擔。在行動領域,由於螢幕大小和晶片組種類繁多,效能調優的複雜性加劇了這種碎片化問題。中小企業受到的影響尤其嚴重,因為它們無法承受額外的工作時間,這阻礙了它們採用 Web 開發服務。
細分市場分析
由於成熟的企業工作流程依賴強大的伺服器端渲染技術,預計到2025年,傳統網路應用程式仍將佔據57.35%的收入佔有率。這一主導地位體現在基準年462億美元的Web開發服務市場規模。同時,漸進式Web應用程式(PWA)正以13.45%的複合年成長率快速成長,預計將迅速縮小與傳統Web應用程式的差距。 PWA無需單獨建置原生應用,從而降低了整體擁有成本(TCO),同時還提供推播通知和離線快取等功能,以增強用戶參與度。零售和旅遊業的早期採用者報告稱,由於客戶無需重新安裝應用程式即可恢復會話,因此跳出率更低。另一方面,低程式碼網站建立器繼續吸引尋求宣傳冊式頁面的微企業,但它們很少能滿足企業級安全性、合規性或跨區域流量的需求。
PWA(漸進式網頁應用程式)的成功案例引起了經營團隊的極大關注。品牌商在將網站遷移到支援Service Worker的架構後,實現了兩位數的營收成長。技術供應商現在將承包PWA加速器與無頭CMS許可證捆綁銷售,將部署時間從數月縮短至數週。因此,專業服務合作夥伴正在推出「PWA一體化」服務,承諾可預測的預算和結果,進一步推動了Web開發服務市場的繁榮。
大型企業將其全球部署外包,這些部署涵蓋數百個微型網站和本地化門戶,預計到 2025 年將佔總收入的 62.40%,並在 Web 開發服務市場佔據 503 億美元的佔有率。他們還需要多層安全評估、內容管治和多重雲端彈性,而這些需求最好由一級整合商來滿足。同時,中小企業 (SME) 的成長速度更快,年複合成長率 (CAGR) 達到 10.85%,這主要得益於 SaaS 工具包(可將前期成本降低三分之一)和計量收費模式。中小企業正在專注於無伺服器後端,這種後端無需伺服器補丁,並且受益於基於使用量的收費系統,使他們能夠將有限的資金分配到行銷中。
低成本的實驗加劇了市場競爭。即使是只有 20 名員工的零售商,也可以透過 API 授權預訓練模型,在幾週內推出人工智慧驅動的聊天訂購功能。服務於此領域的供應商提供標準化的範本庫和託管服務包,在無需承擔大型企業高昂成本的情況下,即可實現企業級運轉率。這些趨勢確保了網路開發服務市場中各種規模客戶的均衡成長。
區域分析
到2025年,北美將佔全球收入的39.40%。這主要得益於老字型大小企業積極推動現代化項目,並獲得了超超大規模資料中心業者雲端服務供應商提供的慷慨雲端額度支援。客戶重視當地清晰的監管環境和豐富的人才儲備,這使得他們能夠快速試驗人工智慧即服務(AaaS)產品。光是在美國,就簽署了多份價值數億美元的契約,客戶將傳統門戶網站的平台遷移委託給單一服務合作夥伴,由其大規模管理雲端成本、安全性和DevSecOps。加拿大積極的移民政策也與此趨勢相輔相成,吸引高技能開發人員前往當地交付中心,從而增強了網路開發服務市場的供應。
亞太地區是所有地區中成長最快的,複合年成長率高達17.05%。印度是這一成長的主要驅動力,這得益於數十億美元的資料中心投資,這些投資使機架容量加倍,並降低了國內流量延遲。印度建構的數位公共基礎設施(DPI)API的興起,使得支付、身份驗證和文件儲存的實施更加便捷,降低了新創企業的進入門檻。這些公司正在將合規前端的開發外包給外部機構。在中國,政府旨在提高數位經濟佔GDP比重的藍圖,正在釋放以人工智慧為中心的商業平台的公共獎勵,並推動對精通低程式碼、無頭和邊緣渲染架構的供應商的支出。日本的「社會5.0」政策,在人工智慧測試平台補貼計畫的支持下,正在創造對符合無障礙標準的企業入口網站的新需求,並實現收入來源的多元化。在歐洲,受GDPR修訂和一項要求提供包容性使用者體驗的新無障礙指令的推動,預計將保持穩定的中等個位數成長。企業正優先考慮本地託管資料儲存和審計追蹤,這為將主權雲端託管與符合WCAG 3.0標準的承包解決方案相結合的供應商創造了新的機會。在其他地區,拉丁美洲正受到巴西電子商務蓬勃發展的推動,而一些波灣合作理事會(GCC)成員國正在投資建設“智慧城市”,透過網路儀表板整合市民服務。這些區域趨勢共同推動了全球網路開發服務市場的多元化發展。
其他好處:
- Excel格式的市場預測(ME)表
- 3個月的分析師支持
目錄
第1章:引言
- 研究假設和市場定義
- 調查範圍
第2章:調查方法
第3章執行摘要
第4章 市場狀況
- 市場概覽
- 市場促進因素
- 電子商務和全通路的蓬勃發展
- 企業數位轉型預算
- 行動優先策略和 PWA 的普及
- 人工智慧聊天機器人和個人化
- 無頭CMS和可組合架構正在經歷快速成長。
- 無障礙法規(WCAG 3.0)實施截止日期
- 市場限制因素
- 跨瀏覽器/裝置碎片化
- 全球人才短缺與開發成本上升
- 遵守資料隱私法規(GDPR、CPRA)所帶來的負擔
- 永續發展和網路碳審計的壓力
- 監理情勢
- 技術展望
- 波特五力分析
- 宏觀經濟影響評估
- 投資分析
第5章 市場規模與成長預測
- 按類型
- 網站
- Web應用程式
- 漸進式 Web 應用 (PWA)
- 低程式碼/無程式碼網站建立器
- 按公司規模
- 中小企業
- 大公司
- 按最終用戶行業分類
- 零售與電子商務
- BFSI
- 醫療保健和生命科學
- IT/通訊
- 媒體與娛樂
- 政府/公共部門
- 教育
- 旅遊與飯店
- 依技術堆疊
- 前端框架(React、Angular、Vue)
- 後端框架(Node、Django、.NET)
- 無頭CMS/可組合
- API優先和無伺服器架構
- 按部署模式
- 基於雲端的
- 現場
- 混合
- 按地區
- 北美洲
- 美國
- 加拿大
- 墨西哥
- 南美洲
- 巴西
- 阿根廷
- 其他南美國家
- 歐洲
- 德國
- 英國
- 法國
- 西班牙
- 義大利
- 其他歐洲國家
- 亞太地區
- 中國
- 印度
- 日本
- 韓國
- 澳洲
- 其他亞太國家
- 中東
- 以色列
- 沙烏地阿拉伯
- 阿拉伯聯合大公國
- 土耳其
- 其他中東國家
- 非洲
- 南非
- 埃及
- 奈及利亞
- 其他非洲國家
- 北美洲
第6章 競爭情勢
- 市場集中度
- 策略趨勢
- 市佔率分析
- 公司簡介
- Accenture
- Cognizant
- Tata Consultancy Services(TCS)
- IBM
- Infosys
- Capgemini
- Wipro
- EPAM Systems
- ThoughtWorks
- Globant
- Endava
- HCLTech
- SoftServe
- LTI-Mindtree
- Valtech
- Unified Infotech
- SDLC Corporation
- OpenXcell
- Plavno
- KitRUM
- PageTraffic
- 9thCO
- Instinctools GmbH
- Softnix Infotech
第7章 市場機會與未來展望
According to Mordor Intelligence, the web development services market size was valued at USD 80.6 billion in 2025 and estimated to grow from USD 87.75 billion in 2026 to reach USD 134.17 billion by 2031, at a CAGR of 8.87% during the forecast period (2026-2031).
This report is Segmented by Type (Website, Web App and More), Enterprises (SMEs, Large Enterprises), End-User Vertical (Retail and E-Commerce, IT and Telecom and More), Technology Stack(Headless CMS / Composable, API-First and Serverless and More), Deployment Model (Cloud-Based, On-Premise and Hybrid) and Geography. The Market Forecasts are Provided in Terms of Value (USD).
Global Web Development Market Trends and Insights
E-commerce & Omnichannel Boom
Retailers now regard site reliability as a growth lever rather than a maintenance concern after peak-season outages erased millions in one-day revenue losses in 2024. Leading merchants are adopting composable commerce to swap individual services-search, cart, payments-without disrupting the core checkout flow, trimming release cycles from weeks to days. Retail case studies show that well-designed Progressive Web Apps can lift mobile conversion rates fourfold, reinforcing why decision makers view web development as a direct revenue driver. With ordering, loyalty, and fulfillment data flowing through a single stack, platform extensibility becomes a boardroom metric, further raising demand for the web development services market.
Enterprise Digital-Transformation Budgets
C-suite urgency around customer-experience parity with digital-native competitors keeps web budgets intact even when discretionary IT spending tightens. Global systems integrators are winning multi-year managed-services deals that embed AI, data fabric, and design capabilities in one contract, locking in predictable fee streams. The typical Fortune 500 client now allocates double-digit share of its tech budget to web-facing initiatives, seeking expertise in cloud refactoring and privacy-centric architecture. Those priorities sustain premium pricing power inside the web development services market.
Cross-Browser / Device Fragmentation
Inconsistent CSS and JavaScript behavior across browsers extends QA cycles and forces polyfills that bloat payload sizes, driving up hosting bills. Safari and Internet Explorer display layout quirks that require conditional stylesheets, burdensome for teams lacking automated test rigs. Fragmentation escalates on mobile where hundreds of screen sizes and chipset variants complicate performance tuning. SMEs feel the pinch because they cannot absorb added hours, tempering uptake for web development services.
Other drivers and restraints analyzed in the detailed report include:
- Mobile-First & PWA Adoption
- AI-Powered Chatbots & Personalization
- Global Talent Shortage & Rising Developer Costs
For complete list of drivers and restraints, kindly check the Table Of Contents.
Segment Analysis
The segment that groups classic web applications retained 57.35% revenue in 2025 thanks to entrenched enterprise workflows that rely on robust server-rendered stacks. That dominance translated into USD 46.2 billion of the web development services market size in the base year. Progressive Web Apps, however, expanded at 13.45% CAGR and are projected to narrow the gap rapidly. PWAs lower total cost of ownership by eliminating separate native builds while delivering push notifications and offline caching that heighten engagement. Early adopters within retail and travel note that bounce rates fall when customers can resume sessions without reinstalling apps. In parallel, low-code site builders keep attracting micro-enterprises seeking brochure-style pages, yet they rarely satisfy security, compliance, or multi-region traffic needs at the enterprise tier.
PWA success stories resonate across boardrooms: brands report double-digit revenue lifts after converting sites to service-worker-enabled architectures. Technology vendors are now bundling turnkey PWA accelerators with headless CMS licenses, compressing deployment from months to weeks. As a result, professional-services partners are packaging "PWA in a box" offerings that promise predictable budgets and outcomes, adding fuel to the web development services market.
Large corporations commanded 62.40% of 2025 billings, equal to USD 50.3 billion of web development services market share, because they outsource global rollouts that span hundreds of microsites and localized portals. They also require multilayer security assessments, content governance, and multi-cloud resilience-needs best met by tier-one integrators. Yet small and medium enterprises are the faster mover, expanding at 10.85% CAGR on the back of SaaS toolkits and pay-as-you-go cloud that cut initial outlays by a third. SMEs prize serverless back-ends for eliminating server patching and benefiting from usage-linked pricing, freeing scarce capital for marketing spend.
The ability to experiment cheaply levels the playing field: a 20-employee retailer can launch AI-assisted chat ordering capability in weeks by licensing pretrained models through an API. Vendors serving this cohort assemble standardized template libraries and managed-hosting bundles that deliver enterprise-grade uptime without enterprise overhead. These dynamics ensure balanced growth across client sizes within the web development services market.
Complete Report Scope:
- By Type
- Website
- Web Application
- Progressive Web App (PWA)
- Low-/No-Code Site Builder
- By Enterprise Size
- Small and Medium-sized Enterprises (SMEs)
- Large Enterprises
- By End-user Vertical
- Retail and E-commerce
- BFSI
- Healthcare and Life Sciences
- IT and Telecom
- Media and Entertainment
- Government and Public Sector
- Education
- Travel and Hospitality
- By Technology Stack
- Front-end Framework (React, Angular, Vue)
- Back-end Framework (Node, Django, .NET)
- Headless CMS / Composable
- API-first and Serverless
- By Deployment Model
- Cloud-based
- On-premise
- Hybrid
- By Geography
- North America
- United States
- Canada
- Mexico
- South America
- Brazil
- Argentina
- Rest of South America
- Europe
- Germany
- United Kingdom
- France
- Spain
- Italy
- Rest of Europe
- Asia-Pacific
- China
- India
- Japan
- South Korea
- Australia
- Rest of Asia-Pacific
- Middle East
- Israel
- Saudi Arabia
- United Arab Emirates
- Turkey
- Rest of Middle East
- Africa
- South Africa
- Egypt
- Nigeria
- Rest of Africa
- North America
Geography Analysis
North America safeguarded 39.40% of global billings in 2025 as entrenched enterprises pursued aggressive modernization programs underpinned by generous cloud credits from hyperscalers. Clients value local regulatory clarity and broad talent pools, allowing rapid experimentation with AI-as-a-Service offerings. The United States alone saw multiple nine-figure deals where customers outsourced legacy portal re-platforming to a single services partner who manages cloud costs, security, and DevSecOps at scale. Canada's immigration-friendly policies complement that dynamic by channeling high-skill developers into local delivery centers, reinforcing supply for the web development services market.
Asia-Pacific represents the fastest regional climb with a 17.05% CAGR. India anchors growth following multibillion-dollar data-center commitments that double rack capacity and reduce latency for domestic traffic. The rise of India-built Digital Public Infrastructure APIs makes onboarding payments, identity, and document storage straightforward, lowering entry barriers for startups who then contract external agencies to build compliant front-ends. In China, official blueprints to lift the digital-economy share of GDP unlock public incentives for AI-centric commerce platforms, channeling spend toward vendors versed in low-code, headless, and edge-rendered architectures. Japan's national Society 5.0 policy, backed by subsidy programs for AI testbeds, injects fresh demand for accessibility-compliant corporate portals, diversifying addressable revenue. Europe delivers steady mid-single-digit growth on the back of GDPR refinements and new accessibility directives that mandate inclusive user journeys. Enterprises put a premium on host-in-region data stores and audit trails, spawning opportunities for vendors that bundle sovereign-cloud hosting with turnkey WCAG-3.0 remediation. Elsewhere, Latin America benefits from Brazilian e-commerce momentum, while select Gulf Cooperation Council states fund "smart city" rollouts that integrate citizen services via web dashboards. Together these pockets sustain a globally diversified web development services market.
- Accenture
- Cognizant
- Tata Consultancy Services (TCS)
- IBM
- Infosys
- Capgemini
- Wipro
- EPAM Systems
- ThoughtWorks
- Globant
- Endava
- HCLTech
- SoftServe
- LTI-Mindtree
- Valtech
- Unified Infotech
- SDLC Corporation
- OpenXcell
- Plavno
- KitRUM
- PageTraffic
- 9thCO
- Instinctools GmbH
- Softnix Infotech
Additional Benefits:
- The market estimate (ME) sheet in Excel format
- 3 months of analyst support
TABLE OF CONTENTS
1 INTRODUCTION
- 1.1 Study Assumptions and Market Definition
- 1.2 Scope of the Study
2 RESEARCH METHODOLOGY
3 EXECUTIVE SUMMARY
4 MARKET LANDSCAPE
- 4.1 Market Overview
- 4.2 Market Drivers
- 4.2.1 E-commerce and omnichannel boom
- 4.2.2 Enterprise digital-transformation budgets
- 4.2.3 Mobile-first and PWA adoption
- 4.2.4 AI-powered chatbots and personalization
- 4.2.5 Headless CMS and composable architecture surge
- 4.2.6 Accessibility regulation (WCAG 3.0) deadlines
- 4.3 Market Restraints
- 4.3.1 Cross-browser/device fragmentation
- 4.3.2 Global talent shortage and rising developer costs
- 4.3.3 Data-privacy compliance overhead (GDPR, CPRA)
- 4.3.4 Sustainability pressure and web-carbon audits
- 4.4 Regulatory Landscape
- 4.5 Technological Outlook
- 4.6 Porter's Five Forces Analysis
- 4.6.1 Bargaining Power of Suppliers
- 4.6.2 Bargaining Power of Consumers
- 4.6.3 Threat of New Entrants
- 4.6.4 Threat of Substitutes
- 4.6.5 Intensity of Rivalry
- 4.7 Macroeconomic Impact Assessment
- 4.8 Investment Analysis
5 MARKET SIZE AND GROWTH FORECASTS (VALUE)
- 5.1 By Type
- 5.1.1 Website
- 5.1.2 Web Application
- 5.1.3 Progressive Web App (PWA)
- 5.1.4 Low-/No-Code Site Builder
- 5.2 By Enterprise Size
- 5.2.1 Small and Medium-sized Enterprises (SMEs)
- 5.2.2 Large Enterprises
- 5.3 By End-user Vertical
- 5.3.1 Retail and E-commerce
- 5.3.2 BFSI
- 5.3.3 Healthcare and Life Sciences
- 5.3.4 IT and Telecom
- 5.3.5 Media and Entertainment
- 5.3.6 Government and Public Sector
- 5.3.7 Education
- 5.3.8 Travel and Hospitality
- 5.4 By Technology Stack
- 5.4.1 Front-end Framework (React, Angular, Vue)
- 5.4.2 Back-end Framework (Node, Django, .NET)
- 5.4.3 Headless CMS / Composable
- 5.4.4 API-first and Serverless
- 5.5 By Deployment Model
- 5.5.1 Cloud-based
- 5.5.2 On-premise
- 5.5.3 Hybrid
- 5.6 By Geography
- 5.6.1 North America
- 5.6.1.1 United States
- 5.6.1.2 Canada
- 5.6.1.3 Mexico
- 5.6.2 South America
- 5.6.2.1 Brazil
- 5.6.2.2 Argentina
- 5.6.2.3 Rest of South America
- 5.6.3 Europe
- 5.6.3.1 Germany
- 5.6.3.2 United Kingdom
- 5.6.3.3 France
- 5.6.3.4 Spain
- 5.6.3.5 Italy
- 5.6.3.6 Rest of Europe
- 5.6.4 Asia-Pacific
- 5.6.4.1 China
- 5.6.4.2 India
- 5.6.4.3 Japan
- 5.6.4.4 South Korea
- 5.6.4.5 Australia
- 5.6.4.6 Rest of Asia-Pacific
- 5.6.5 Middle East
- 5.6.5.1 Israel
- 5.6.5.2 Saudi Arabia
- 5.6.5.3 United Arab Emirates
- 5.6.5.4 Turkey
- 5.6.5.5 Rest of Middle East
- 5.6.6 Africa
- 5.6.6.1 South Africa
- 5.6.6.2 Egypt
- 5.6.6.3 Nigeria
- 5.6.6.4 Rest of Africa
- 5.6.1 North America
6 COMPETITIVE LANDSCAPE
- 6.1 Market Concentration
- 6.2 Strategic Moves
- 6.3 Market Share Analysis
- 6.4 Company Profiles (includes Global level Overview, Market level overview, Core Segments, Financials as available, Strategic Information, Market Rank/Share for key companies, Products and Services, and Recent Developments)
- 6.4.1 Accenture
- 6.4.2 Cognizant
- 6.4.3 Tata Consultancy Services (TCS)
- 6.4.4 IBM
- 6.4.5 Infosys
- 6.4.6 Capgemini
- 6.4.7 Wipro
- 6.4.8 EPAM Systems
- 6.4.9 ThoughtWorks
- 6.4.10 Globant
- 6.4.11 Endava
- 6.4.12 HCLTech
- 6.4.13 SoftServe
- 6.4.14 LTI-Mindtree
- 6.4.15 Valtech
- 6.4.16 Unified Infotech
- 6.4.17 SDLC Corporation
- 6.4.18 OpenXcell
- 6.4.19 Plavno
- 6.4.20 KitRUM
- 6.4.21 PageTraffic
- 6.4.22 9thCO
- 6.4.23 Instinctools GmbH
- 6.4.24 Softnix Infotech
7 MARKET OPPORTUNITIES AND FUTURE OUTLOOK
- 7.1 White-space and Unmet-Need Assessment

 硬體防火牆:市場佔有率分析、產業趨勢與統計、成長預測(2026-2031)新一代防火牆:市場佔有率分析、產業趨勢與統計及成長預測(2026-2031 年)
 企業網路防火牆市場:2026-2032年全球市場預測(依組件、防火牆技術、吞吐量頻寬、企業規模、部署類型、用例和產業分類)
 新一代防火牆市場規模、佔有率和成長分析:按產品、部署類型、企業規模、最終用戶產業和地區分類-2026-2033年產業預測
 新一代防火牆市場報告:按類型、部署模式、安全類型、組織規模、產業和地區分類(2026-2034 年)網域名稱系統防火牆:市場佔有率分析、產業趨勢與統計、成長預測(2026-2031)
 域名系統(DNS)防火牆全球市場規模、佔有率、趨勢和成長分析報告(2026-2034)
 2026年全球網站開發市場報告
 全球新一代防火牆市場:按組件、部署方式、企業規模、產業和地區分類新一代防火牆市場:按組件、部署模式、功能、組織規模、產業和銷售管道分類-2026-2032年全球市場預測