


 |
市場調查報告書
商品編碼
2099485
美國汽車塗料物流:市場佔有率分析、產業趨勢與統計、成長預測(2026-2031)United States Finished Vehicle Logistics - Market Share Analysis, Industry Trends & Statistics, Growth Forecasts (2026 - 2031) |
||||||

※ 本網頁內容可能與最新版本有所差異。詳細情況請與我們聯繫。
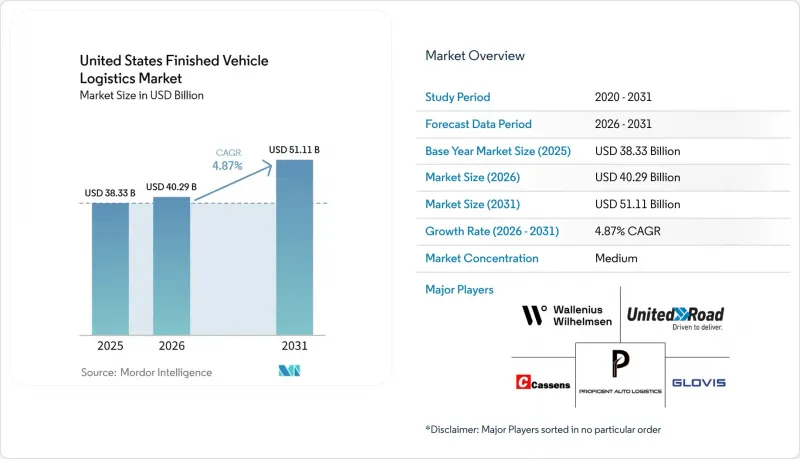
據 Mordor Intelligence 稱,2025 年美國成品車物流市場價值為 383.3 億美元,預計到 2031 年將從 2026 年的 402.9 億美元成長至 511.1 億美元,預測期(2026-2031 年)複合年成長率為 4.87%。
生產本地化正在重塑美國成品車物流市場的路線設計。這是因為國內製造地的擴張減少了與進口相關的長途運輸,同時區域交付週期和經銷商交付頻率有所提高。本報告按物流功能(運輸、倉儲和配送、附加價值服務)、目的地(國內、國際)、車輛類型(乘用車、商用車、非公路用車)、最終用戶業(原始設備製造商、經銷商、其他)和地區(東北部、東南部、中西部、西南部、西部)進行細分。市場預測以美元計價。
美國成品車物流市場趨勢與洞察
成品車運輸的在地化和近岸化程度降低,正在重塑國內運輸路線的密度。
關稅風險和原產地計劃正在改變整個美國整車物流市場的物流流格局。這是因為採購決策如今不僅影響工廠的經濟效益,還會影響運輸路線的密度、物流樞紐的使用率,甚至影響國內和跨國車輛運輸之間的平衡。貝克研究所指出,到2024年,汽車及零件產業將佔北美貿易總額的近四分之一,這表明即使是輕微的生產轉移也會改變車輛在多個物流樞紐間的流動。隨著國內生產比例的增加,港口相關和長途入境運輸量將有所下降,而組裝廠、鐵路貨場、加工中心和經銷商之間的短週期交付量將會增加。這種變化將導致更頻繁的停靠和更大的調度難度,尤其是在物流基礎設施尚未達到傳統汽車產業區域水平的新興製造走廊。在美國整車物流市場,擁有覆蓋全國範圍和靈活車輛部署能力的營運商處於有利地位,能夠在不犧牲服務品質的前提下,抓住重新分配的國內運輸量。另一方面,如果 OEM 採購優先順序的變化速度快於資產配置計劃,那麼嚴重依賴固定跨境運輸模式的承運商更容易受到路線層面風險的影響。
電氣化以及對電池安全處理的要求,正在增加基礎設施的複雜性。
隨著電動車的運輸作業與傳統內燃機平台不同,電氣化為美國成品車物流市場帶來了更嚴格的合規性和設施要求。 2026年2月,《聯邦公報》提案為鋰離子電池、鋰金屬電池和鈉離子電池車輛分別制定聯合國編號,正式建立更詳細的電池動力運輸法律規範。該框架要求車輛在離開發地或進入多模態之前,必須具備精確的文件記錄、標準化的分類和更嚴格的儲存程序。車輛處理中心現在需要更完善的程序來驗證充電狀態、管理停留時間,並做好應對處理或等待期間電池相關問題的準備。 AIAG的成品車物流指南繼續作為原始設備製造商(OEM)、道路運輸運輸公司、鐵路公司和航運公司之間進行檢查和報告的通用標準,隨著電動車處理量的成長,流程規範變得愈發重要。因此,已經投資於合規處理程序和電動汽車相容設施的供應商能夠獲得與這些車輛流相關的高附加價值服務的更大佔有率。
司機短缺和專業運輸公司運力有限,導致供應緊張。
在美國成品車物流市場,專業地面運輸能力仍是阻礙因素。這是因為成品車運輸所需的技能比一般卡車司機更為專業。汽車運輸司機必須嚴格遵守多層裝載程序,防止裝卸過程中車輛受損,熟知經銷商的交付路線,並遵守因不同汽車製造商 (OEM) 項目而異的操作標準。因此,即使普通貨運招聘情況似乎有所改善,但由於新司機需要接受在職培訓才能安全地分配到關鍵且利潤豐厚的汽車運輸路線,因此新司機的招聘速度仍然緩慢。當運輸能力緊張時,承運商往往會優先選擇盈利更高的運輸路線,從而導致訂單被拒絕、等待時間延長以及低優先級路線的服務品質不穩定等問題。當產量激增、區域庫存緊張或經銷商補貨計畫緊張時,這種影響尤其顯著。在美國成品車物流市場,如果需求成長超過了培訓和新司機入職的速度,這些因素將永久限制道路運輸能力的反應速度。
細分市場分析
到2025年,運輸業將占美國成品車物流市場的75.00%,其中道路運輸在從鐵路貨場和港口到經銷商的最後一段運輸中仍發揮著至關重要的作用。這是因為在這最終交付階段,調度準確性和防損措施將受到最直接的考驗。雖然鐵路運輸在新車運輸量方面仍然佔據很大佔有率,但卡車運輸在創收方面仍然扮演著核心角色,與道路運輸協同運作,因為交付給經銷商、在堆場進行轉運以及對時間要求嚴格的運輸,其價格與長途幹線運輸的價格是分開計算的。這種結構意味著,美國成品車物流市場仍然依賴公路和鐵路的協調,而不是單一的主要運輸方式,尤其是在抵達港口、在堆場進行處理以及交付給經銷商的時間無法完全匹配的情況下。多模態至關重要,因為鐵路或卡車運輸的任何延誤都可能擾亂車輛進入零售或車隊通路的庫存安排。能夠與鐵路網路、綜合設施的集散中心以及向經銷商的交貨時間表進行更緊密協調的供應商,即使運輸路線模式不斷變化,也能更好地保持運轉率和服務的一致性。
預計2026年至2031年間,倉儲和配送業將以6.62%的複合年成長率成長。隨著加工和分類要求日益嚴格,該行業有望在美國成品車物流市場的整體價值創造中發揮更重要的作用。與電動車相關的準備工作是主要驅動力,因為在車輛進入下一運輸階段之前,場地對充電能力、電池狀態檢查、受控存放程序以及符合法規的裝運前檢查的需求不斷成長。 2026年5月,健高集團宣佈在美國134個地點的倉儲面積年增24.7%,達到4,590萬平方英尺。這表明,對高品質物流空間的需求遠遠超出了傳統汽車相關設施的有限範圍。附加價值服務也日益受到關注,因為配件安裝、高階處理、檢驗支援以及高價值車輛的專業運輸比簡單的干線運輸具有更高的單位盈利。 2025年3月,ACERTUS收購了Bluestar Auto Movers,正式進軍豪華車運輸領域。這表明,其提供的服務範圍正成為其在高利潤物流細分市場的競爭優勢。
2025年,美國成品車物流市場中,國內運輸佔比高達76.11%,其目的地模式仍以工廠到倉儲設施以及倉儲設施到經銷商為核心,並遵循國內運輸和配送框架。這反映了美國組裝活動、經銷商網路和車隊交付計畫的集中化趨勢。雖然國內路線規劃比國際路線更為簡單,但鐵路裝貨點、倉儲設施和最終交貨時區之間的時間管理仍然需要高度精準。國內運輸的營運管理比跨國或海運更為便捷,但當區域間運輸量波動或各OEM工廠產量改變時,仍需進行細緻的調度規劃。隨著生產日益在地化,一些國內運輸路線變得更短、更頻繁。這增加了承運商在單一運輸週期內需要管理的停靠點和交接次數。與受限於有限運輸走廊的營運商相比,擁有靈活調度系統和廣泛運輸路線網路的營運商能夠更有效地應對此類路線變化。
預計2026年至2031年間,國際走廊將以6.22%的複合年成長率成長。儘管合規要求日益嚴格,單證流程也日益複雜,但與跨境和海運相關的美國整車物流市場仍在持續擴張。此市場細分為進口、出口和小批量特種運輸,每項業務在單證、滯留管理和運輸方式選擇方面都有不同的要求。 CH Robinson在2026年4月指出,雖然由於新車需求放緩,出口壓力緩解,但汽車物流策略正轉向零件、售後市場商品和二手車運輸。這表明,供應商越來越需要靈活的處理模式,而非單一用途的運輸系統。國際營運商可以透過以下方式創造更大的附加價值:透過嚴格的合規要求、更有效地管理港口和倉儲設施的滯留貨物,以及在固定服務模式無法充分滿足客戶需求時提供柔軟性的運輸方式。因此,雖然美國成品車物流市場的國際部分運作起來非常複雜,但也為差異化服務和高附加價值協調運作提供了很大的空間。
其他好處:
- Excel格式的市場預測(ME)表
- 3個月的分析師支持
目錄
第1章:引言
- 研究假設和市場定義
- 調查範圍
第2章:調查方法
第3章執行摘要
第4章 市場狀況
- 市場概況及物流在成品車中的作用
- 汽車相關支出趨勢
- 市場促進因素
- 成品車經銷中的回流與近岸外包
- 電池電氣化及安全操作要求
- OEM廠商對依序交貨的需求
- 即時可視化和異常管理的實施狀態
- 美墨走廊跨境合規的複雜性。
- 場地和損害緩解工作流程的自主性
- 市場限制因素
- 促進要素短缺和專業運輸公司運輸能力的限制
- 主要航運路線上的自動追蹤和滾裝船瓶頸
- 昂貴車輛的損壞、保險索賠和維修費用
- 跨境交易中的監管和貿易摩擦
- 法律規範
- 價值鍊和分銷管道的結構分析
- 技術創新前景
- 波特五力分析
- 成品車物流要求的變化
- 地緣政治事件對供應鏈變化的影響
第5章 市場規模與成長預測
- 透過物流功能
- 運輸
- 路
- 航空
- 海路和內河水道
- 鐵路
- 倉儲/物流
- 附加價值服務及其他
- 運輸
- 按目的地
- 國內的
- 國際的
- 進口/入境
- 出口/海外
- 按車輛類型
- 乘用車(包括二輪車和三輪車)
- 商用車輛
- 非公路用車輛
- 按最終用戶行業分類
- OEMs
- 經銷商
- 其他(租賃公司、貨運租賃公司、政府/國防機構車輛等)
- 按地區
- 東北
- 東南
- 中西部
- 西南
- 西方
第6章 競爭情勢
- 市場集中度
- 關鍵策略趨勢
- 市佔率分析
- 公司簡介
- United Road Services
- Wallenius Wilhelmsen
- Proficient Auto Logistics, Inc.
- Glovis America, Inc.
- Cassens Transport Company
- Hansen and Adkins Auto Transport
- Pasha Automotive Services
- ACERTUS
- Norfolk Southern Corporation
- CSX Corporation
- Union Pacific Corporation
- BNSF Railway Group
- Canadian National Railway Company(CN)
- Canadian Pacific Kansas City
- Ryder System, Inc.
- CMA CGM Group(Including CEVA Logistics)
- DHL Group
- Penske Corporation
- APL Logistics
- Auto Warehousing Company(AWC)
- Kenco Logistics
- AMPORTS Inc.
- ConGlobal
- RPM Logistics
- Ports America
- Schnellecke Logistics
第7章 市場機會與未來展望
According to Mordor Intelligence, the United States finished vehicle logistics market size was valued at USD 38.33 billion in 2025 and estimated to grow from USD 40.29 billion in 2026 to reach USD 51.11 billion by 2031, at a CAGR of 4.87% during the forecast period (2026-2031).
Production localization is reshaping route design in the United States finished vehicle logistics market, because a larger domestic manufacturing footprint is reducing some long-haul import-related moves while increasing the density of regional dispatch cycles and dealer drops. This report is Segmented by Logistics Function (Transportation, Warehousing and Distribution, Value-Added Services), by Destination (Domestic, International), by Type of Vehicles (Passenger, Commercial, Off-Highway), by End-User Industry (OEMs, Dealers, Others), and by Region (Northeast, Southeast, Midwest, Southwest, and West). The Market Forecasts are Provided in Terms of Value (USD).
United States Finished Vehicle Logistics Market Trends and Insights
Reshoring and Nearshoring of Finished Vehicle Flows Reshaping Domestic Lane Density
Tariff exposure and origin planning are changing flow design across the United States finished vehicle logistics market, because sourcing decisions now affect not only plant economics but also lane density, compound usage, and the balance between domestic and cross-border vehicle movement. The Baker Institute noted that the auto and auto parts sector accounted for nearly one-quarter of all North American trade in 2024, which shows how even a modest production shift can alter vehicle flows across multiple logistics nodes. A higher domestic production mix reduces some port-linked and long-haul inbound moves, but it also increases the number of shorter dispatch cycles between assembly plants, rail compounds, processing centers, and dealers. That change raises stop density and makes scheduling more demanding, especially where new manufacturing corridors do not yet have the same depth of logistics infrastructure as older automotive regions. In the United States finished vehicle logistics market, providers with wide national coverage and flexible equipment positioning are better placed to capture redistributed domestic volumes without sacrificing service quality. Carriers that depend heavily on fixed cross-border patterns face more route-level risk when OEM sourcing priorities shift faster than asset deployment plans.
Electrification and Battery-Safe Handling Requirements Adding Infrastructure Complexity
Electrification is adding a more demanding compliance and facility layer to the United States finished vehicle logistics market, because battery-powered vehicles do not move under the same practical handling assumptions as traditional internal combustion platforms. The Federal Register proposed distinct UN designations for lithium-ion battery vehicles, lithium-metal battery vehicles, and sodium-ion battery vehicles in February 2026, which formalized a more detailed regulatory structure for battery-powered transport. That framework increases the need for accurate documentation, standardized classification, and tighter custody procedures before a vehicle leaves the origin point or enters multimodal transit. Vehicle processing centers now need stronger routines for charge verification, controlled dwell management, and response readiness when battery-related issues arise during handling or staging. AIAG's finished vehicle logistics guideline remains the common language for inspection and reporting across OEMs, road carriers, railroads, and ocean operators, which makes process discipline even more important as EV volumes scale. Providers that already invested in compliant handling procedures and EV-ready compounds are therefore positioned to capture a larger portion of the higher-value work attached to these vehicle flows.
Driver Shortages and Specialized Carrier Capacity Constraints Tightening Supply
Specialized road capacity remains a limiting factor in the United States finished vehicle logistics market, because finished vehicle hauling requires a skill base that is narrower than the broader truckload labor pool. Car-hauler roles involve multi-level loading discipline, damage prevention during loading and unloading, route familiarity with dealer drops, and operating standards that often differ by OEM program. This makes replacement hiring slower, even when general freight hiring conditions appear to improve, because new drivers need hands-on training before they can be deployed safely on revenue-critical automotive lanes. When capacity tightens, carriers can favor better-yielding moves, which leaves lower-priority lanes exposed to tender rejection, longer wait times, and more variable service. The effect is especially visible when production surges, regional inventories tighten, or dealer replenishment schedules become less forgiving. In the United States finished vehicle logistics market, this creates a persistent ceiling on how quickly road capacity can respond when demand rises faster than training and onboarding cycles.
Other drivers and restraints analyzed in the detailed report include:
- OEM Demand for Just-In-Sequence Delivery Driving Software and Network Precision
- Real-Time Visibility and Exception Management Adoption Becoming a Contract Prerequisite
- Damage, Claims, and Rework Costs on High-Value Vehicles Raising Margin Pressure
For complete list of drivers and restraints, kindly check the Table Of Contents.
Segment Analysis
Transportation held 75.00% of the United States finished vehicle logistics market size in 2025, and road delivery remained critical on the final leg from rail ramp or port to dealer because that last handoff is where schedule precision and damage control are tested most directly. Rail still moved a large share of new vehicles by unit count, but the road connection kept trucking central to revenue formation because dealer delivery, compound transfer, and appointment-sensitive moves are priced separately from the longer line-haul leg. That structure means the United States finished vehicle logistics market still depends on road and rail coordination rather than on one dominant mode, especially when port arrivals, compound processing, and dealer release timing do not line up perfectly. Multimodal execution matters because delays on either the rail or trucking side can disrupt inventory positioning at the point where vehicles are expected to move into retail or fleet channels. Providers that can coordinate rail interfaces, compound staging, and dealer drop scheduling more tightly are better placed to protect utilization and service consistency as lane patterns continue to shift.
Warehousing and distribution is projected to grow at a 6.62% CAGR from 2026 to 2031, making this part of the United States finished vehicle logistics market size more important to overall value capture as processing and staging requirements become more demanding. EV-related preparation is a major driver, because compounds increasingly need charging capability, battery condition checks, controlled dwell routines, and compliant pre-shipment inspection before a vehicle can move into the next transport stage. Kenco Group said in May 2026 that its warehousing footprint expanded 24.7% year over year to 45.9 million square feet across 134 United States sites, which shows how demand for high-quality distribution space is extending well beyond a narrow set of legacy automotive locations. Value-added services are also drawing more attention because accessory fitting, premium handling, inspection support, and specialized movement of high-value vehicles deliver stronger unit economics than pure line-haul work. ACERTUS expanded into exotic and luxury vehicle transport through its March 2025 acquisition of Bluestar Auto Movers, which shows how service breadth is becoming a competitive lever in higher-margin logistics niches.
Domestic flows accounted for 76.11% of the United States finished vehicle logistics market share by destination in 2025, which kept the segment anchored in plant-to-compound and compound-to-dealer movements that operate within a national transport and distribution framework. This reflects the concentration of the United States assembly activity, dealership networks, and fleet delivery programs inside national borders, where routing is simpler than on international corridors but still highly dependent on timing discipline between rail ramps, compounds, and final delivery windows. Domestic movements are operationally more controllable than cross-border or ocean-linked flows, yet they still require dense dispatch planning when lane volumes shift between regions or when OEM output changes by plant. As production localization advances, some domestic lanes become shorter and more frequent, which increases the number of stops and handoffs that carriers must manage in a single operating cycle. Providers with flexible dispatch systems and wider lane coverage can capture these route changes more effectively than operators tied to a narrower set of corridors.
International corridors are projected to grow at a 6.22% CAGR from 2026 to 2031, so the United States finished vehicle logistics market size attached to cross-border and seaborne vehicle movement is still expanding despite tighter compliance needs and more complex paperwork expectations. The segment is split between imports, exports, and lower-volume specialized flows, each of which places different demands on documentation, dwell management, and mode selection. C.H. Robinson said in April 2026 that softer new-vehicle demand was easing some outbound pressure while automotive logistics strategies were shifting toward parts, aftermarket goods, and used vehicle flows, which shows how providers increasingly need flexible handling models instead of single-purpose transport setups. International operators can create more value when they support compliance-heavy movements, manage port or compound dwell more tightly, and offer mode flexibility where fixed service patterns do not fit customer requirements well. The international portion of the United States finished vehicle logistics market therefore carries greater operating complexity, but it also leaves more room for differentiated service and higher-value coordination work.
Complete Report Scope:
- By Logistics Function
- Transportation
- Road
- Air
- Sea and Inland Waterways
- Rail
- Warehousing and Distribution
- Value-added Services and Others
- Transportation
- By Destination
- Domestic
- International
- Import/Inbound
- Export/Outbound
- By Type of Vehicles
- Passenger Vehicles (Including Two and Three-Wheelers)
- Commercial Vehicles
- Off-Highway Vehicles
- By End-user Industry
- OEMs
- Dealers
- Others (Rental Companies, Fleet Leasing Companies, Government and Defense Fleets, etc.)
- By Region
- Northeast
- Southeast
- Midwest
- Southwest
- West
List of Companies Covered in this Report:
- United Road Services
- Wallenius Wilhelmsen
- Proficient Auto Logistics, Inc.
- Glovis America, Inc.
- Cassens Transport Company
- Hansen and Adkins Auto Transport
- Pasha Automotive Services
- ACERTUS
- Norfolk Southern Corporation
- CSX Corporation
- Union Pacific Corporation
- BNSF Railway Group
- Canadian National Railway Company (CN)
- Canadian Pacific Kansas City
- Ryder System, Inc.
- CMA CGM Group (Including CEVA Logistics)
- DHL Group
- Penske Corporation
- APL Logistics
- Auto Warehousing Company (AWC)
- Kenco Logistics
- AMPORTS Inc.
- ConGlobal
- RPM Logistics
- Ports America
- Schnellecke Logistics
Additional Benefits:
- The market estimate (ME) sheet in Excel format
- 3 months of analyst support
TABLE OF CONTENTS
1 Introduction
- 1.1 Study Assumptions and Market Definition
- 1.2 Scope of the Study
2 Research Methodology
3 Executive Summary
4 Market Landscape
- 4.1 Market Overview and Role of Logistics in Finished Vehicle
- 4.2 Automotive Spending Trends
- 4.3 Market Drivers
- 4.3.1 Reshoring and Nearshoring of Finished Vehicle Flows
- 4.3.2 Electrification and Battery-Safe Handling Requirements
- 4.3.3 OEM Demand for Just-in-Sequence Delivery
- 4.3.4 Real-Time Visibility and Exception Management Adoption
- 4.3.5 Cross-Border Compliance Complexity on the United States-Mexico Corridors
- 4.3.6 Autonomy in Yard and Damage-Reduction Workflows
- 4.4 Market Restraints
- 4.4.1 Driver Shortages and Specialized Carrier Capacity Constraints
- 4.4.2 Autorack and Ro-Ro Bottlenecks in Peak Lanes
- 4.4.3 Damage, Claims, and Rework Costs on High-Value Vehicles
- 4.4.4 Regulatory and Trade Friction Across Border Movements
- 4.5 Regulatory Framework
- 4.6 Value Chain and Distribution Channel Architecture Analysis
- 4.7 Technology Innovations Outlook
- 4.8 Porter's Five Forces Analysis
- 4.8.1 Threat of New Entrants
- 4.8.2 Bargaining Power of Suppliers
- 4.8.3 Bargaining Power of Buyers
- 4.8.4 Threat of Substitutes
- 4.8.5 Rivalry Among Competitors
- 4.9 Evolution of Finished Vehicle Logistics Requirements
- 4.10 Impact of Geo-Political Events on Supply Chain Shifts
5 Market Size and Growth Forecasts
- 5.1 By Logistics Function
- 5.1.1 Transportation
- 5.1.1.1 Road
- 5.1.1.2 Air
- 5.1.1.3 Sea and Inland Waterways
- 5.1.1.4 Rail
- 5.1.2 Warehousing and Distribution
- 5.1.3 Value-added Services and Others
- 5.1.1 Transportation
- 5.2 By Destination
- 5.2.1 Domestic
- 5.2.2 International
- 5.2.2.1 Import/Inbound
- 5.2.2.2 Export/Outbound
- 5.3 By Type of Vehicles
- 5.3.1 Passenger Vehicles (Including Two and Three-Wheelers)
- 5.3.2 Commercial Vehicles
- 5.3.3 Off-Highway Vehicles
- 5.4 By End-user Industry
- 5.4.1 OEMs
- 5.4.2 Dealers
- 5.4.3 Others (Rental Companies, Fleet Leasing Companies, Government and Defense Fleets, etc.)
- 5.5 By Region
- 5.5.1 Northeast
- 5.5.2 Southeast
- 5.5.3 Midwest
- 5.5.4 Southwest
- 5.5.5 West
6 Competitive Landscape
- 6.1 Market Concentration
- 6.2 Key Strategic Moves
- 6.3 Market Share Analysis
- 6.4 Company Profiles (Includes Global Level Overview, Market Level Overview, Core Segments, Financials as Available, Strategic Information, Market Rank/Share for Key Companies, Products and Services, and Recent Developments)
- 6.4.1 United Road Services
- 6.4.2 Wallenius Wilhelmsen
- 6.4.3 Proficient Auto Logistics, Inc.
- 6.4.4 Glovis America, Inc.
- 6.4.5 Cassens Transport Company
- 6.4.6 Hansen and Adkins Auto Transport
- 6.4.7 Pasha Automotive Services
- 6.4.8 ACERTUS
- 6.4.9 Norfolk Southern Corporation
- 6.4.10 CSX Corporation
- 6.4.11 Union Pacific Corporation
- 6.4.12 BNSF Railway Group
- 6.4.13 Canadian National Railway Company (CN)
- 6.4.14 Canadian Pacific Kansas City
- 6.4.15 Ryder System, Inc.
- 6.4.16 CMA CGM Group (Including CEVA Logistics)
- 6.4.17 DHL Group
- 6.4.18 Penske Corporation
- 6.4.19 APL Logistics
- 6.4.20 Auto Warehousing Company (AWC)
- 6.4.21 Kenco Logistics
- 6.4.22 AMPORTS Inc.
- 6.4.23 ConGlobal
- 6.4.24 RPM Logistics
- 6.4.25 Ports America
- 6.4.26 Schnellecke Logistics
7 Market Opportunities and Future Outlook
- 7.1 White-space and Unmet-Need Assessment

 中國成品車物流:市場佔有率分析、產業趨勢與統計及成長預測(2026-2031年)
 汽車物流市場:依運輸方式、服務類型、車輛類型和最終用戶分類-2026-2032年全球市場預測
 汽車物流市場分析及預測(至2035年):依類型、產品類型、服務、技術、零件、應用、流程、運輸方式及階段分類德國車輛物流:市場佔有率分析、產業趨勢與統計及成長預測(2026-2031)輪胎物流市場分析及預測(至2035年):類型、產品類型、服務、技術、組件、應用、流程、部署狀態、最終用戶
 汽車物流市場規模、佔有率和趨勢分析報告:按活動、類型、分銷、物流解決方案、地區和細分市場分類(2026-2033 年)
 2026年全球汽車物流市場報告汽車物流:市場佔有率分析、產業趨勢與統計、成長預測(2026-2031)成品車物流市場:依運輸方式、服務類型、所有權類型、設備類型及最終用戶分類-2026-2032年全球市場預測
 汽車物流市場規模、佔有率、成長及全球產業分析:按類型、應用和地區分類的洞察,2026-2034 年預測