


 |
市場調查報告書
商品編碼
2099056
中國逆向物流:市場佔有率分析、產業趨勢與統計及成長預測(2026-2031)China Reverse Logistics - Market Share Analysis, Industry Trends & Statistics, Growth Forecasts (2026 - 2031) |
||||||

※ 本網頁內容可能與最新版本有所差異。詳細情況請與我們聯繫。
根據 Mordor Intelligence 預測,中國逆向物流市場規模將從 2025 年的 1,257.3 億美元成長到 2026 年的 1,416.7 億美元,到 2031 年將達到 2,505.6 億美元,2026 年至 2031 年的複合年成長率為 12.08%。
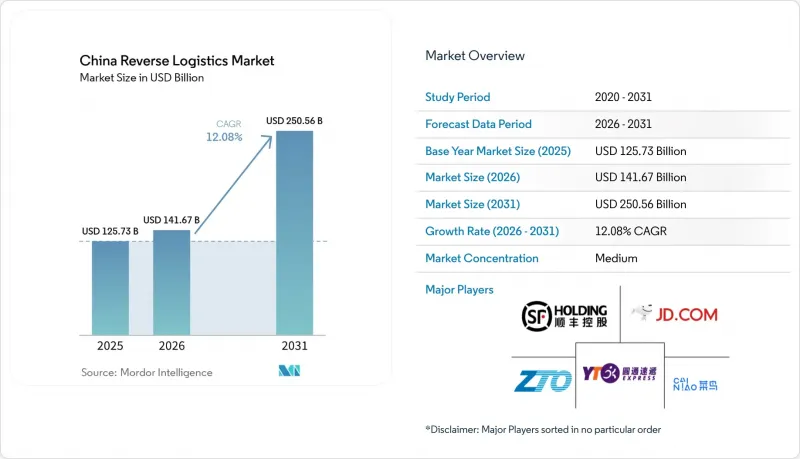
在中國大規模的電子商務生態系統、消費者退貨率上升以及對產品召回和轉售日益重視的推動下,中國逆向物流市場呈現強勁成長動能。本報告按逆向物流功能(運輸(陸運、空運及其他運輸方式)、倉儲及其他附加價值服務)、終端用戶行業(消費品及零售、住宅用品、醫療保健及製藥、快速消費品及其他終端用戶)和地區(北方、東北、東方、中部、南方、西南和西北)進行細分。市場預測以美元計價。
中國逆向物流市場趨勢與洞察
電子商務退貨量不斷增加,消費者對退款的期望也日益提高
中國大規模的線上零售市場持續為國內逆向物流市場帶來大量退貨。預計到2024年,線上零售額將達到2.16兆美元,並在國內主要消費走廊保持高密度的小包裹收集。隨著更快退款和更簡化退貨流程的承諾,經銷商越來越將退貨視為核心服務,而非只是附帶環節。這種轉變促使越來越多的經銷商將收集、分類和處置等業務外包給中國逆向物流市場的專業公司。
循環經濟和生產者責任制所帶來的壓力
循環經濟和資源回收項目正在為中國逆向物流市場創造更永續的需求基礎。中國電池追蹤技術的進步和回收再利用制度的日益完善,正推動產品回收朝向更規範的通路轉移。 2025年6月,京東物流部署了50萬個可重複使用的低溫運輸配送箱,顯示大規模包裝再利用已在物流運作中得到應用。這些項目在產品整個生命週期內,而非僅限於單次銷售活動期間,實現了持續的收集、分類、再利用和資源回收。這有助於穩定需求基礎,並支持中國逆向物流市場處理能力的長期擴張。
分類、檢驗和回收的高成本。
成本回收仍是中國逆向物流市場的主要阻礙因素。對於許多回收的電子設備而言,檢驗、分類和翻新成本可能占到轉售價格的30%至40%,這使得沒有高吞吐量自動化系統的業者利潤空間非常有限。 2026年6月,財新報道稱,只有不到30%的廢棄電動車電池透過正規回收管道回收。這凸顯了法規處理流程在克服成本外流和非正規競爭方面持續面臨的挑戰。鋰價波動是另一個壓力來源,因為回收材料價值的下降會削弱正規處理的獲利能力。因此,儘管中國逆向物流市場的大規模業者表現相對較好,但中小企業的利潤率仍面臨壓力。
細分市場分析
到2025年,運輸業將佔中國逆向物流市場佔有率的45.50%,這意味著大部分業務仍將集中在收集、幹線運輸和集散作業上。由於退貨主要發生在人口密集的城市地區和分散的郊區需求中心之間,因此大部分物流運輸仍依賴公路網路。對於時效性要求較高的電子產品和藥品,空運仍然發揮著至關重要的作用,因為速度和管理比成本更為重要。其他運輸方式的重要性日益凸顯,尤其是在小規模退貨、跨境退貨和長途退貨運輸等需要低成本替代方案的領域,鐵路和多式聯運正逐漸成為主流。
倉儲業預計將以18.09%的複合年成長率成長,成為該細分市場中成長最快的領域,這清楚地表明了價值回收在中國逆向物流市場中日益成長的重要性。目前,退貨的儲存、分類、整合和重新配送擴大發生在專業處理中心,而不僅僅是配送中心。隨著經銷商需要在同一營運鏈內完成庫存補充、再生和處置等環節,其他附加價值服務也不斷加強。因此,中國的逆向物流產業正朝著運輸和系統化處理相結合的一體化平台轉型。
其他好處:
- Excel格式的市場預測(ME)表
- 3個月的分析師支持
目錄
第1章:引言
- 研究假設和市場定義
- 調查範圍
第2章:調查方法
第3章執行摘要
第4章 市場狀況
- 市場概況及逆向物流在物流中的作用
- 市場促進因素
- 電子商務退貨率上升,消費者對退款的期望也越來越高
- 循環經濟和生產者責任的壓力
- 電動汽車電池、電子設備和高附加價值資產的回收趨勢
- 需要對層級式物流樞紐進行都市區整合。
- 對退貨核准流程數位化和透明度提高的期望
- 與國際電子商務相關的跨境退貨的複雜性
- 市場限制因素
- 分類、檢驗和回收的高成本。
- 服務標準和營運複雜性的區域差異
- 由於大量低價值退貨導致利潤率低
- 多方退貨中與資料共用、儲存和責任鏈相關的風險。
- 法律規範
- 價值鍊和分銷管道的結構分析
- 技術創新前景
- 波特五力模型
- 逆向物流需求的演變
- 專題報導—美國電子商務產業
- 消費者行為與偏好變化的研究
- 退貨成本對零售商的影響——分析師觀點
- 地緣政治事件對供應鏈變化的影響
第5章 市場規模及成長預測(價值,2026-2031 年)
- 功能性逆向物流
- 運輸
- 路
- 航空
- 其他交通方式
- 倉儲營運(儲存、配送、收貨)
- 其他附加價值服務(退貨處理、重新入庫、翻新、處置)
- 運輸
- 按最終用戶行業分類
- 消費者和零售商
- 家居與室內設計
- 醫療和藥品
- FMCG
- 其他最終用戶
- 按地區
- 北
- 東北
- 東
- 中部
- 南
- 西南
- 西北
第6章 競爭情勢
- 市場集中度
- 關鍵策略趨勢
- 市佔率分析
- 公司簡介
- JD Logistics, Inc.
- SF Holdings Co., Ltd.
- Cainiao Network
- YTO Express Group Co., Ltd.
- ZTO Express(Cayman)Inc.
- STO Express Co., Ltd.
- Yunda Holding Co., Ltd.
- J&T Global Express Limited
- Sinotrans Limited
- GEM Co.,Ltd.
- China Post Group Co., Ltd.
- DHL Supply Chain
- DSV(incl. DB Schenker)
- Kuehne+Nagel International AG
- CEVA Logistics
- FedEx Corporation
- United Parcel Service, Inc.
- Geodis
- Nippon Express Holdings, Inc.
- Yusen Logistics Co., Ltd.
- ANE Logistics
第7章 市場機會與未來展望
According to Mordor Intelligence, the China reverse logistics market size is projected to expand from USD 125.73 billion in 2025 to USD 141.67 billion in 2026 and reach USD 250.56 billion by 2031, growing at a CAGR of 12.08% from 2026 to 2031.
China's reverse logistics market is performing steadily, supported by the country's large e-commerce ecosystem, growing consumer returns, and increasing focus on product recovery and resale. This report is Segmented by Reverse Logistics Function (Transportation (Road, Air, Other Modes), Warehousing, and Other Value-Added Services), by End-User Industry (Consumer and Retail, Home and Decor, Healthcare and Pharmaceuticals, FMCG, and Other End Users), and by Region (North, Northeast, East, Central, South, Southwest, and Northwest). The Market Forecasts are Provided in Terms of Value (USD).
China Reverse Logistics Market Trends and Insights
Rising E-Commerce Return Volumes and Refund Expectations
China's very large online retail base continues to send high volumes of returns into the Country's reverse logistics market. Online retail sales reached USD 2.16 trillion in 2024, which kept parcel density high across the country's main consumption corridors. Faster refunds and easier returns promises are making merchants treat returns as a core service requirement rather than a side process. That shift is pushing more sellers to outsource pickup, sorting, and disposition work to specialist providers across the China reverse logistics market.
Circular Economy and Producer Responsibility Pressures
Circularity and recovery programs are creating a more durable demand layer in the China reverse logistics market. China's battery-tracking push and broader formalization of recycling are moving product recovery into more structured channels. JD Logistics deployed 500,000 reusable cold-chain delivery boxes in June 2025, demonstrating that large-scale packaging reuse is already embedded in logistics operations. These programs create recurring collection, sorting, reuse, and recovery work that lasts throughout product life cycles rather than just during a single sales event. That makes this demand base steadier and helps support long-term capacity build-out in the China reverse logistics market.
High Cost of Sorting, Testing, and Refurbishment
Cost recovery remains a core limit in the China reverse logistics market. For many returned electronics, testing, triage, and refurbishment can consume 30% to 40% of the resale value, leaving little room for operators without high-throughput automation. Caixin reported in June 2026 that less than 30% of retired EV power batteries were collected through formal recycling channels, underscoring the ongoing struggle of compliant processing to overcome cost leakage and informal competition. Lithium price swings add another layer of pressure because lower recovered material values weaken the economics of formal processing. The result is that scale players hold up better, while smaller firms in the China reverse logistics market continue to face margin pressure.
Other drivers and restraints analyzed in the detailed report include:
- EV Battery, Electronics, and High-Value Asset Take-Back Flows
- Urban Consolidation Needs Across Tiered Distribution Hubs
- Fragmented Regional Service Standards and Operating Complexity
For complete list of drivers and restraints, kindly check the Table Of Contents.
Segment Analysis
Transportation held 45.50% of the China reverse logistics market share in 2025, indicating that much of the activity still sits in pickup, line-haul, and consolidation work. Road networks carry most of these flows because returns arise across dense city clusters and dispersed suburban demand points. Air remains important for time-sensitive electronics and pharmaceutical returns where speed and custody matter more than cost. Other modes remain smaller, but rail and intermodal options are gaining relevance where cross-border or long-distance return movements need lower-cost alternatives.
Warehousing is forecast to expand at 18.09% CAGR, the fastest pace in this segmentation, and a clear sign that value recovery is becoming more important in the China reverse logistics market. More returns are now being stored, graded, consolidated, and redirected to specialized processing centers rather than simple delivery stations. Other value-added services are also strengthening, as merchants need restocking, refurbishment, and disposition support within a single operating chain. This is shifting the China reverse logistics industry toward integrated platforms that combine transport with disciplined processing.
Complete Report Scope:
- By Reverse Logistics Function
- Transportation
- Road
- Air
- Other Modes
- Warehousing (Storage, Distribution, Consolidation)
- Other Value-added Services (Return Processing, Restocking, Refurbishment, Disposition)
- Transportation
- By End-user Industry
- Consumer and Retail
- Home and Decor
- Healthcare and Pharmaceuticals
- FMCG
- Other End Users
- By Region
- North
- Northeast
- East
- Central
- South
- Southwest
- Northwest
List of Companies Covered in this Report:
- JD Logistics, Inc.
- SF Holdings Co., Ltd.
- Cainiao Network
- YTO Express Group Co., Ltd.
- ZTO Express (Cayman) Inc.
- STO Express Co., Ltd.
- Yunda Holding Co., Ltd.
- J&T Global Express Limited
- Sinotrans Limited
- GEM Co.,Ltd.
- China Post Group Co., Ltd.
- DHL Supply Chain
- DSV (incl. DB Schenker)
- Kuehne + Nagel International AG
- CEVA Logistics
- FedEx Corporation
- United Parcel Service, Inc.
- Geodis
- Nippon Express Holdings, Inc.
- Yusen Logistics Co., Ltd.
- ANE Logistics
Additional Benefits:
- The market estimate (ME) sheet in Excel format
- 3 months of analyst support
TABLE OF CONTENTS
1 Introduction
- 1.1 Study Assumptions & Market Definition
- 1.2 Scope of the Study
2 Research Methodology
3 Executive Summary
4 Market Landscape
- 4.1 Market Overview and Role of Reverse Logistics in Logistics
- 4.2 Market Drivers
- 4.2.1 Rising E-Commerce Return Volumes and Refund Expectations
- 4.2.2 Circular Economy and Producer Responsibility Pressures
- 4.2.3 EV Battery, Electronics, and High-Value Asset Take-Back Flows
- 4.2.4 Urban Consolidation Needs Across Tiered Distribution Hubs
- 4.2.5 Digitized Return Authorization and Visibility Expectations
- 4.2.6 Cross-Border Return Complexity from International E-Commerce
- 4.3 Market Restraints
- 4.3.1 High Cost of Sorting, Testing, and Refurbishment
- 4.3.2 Fragmented Regional Service Standards and Operating Complexity
- 4.3.3 Margin Erosion on Low-Value, High-Volume Returns
- 4.3.4 Data Sharing, Custody, and Chain-of-Responsibility Risks in Multi-Party Returns
- 4.4 Regulatory Framework
- 4.5 Value Chain and Distribution Channel Architecture Analysis
- 4.6 Technology Innovations Outlook
- 4.7 Porter's Five Forces
- 4.7.1 Threat of New Entrants
- 4.7.2 Bargaining Power of Suppliers
- 4.7.3 Bargaining Power of Buyers
- 4.7.4 Threat of Substitutes
- 4.7.5 Rivalry Among Competitors
- 4.8 Evolution of Reverse Logistics Requirements
- 4.9 Spotlight - United States E-commerce Industry
- 4.10 Study on Changing Consumer Behavior and Preferences
- 4.11 Impact of Cost of Returns on Retailers - Analyst View
- 4.12 Impact of Geo-Political Events on Supply Chain Shifts
5 Market Size & Growth Forecasts (Value, 2026-2031)
- 5.1 By Reverse Logistics Function
- 5.1.1 Transportation
- 5.1.1.1 Road
- 5.1.1.2 Air
- 5.1.1.3 Other Modes
- 5.1.2 Warehousing (Storage, Distribution, Consolidation)
- 5.1.3 Other Value-added Services (Return Processing, Restocking, Refurbishment, Disposition)
- 5.1.1 Transportation
- 5.2 By End-user Industry
- 5.2.1 Consumer and Retail
- 5.2.2 Home and Decor
- 5.2.3 Healthcare and Pharmaceuticals
- 5.2.4 FMCG
- 5.2.5 Other End Users
- 5.3 By Region
- 5.3.1 North
- 5.3.2 Northeast
- 5.3.3 East
- 5.3.4 Central
- 5.3.5 South
- 5.3.6 Southwest
- 5.3.7 Northwest
6 Competitive Landscape
- 6.1 Market Concentration
- 6.2 Key Strategic Moves
- 6.3 Market Share Analysis
- 6.4 Company Profiles (includes Global level Overview, Market level overview, Core Segments, Financials as available, Strategic Information, Market Rank/Share for key companies, Products & Services, and Recent Developments)
- 6.4.1 JD Logistics, Inc.
- 6.4.2 SF Holdings Co., Ltd.
- 6.4.3 Cainiao Network
- 6.4.4 YTO Express Group Co., Ltd.
- 6.4.5 ZTO Express (Cayman) Inc.
- 6.4.6 STO Express Co., Ltd.
- 6.4.7 Yunda Holding Co., Ltd.
- 6.4.8 J&T Global Express Limited
- 6.4.9 Sinotrans Limited
- 6.4.10 GEM Co.,Ltd.
- 6.4.11 China Post Group Co., Ltd.
- 6.4.12 DHL Supply Chain
- 6.4.13 DSV (incl. DB Schenker)
- 6.4.14 Kuehne + Nagel International AG
- 6.4.15 CEVA Logistics
- 6.4.16 FedEx Corporation
- 6.4.17 United Parcel Service, Inc.
- 6.4.18 Geodis
- 6.4.19 Nippon Express Holdings, Inc.
- 6.4.20 Yusen Logistics Co., Ltd.
- 6.4.21 ANE Logistics
7 Market Opportunities & Future Outlook
- 7.1 White-space & Unmet-Need Assessment

 2026年全球逆向物流人工智慧(AI)市場報告
 2026-2030年全球逆向物流市場
 逆向物流市場分析及預測(至2035年):依類型、產品、服務、技術、組件、應用、流程、最終使用者、解決方案、模式分類
 印度逆向物流:市場佔有率分析、產業趨勢與統計及成長預測(2026-2031)英國逆向物流:市場佔有率分析、產業趨勢與統計及成長預測(2026-2031)
 逆向物流市場預測至2034年-按退貨類型、服務、物流供應商類型、退貨管道、最終用戶和地區分類的全球分析
 全球逆向物流市場:市場規模、佔有率、趨勢和成長分析(2026-2034)逆向物流市場規模、佔有率、成長及全球產業分析:按類型、應用和地區分類,並提供 2026-2034 年的洞察和預測美國逆向物流:市場佔有率分析、產業趨勢與統計、成長預測(2026-2031)
 逆向物流市場報告:按退貨類型、服務、最終用戶和地區分類(2026-2034 年)