


 |
市場調查報告書
商品編碼
2099053
印度逆向物流:市場佔有率分析、產業趨勢與統計及成長預測(2026-2031)India Reverse Logistics - Market Share Analysis, Industry Trends & Statistics, Growth Forecasts (2026 - 2031) |
||||||

※ 本網頁內容可能與最新版本有所差異。詳細情況請與我們聯繫。
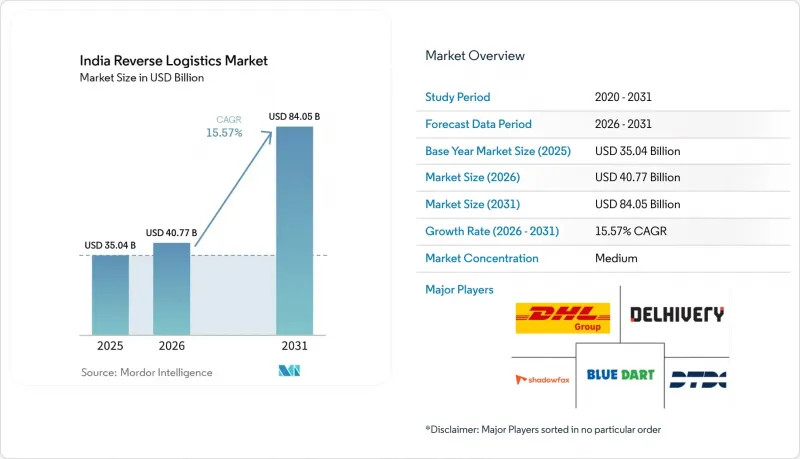
根據 Mordor Intelligence 預測,印度逆向物流市場預計將從 2025 年的 350.4 億美元成長到 2026 年的 407.7 億美元,到 2031 年達到 840.5 億美元,2026 年至 2031 年的複合年預計成長率為 15.57%。
目前,隨著逆向物流與客戶維繫和庫存回收的連結日益緊密,在印度逆向物流市場,服務品質的重要性已超越單純的成本控制。本報告按逆向物流功能(運輸(陸運、空運及其他運輸方式)、倉儲(儲存、配送、收集)及其他附加價值服務)、終端用戶產業(消費品及零售、住宅及室內裝潢、醫療保健及製藥、快速消費品及其他終端用戶)及地區(北部、中部、西部、東部及南部)進行細分。市場預測以美元計價。
印度逆向物流市場的趨勢與洞察
電子商務退貨量和退回給寄件人的退貨量激增:這是僅靠控制無法應對的基準處理量。
印度的線上商務基礎設施持續擴張,大量訂單透過退貨管道湧入印度逆向物流市場。 DHL的一份報告顯示,過去12個月中,81%的印度網路用戶有過網購退貨經歷,顯示退貨已成為數位購物行為的常態。服裝和鞋類行業的退貨量尤其高,因為尺寸不符以及預期與實際情況不符等問題在正規的線上零售中仍然普遍存在。根據Blue Dirt預測,到2026會計年度,二、三線城市預計將占到新增D2C(直接面對消費者)訂單的約66%,逆向物流的回收密度也正在向大都會圈以外的地區擴展。此外,基於消費者保護框架的退貨期限規定,正迫使品牌方採用正式的退貨系統,而非非正式的召回措施。因此,在印度的逆向物流市場,擁有更強大的地址檢驗能力、客戶意圖確認能力以及郵遞區號層級的配送路線設定工具的供應商將擁有顯著優勢。
透過轉售、翻新和再銷售實現盈利:從成本回收到產生收入。
將退貨視為可回收庫存而非成本的趨勢正在改變印度逆向物流市場的服務模式。根據 Cashify 預測,到 2025 年,以舊換新量預計將年增 15-16%,這表明越來越多的消費者參與有組織的以舊換新和升級計畫。這種轉變有利於那些能夠對商品進行檢查、評級和清潔,並快速將其送至轉售或翻新管道的企業。 Attero 的「Selsmart」服務將於 2025 年 8 月前在超過 19 個城市部署,每月處理超過 3 萬份訂單,這表明正規的上門回收服務可以達到相當大的規模。由於二手通路仍佔據二手設備交易的很大佔有率,因此能夠在回收時檢驗貨源可靠的公司在正規回收通路中保持優勢。 《金融快報》預測,隨著新設備價格上漲,翻新智慧型手機的數量將在 2026 年增加,也支撐了退回電子設備轉售價值的提升。
相對於訂單價值而言,逆向物流成本過高:這是一個利潤率問題,沒有簡單的解決方案。
在印度的逆向物流市場,退貨處理成本持續擠壓利潤率,尤其是在低價類別中。 Blue Dart指出,不僅是顧客退貨,還有退回原產國的退貨,都是印度電商利潤率面臨的最大問題。 2026年4月,GS1印度公司估計,產品數據品質差每年造成該產業約50億印度盧比(約5.88億美元)的損失。其中,19億印度盧比(約20.3億美元)直接與逆向物流的處理成本有關。貨到付款(COD)訂單的成本仍然最難彌補,因為一旦配送失敗,企業不僅要承擔配送成本和逆向物流成本,而且無法收回任何收入。這種成本困境表明,僅僅提高網路效率是不夠的。品牌也需要提升產品訊息的質量,提高預付款轉換率,並加強結帳審核。
細分市場分析
到2025年,運輸環節將佔據印度逆向物流市場49.05%的市場佔有率,成為最大的功能性板塊。這一集中度反映了數百萬個配送地址所需的「首公里」取件規模。道路運輸仍然是主要的子模式,因為許多退貨是透過短途和中途運輸,而不是透過高價空運。此外,各種退貨需求的分散,包括貨到付款、換貨、拒收和破損訂單,也使該環節受益,有助於維持較高的路線密度。事實上,運輸環節仍是取件成功率、運輸狀態可見度和問題解決速度最直接影響顧客體驗的服務層。
倉儲是成長最快的環節,預計到2031年,印度逆向物流市場規模將以21.58%的複合年成長率成長。退貨設施不再僅僅用作儲存場所;營運商正在同一設施內整合檢驗、評級、再加工、補貨和處置等工作流程。其他附加價值服務由於將退貨處理、補貨、再加工和最終處置整合到單一服務包中,因此單位利潤率最高。
其他好處:
- Excel格式的市場預測(ME)表
- 3個月的分析師支持
目錄
第1章:引言
- 研究假設和市場定義
- 調查範圍
第2章:調查方法
第3章執行摘要
第4章 市場狀況
- 市場概況及逆向物流在物流中的作用
- 市場促進因素
- 電子商務退貨量和退回寄件者的貨物數量增加。
- 隨著消費者信心的增強,對更順暢的退貨流程的需求也隨之增加。
- 透過轉售、再銷售和再交易實現盈利
- 線上商務產品資料不足與預期差距
- 電子廢棄物合規與循環經濟的引入
- 第三方物流主導的逆向物流網路快速擴張
- 市場限制因素
- 相對於訂單價值而言,退貨處理成本較高
- 在主要樞紐之外分散建設收集、分類和品質檢驗基礎設施。
- 因檢驗或庫存補充延誤造成的價值損失。
- 針對已開封、損壞和拒收的退貨商品,提供複雜的糾紛解決方案。
- 法律規範
- 價值鍊和分銷管道的結構分析
- 技術創新前景
- 波特五力模型
- 逆向物流需求的演變
- 注意—印度電子商務產業
- 消費者行為與偏好變化的研究
- 退貨成本對零售商的影響——分析師觀點
- 地緣政治事件對供應鏈變化的影響
第5章 市場規模及成長預測(價值,2026-2031 年)
- 功能性逆向物流
- 運輸
- 路
- 航空
- 其他交通方式
- 倉儲營運(儲存、配送、收貨)
- 其他附加價值服務(退貨處理、重新入庫、翻新、處置)
- 運輸
- 按最終用戶行業分類
- 消費者和零售商
- 家居與室內設計
- 醫療和藥品
- FMCG
- 其他最終用戶
- 按地區
- 北方
- 中部
- 西
- 東
- 南部
第6章 競爭情勢
- 市場集中度
- 關鍵策略趨勢
- 市佔率分析
- 公司簡介
- Blue Dart Express Limited
- Delhivery Limited
- DTDC Express Limited
- Shadowfax Technologies Private Limited
- Safexpress Private Limited
- Xpressbees
- Mahindra Logistics Limited
- TVS Supply Chain Solutions Limited
- Allcargo Gati
- DHL Express
- FedEx Corporation
- DSV(incl. DB Schenker)
- Kuehne+Nagel International AG
- Yusen Logistics Co., Ltd.
- Kintetsu World Express, Inc.
- Aramex PJSC
- Attero Recycling Private Limited
- TCI Supply Chain Solutions(TCI-SCS)
- Ekart Logistics
- CEVA Logistics(CMA CGM)
- WareIQ
第7章 市場機會與未來展望
According to Mordor Intelligence, the India reverse logistics market size is expected to increase from USD 35.04 billion in 2025 to USD 40.77 billion in 2026 and reach USD 84.05 billion by 2031, growing at a CAGR of 15.57% over 2026-2031.
Reverse logistics is now more closely tied to customer retention and inventory recovery, so service quality is becoming more important than pure cost control in the India reverse logistics market. This report is Segmented by Reverse Logistics Function (Transportation (Road, Air, Other Modes), Warehousing (Storage, Distribution, Consolidation), Other Value-Added Services), by End-User Industry (Consumer and Retail, Home and Decor, Healthcare and Pharmaceuticals, FMCG, Other End Users), and by Region (North, Central, West, East, South). The Market Forecasts are Provided in Terms of Value (USD).
India Reverse Logistics Market Trends and Insights
Expansion of E-Commerce Returns and Return-to-Origin Volumes: The Volume Baseline That Cannot Be Managed Away
India's online commerce base continues to expand, keeping a large pool of orders flowing into return and return-to-origin channels within the India reverse logistics market. DHL reported that 81% of internet users in India returned an online purchase in the past 12 months, which shows that returns are now a routine part of digital buying behavior. Fashion and footwear continue to generate especially heavy return traffic because size mismatch and expectation gaps remain common in organized online retail. Blue Dart stated that Tier-2 and Tier-3 cities are expected to contribute nearly 66% of new direct-to-consumer orders in FY 26, so reverse pickup density is moving beyond the largest metros. Consumer return windows under the Consumer Protection framework also keep brands under pressure to run formal return systems rather than informal recovery arrangements. This leaves providers with stronger address validation, customer intent checks, and pin-code-level routing tools better positioned in the India reverse logistics market.
Resale, Refurbishment, and Recommerce Monetization: From Cost Recovery to Revenue Generation
Returned goods are increasingly being handled as recoverable inventory rather than as a sunk cost, and that is changing how service models are built across the India reverse logistics market. Cashify stated that trade-ins grew 15-16% year over year in 2025, which shows that more consumers are entering organized exchange and upgrade programs. This shift favors operators that can inspect, grade, clean, and route goods quickly into resale or refurbishment channels. Attero's Selsmart was active across more than 19 cities and handled more than 30,000 monthly orders by August 2025, which showed that formal doorstep take-back can reach meaningful scale. The informal channel still accounts for a large share of used-device trade, so companies that can capture verified supply at pickup maintain an advantage in formal recovery. Financial Express reported stronger volume expectations for refurbished smartphones in 2026 as new device prices rose, which supports better recovery value for returned electronics.
High Reverse Handling Cost as a Share of Order Value: A Margin Problem Without a Simple Fix
Reverse handling costs continue to compress margin recovery in the India reverse logistics market, especially in low-ticket categories. Blue Dart stated that return-to-origin shipments, more than customer returns alone, are India's biggest e-commerce margin problem. GS1 India estimated in April 2026 that poor product data quality was costing the sector nearly INR 5,000 crore (USD 588 million) a year, including INR 1,900 crore (USD 2.03 billion) linked directly to reverse logistics handling and processing. COD-heavy orders remain the hardest to absorb because failed deliveries can incur forward and reverse shipping costs, with no revenue recovery. That cost floor shows that network efficiency alone is not enough; brands also need better listing quality, stronger prepaid conversion, and sharper checkout screening.
Other drivers and restraints analyzed in the detailed report include:
- E-Waste Compliance and Circular Economy Adoption: A Mandated Demand Floor
- Rapid Growth of 3PL-Led Reverse Logistics Networks: Consolidation Accelerates Capability Concentration
- Fragmented Pickup, Sorting, and Quality-Check Infrastructure Outside Tier 1 Hubs: The Bharat Commerce Gap
For complete list of drivers and restraints, kindly check the Table Of Contents.
Segment Analysis
Transportation accounted for 49.05% of the India reverse logistics market share in 2025, making it the largest functional block. This concentration reflects the scale of first-mile pickup required across millions of delivery addresses. Road transport remains the dominant sub-mode because most returns move across short and medium distances rather than by premium air lanes. The segment also benefits from the spread of reverse pickup requests across COD, exchange, refused, and damaged orders, which keeps route density high. In practice, transportation remains the service layer where pickup success, transit visibility, and resolution speed shape the customer experience most directly.
Warehousing is the fastest-growing function, and the India reverse logistics market size for this part of the chain is projected to grow at 21.58% CAGR through 2031. Returns facilities are no longer used only for storage, and operators are building inspection, grading, refurbishment, restocking, and disposal workflows into the same sites. Other value-added services carry the highest per-unit margins because they combine return processing, restocking, refurbishment, and final disposition into a single service bundle.
Complete Report Scope:
- By Reverse Logistics Function
- Transportation
- Road
- Air
- Other Modes
- Warehousing (Storage, Distribution, Consolidation)
- Other Value-added Services (Return Processing, Restocking, Refurbishment, Disposition)
- Transportation
- By End-user Industry
- Consumer and Retail
- Home and Decor
- Healthcare and Pharmaceuticals
- FMCG
- Other End Users
- By Region
- North
- Central
- West
- East
- South
List of Companies Covered in this Report:
- Blue Dart Express Limited
- Delhivery Limited
- DTDC Express Limited
- Shadowfax Technologies Private Limited
- Safexpress Private Limited
- Xpressbees
- Mahindra Logistics Limited
- TVS Supply Chain Solutions Limited
- Allcargo Gati
- DHL Express
- FedEx Corporation
- DSV (incl. DB Schenker)
- Kuehne + Nagel International AG
- Yusen Logistics Co., Ltd.
- Kintetsu World Express, Inc.
- Aramex PJSC
- Attero Recycling Private Limited
- TCI Supply Chain Solutions (TCI-SCS)
- Ekart Logistics
- CEVA Logistics (CMA CGM)
- WareIQ
Additional Benefits:
- The market estimate (ME) sheet in Excel format
- 3 months of analyst support
TABLE OF CONTENTS
1 Introduction
- 1.1 Study Assumptions & Market Definition
- 1.2 Scope of the Study
2 Research Methodology
3 Executive Summary
4 Market Landscape
- 4.1 Market Overview and Role of Reverse Logistics in Logistics
- 4.2 Market Drivers
- 4.2.1 Expansion of E-Commerce Returns and Return-to-Origin Volumes
- 4.2.2 Rising Consumer Trust Requirements for Frictionless Returns
- 4.2.3 Resale, Refurbishment, and Recommerce Monetization
- 4.2.4 Poor Product Data and Expectation Mismatch in Online Commerce
- 4.2.5 E-Waste Compliance and Circular Economy Adoption
- 4.2.6 Rapid Growth of 3PL-Led Reverse Logistics Networks
- 4.3 Market Restraints
- 4.3.1 High Reverse Handling Cost as a Share of Order Value
- 4.3.2 Fragmented Pickup, Sorting, and Quality-Check Infrastructure Outside Tier 1 Hubs
- 4.3.3 Value Erosion From Delayed Validation and Restocking
- 4.3.4 Complex Dispute Resolution for Open-Box, Damaged, and Refused Returns
- 4.4 Regulatory Framework
- 4.5 Value Chain and Distribution Channel Architecture Analysis
- 4.6 Technology Innovations Outlook
- 4.7 Porter's Five Forces
- 4.7.1 Threat of New Entrants
- 4.7.2 Bargaining Power of Suppliers
- 4.7.3 Bargaining Power of Buyers
- 4.7.4 Threat of Substitutes
- 4.7.5 Rivalry Among Competitors
- 4.8 Evolution of Reverse Logistics Requirements
- 4.9 Spotlight - India E-commerce Industry
- 4.10 Study on Changing Consumer Behavior and Preferences
- 4.11 Impact of Cost of Returns on Retailers - Analyst View
- 4.12 Impact of Geo-Political Events on Supply Chain Shifts
5 Market Size & Growth Forecasts (Value, 2026-2031)
- 5.1 By Reverse Logistics Function
- 5.1.1 Transportation
- 5.1.1.1 Road
- 5.1.1.2 Air
- 5.1.1.3 Other Modes
- 5.1.2 Warehousing (Storage, Distribution, Consolidation)
- 5.1.3 Other Value-added Services (Return Processing, Restocking, Refurbishment, Disposition)
- 5.1.1 Transportation
- 5.2 By End-user Industry
- 5.2.1 Consumer and Retail
- 5.2.2 Home and Decor
- 5.2.3 Healthcare and Pharmaceuticals
- 5.2.4 FMCG
- 5.2.5 Other End Users
- 5.3 By Region
- 5.3.1 North
- 5.3.2 Central
- 5.3.3 West
- 5.3.4 East
- 5.3.5 South
6 Competitive Landscape
- 6.1 Market Concentration
- 6.2 Key Strategic Moves
- 6.3 Market Share Analysis
- 6.4 Company Profiles (includes Global level Overview, Market level overview, Core Segments, Financials as available, Strategic Information, Market Rank/Share for key companies, Products & Services, and Recent Developments)
- 6.4.1 Blue Dart Express Limited
- 6.4.2 Delhivery Limited
- 6.4.3 DTDC Express Limited
- 6.4.4 Shadowfax Technologies Private Limited
- 6.4.5 Safexpress Private Limited
- 6.4.6 Xpressbees
- 6.4.7 Mahindra Logistics Limited
- 6.4.8 TVS Supply Chain Solutions Limited
- 6.4.9 Allcargo Gati
- 6.4.10 DHL Express
- 6.4.11 FedEx Corporation
- 6.4.12 DSV (incl. DB Schenker)
- 6.4.13 Kuehne + Nagel International AG
- 6.4.14 Yusen Logistics Co., Ltd.
- 6.4.15 Kintetsu World Express, Inc.
- 6.4.16 Aramex PJSC
- 6.4.17 Attero Recycling Private Limited
- 6.4.18 TCI Supply Chain Solutions (TCI-SCS)
- 6.4.19 Ekart Logistics
- 6.4.20 CEVA Logistics (CMA CGM)
- 6.4.21 WareIQ
7 Market Opportunities & Future Outlook
- 7.1 White-space & Unmet-Need Assessment

 2026年全球逆向物流人工智慧(AI)市場報告
 2026-2030年全球逆向物流市場
 逆向物流市場分析及預測(至2035年):依類型、產品、服務、技術、組件、應用、流程、最終使用者、解決方案、模式分類
 中國逆向物流:市場佔有率分析、產業趨勢與統計及成長預測(2026-2031)英國逆向物流:市場佔有率分析、產業趨勢與統計及成長預測(2026-2031)
 逆向物流市場預測至2034年-按退貨類型、服務、物流供應商類型、退貨管道、最終用戶和地區分類的全球分析
 全球逆向物流市場:市場規模、佔有率、趨勢和成長分析(2026-2034)逆向物流市場規模、佔有率、成長及全球產業分析:按類型、應用和地區分類,並提供 2026-2034 年的洞察和預測美國逆向物流:市場佔有率分析、產業趨勢與統計、成長預測(2026-2031)
 逆向物流市場報告:按退貨類型、服務、最終用戶和地區分類(2026-2034 年)