


 |
市場調查報告書
商品編碼
1939719
美國逆向物流:市場佔有率分析、產業趨勢與統計、成長預測(2026-2031)United States Reverse Logistics - Market Share Analysis, Industry Trends & Statistics, Growth Forecasts (2026 - 2031) |
||||||
※ 本網頁內容可能與最新版本有所差異。詳細情況請與我們聯繫。
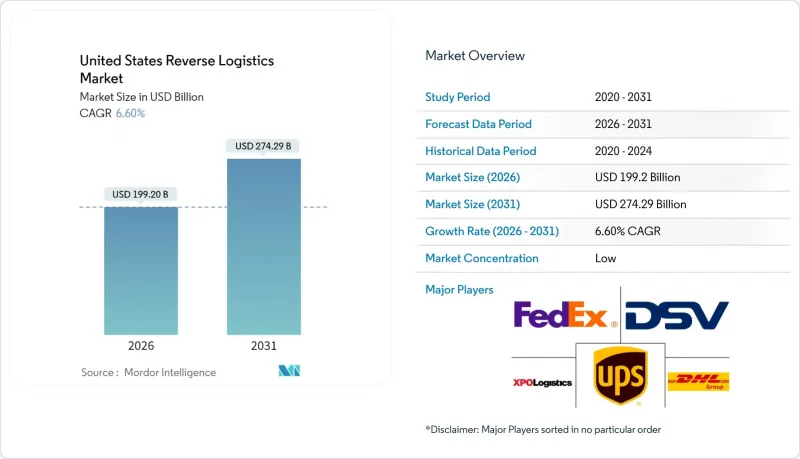
美國逆向物流市場預計到 2026 年將達到 1,992 億美元,高於 2025 年的 1,868.7 億美元,預計到 2031 年將達到 2,742.9 億美元。
預計2026年至2031年年複合成長率(CAGR)為6.6%。
推動這一成長的關鍵因素包括強勁的電子商務成長、對電子廢棄物監管力度的加大,以及旨在建立客戶忠誠度的便利退貨品牌策略。運輸成本仍然是支出中的主導因素,因為退貨商品來自數百萬個分散的地址,需要快速重新部署到中央處理中心。同時,對機器人、電腦視覺和人工智慧驅動的處置引擎等技術的投資正在降低單位成本,並迅速將退貨產品轉化為可變現的資產,從而提高回收率。隨著領先物流供應商之間的整合加劇(如2025年的一些重要收購案所示),顯然,只有那些擁有專用逆向物流網路、低溫運輸資產和合規專業知識的公司才能充分利用這一機遇。
美國逆向物流市場趨勢與洞察
電子商務的快速成長導致報酬率上升
線上消費的成長幾乎直接轉化為退貨率的上升。零售商經常遇到「分批退貨」的情況,即消費者訂購多種款式,並預期退回其中大部分,因此快速的退貨流程成為消費者購買前的一大賣點。大型宅配業者現在已將退貨取件納入最後一公里配送路線規劃,以最大限度地減少車輛空駛里程。這項調整縮短了車輛停留時間,並緩解了收貨碼頭的擁擠。配備高容量輸送機的退貨中心也在擴大規模,以應對節後退貨量的激增,並透過在48小時內補貨來防止斷貨。高效運作此流程的全國性零售商能夠回收更多營運資金,同時提升顧客終身價值。
寬鬆的退貨政策是一種競爭優勢
曾經只是一項服務,如今寬鬆的退貨期限已成為提升轉換率的關鍵。開創「先試後買」模式的D2C品牌都在尋找能夠在數小時內(而非數天)處理和退款的合作夥伴,以確保客戶滿意度。因此,逆向物流網路在地理覆蓋範圍和技術基礎設施方面與正向物流網路類似,將宅配櫃、商店櫃檯和郵寄退貨管道連接到同一個庫存雲平台。人工智慧驅動的詐欺分析能夠識別退貨率異常高的客戶,使零售商能夠在不增加損失率的情況下維持寬鬆的退貨政策。能夠掌握這種平衡的供應商正在贏得與服裝和電子產品零售商的長期合約。
高昂的運輸和處理成本
逆向物流路線本身就存在不平衡問題,卡車回程時往往只裝載了部分貨物,導致單位成本上升。燃油價格波動加劇了這項挑戰,車隊營運商也被迫遵守新的第三階段溫室氣體排放標準,這需要昂貴的設備升級。為了保障利潤率,物流供應商會在區域轉運中心整合小包裹,並協商動態回程傳輸協議以提高裝載率。然而,對於低價值商品而言,僅運輸成本就可能抵消轉售利潤,導致銷量較大的產品最終被清倉甩賣,而不是進行再製造。
細分市場分析
到2025年,運輸將占美國逆向物流市場規模的64.40%,顯示回收和再利用是價值回收的首要任務。包裹和零擔貨運公司正在部署與運輸路線相銜接的專用退貨通道,以最大限度地提高網路密度。空運繼續處理高價值和對溫度敏感的退貨,尤其是來自醫療設備業的退貨。倉儲仍然是次要的成本中心,靠近主要港口和州際公路的多客戶倉儲設施有助於縮短越庫作業貨物的週期時間。隨著品牌追求循環模式,其他附加價值服務(維修、翻新、分級、認證處置)的需求不斷成長,推動該細分市場到2031年的複合年成長率達到4.65%。將這些服務與運輸相結合的供應商透過管理整個處置鏈來獲得高額收入。
第二代設施整合了機器人分類、資料脫敏測試實驗室和電商拍照亭,使收集到的商品能夠在抵達當天上架到二手商品交易平台。這項轉型提高了美國逆向物流市場的收入,並減少了外包給清算批發商的業務。長途貨運公司也增加了碼頭分揀作業,減少了不必要的運輸里程,這表明整合在盈利能力和永續性都帶來了回報。
其他福利:
- Excel格式的市場預測(ME)表
- 3個月的分析師支持
目錄
第1章 引言
- 研究假設和市場定義
- 調查範圍
第2章調查方法
第3章執行摘要
第4章 市場情勢
- 市場概覽
- 市場促進因素
- 電子商務的快速成長正在推動退貨率上升。
- 寬鬆的退貨政策是競爭優勢之一。
- 永續性與電子廢棄物法規
- 退貨中心的自動化和機器人技術
- 人工智慧驅動的預測性效益預防分析
- 二手商品交易市場的獲利模式
- 市場限制
- 高昂的運輸和處理成本
- 全通路退貨的複雜性
- 退貨詐騙增多
- 大型物品再製造及回收能力方面的瓶頸
- 價值/供應鏈分析
- 技術展望
- 監管環境
- 波特五力模型
- 新進入者的威脅
- 供應商的議價能力
- 買方的議價能力
- 替代品的威脅
- 競爭對手之間的競爭
- 專題報導—美國電子商務產業
- 研究消費行為和偏好的變化
- 退貨成本如何影響零售商—分析師觀點
第5章 市場規模與成長預測
- 按功能
- 運輸
- 路
- 航空
- 其他交通方式
- 倉儲營運(儲存、配送、收貨)
- 其他附加價值服務(退貨處理、重新入庫、翻新、處置)
- 運輸
- 最終用戶
- 消費品及零售
- 家居與室內設計
- 醫療和藥品
- 快速消費品(日常消費品)
- 其他最終用戶
第6章 競爭情勢
- 市場集中度
- 策略趨勢
- 市佔率分析
- 公司簡介
- United Parcel Service(UPS)
- FedEx Corp.
- XPO Logistics
- DSV
- DHL Supply Chain
- CH Robinson Worldwide
- Geodis
- Yusen Logistics
- CEVA Logistics
- Kuehne+Nagel
- ShipBob
- United States Postal Service(USPS)
- Excelsior Integrated LLC
- Ryder
- Kenco Logistics
- Yellow Corporation
- RXO Inc.
- ArcBest
- AP Express
- Bluebird Express
第7章 市場機會與未來展望
United States Reverse Logistics market size in 2026 is estimated at USD 199.2 billion, growing from 2025 value of USD 186.87 billion with 2031 projections showing USD 274.29 billion, growing at 6.6% CAGR over 2026-2031.
Robust e-commerce growth, heightened regulatory scrutiny of electronic waste, and brand strategies that use friction-free returns to win customer loyalty are the chief forces behind this trajectory. Transportation continues to absorb the bulk of spending because returned items originate from millions of dispersed addresses and require rapid repositioning into central processing hubs. At the same time, technology investments in robotics, computer vision, and AI-enabled disposition engines are lowering unit costs, turning returned products into quickly monetized assets, and improving recovery rates. Consolidation among major logistics providers-underscored by headline acquisitions in 2025-signals that only operators with dedicated reverse networks, cold-chain assets, and compliance expertise can fully monetize the opportunity.
United States Reverse Logistics Market Trends and Insights
E-commerce Boom Lifting Return Volumes
Online spending growth translates almost directly into higher returns. Retailers frequently encounter "bracketing," where shoppers order multiple variants with the expectation of sending most of them back, turning reverse flow speed into a pre-purchase selling point. Major parcel carriers now embed returns pick-ups in last-mile route plans to minimize empty-truck miles, an adjustment that cuts dwell time and limits congestion at inbound docks. Returns centers equipped with high-throughput conveyors are also scaling to meet the post-holiday influx, preventing stockouts by redeploying inventory within 48 hours. National retailers that excel at this cycle improve customer lifetime value while recovering more working capital.
Liberal Returns Policies as Competitive Differentiator
Generous return windows, once a courtesy, are now pivotal to conversion. Direct-to-consumer brands that originated the "try-before-you-buy" model require partners that can process and refund within hours, not days, to maintain customer satisfaction scores. Reverse networks, therefore, mirror forward networks in geographic reach and technology stack, linking parcel lockers, in-store counters, and mail-back channels to the same inventory cloud. AI-driven fraud analytics flag unusually high-return personas, allowing retailers to sustain lenient policies without escalating shrinkage. Providers that master this balance earn sticky multi-year contracts from apparel and electronics merchants.
High Transportation & Handling Costs
Reverse lanes are inherently imbalanced, with trucks often returning partially filled, which elevates cost per unit. Fuel price volatility amplifies the challenge; fleet operators must align with emerging Phase 3 greenhouse-gas standards that require expensive equipment upgrades. To protect margins, providers consolidate parcels into regional cross-docks and negotiate dynamic backhaul agreements to boost load factors. Yet for low-value merchandise, transportation alone can erase resale profit, pushing volume toward liquidation instead of refurbishment.
Other drivers and restraints analyzed in the detailed report include:
- Sustainability & E-waste Regulations
- Automation & Robotics in Returns Centers
- Omnichannel Returns Complexity
For complete list of drivers and restraints, kindly check the Table Of Contents.
Segment Analysis
Transportation generated 64.40% of the United States Reverse Logistics market size in 2025, underscoring the primacy of collection and repositioning in value recovery. Parcel and less-than-truckload carriers have deployed dedicated returns lanes that sync with outbound routes, maximizing network density. Airfreight continues to handle high-value or temperature-sensitive returns, notably from the medical-device trade. Warehousing follows as the secondary cost center; multi-client campuses near major ports and interstates shorten cycle times for cross-docked items. Other Value-added Services (repair, refurbishment, grading, and certified destruction) capture rising demand as brands pursue circular models, propelling this sub-segment's 4.65% CAGR to 2031. Providers bundling transportation with these services command premium yields because they control the full disposition chain.
Second-generation facilities now combine robotic sortation, data-sanitized test labs, and e-commerce photo booths to list recovered items on recommerce marketplaces the same day they arrive. This shift embeds incremental revenue inside the United States Reverse Logistics market rather than outsourcing it to liquidation wholesalers. Long-haul carriers are likewise adding dockside triage to reduce wasted miles, proving that functional integration yields both margin and sustainability wins.
The United States Reverse Logistics Market Report is Segmented by Function (Transportation, Warehousing, and Other Value-Added Services), End User (Consumer & Retail, Home & Decor, Healthcare & Pharmaceuticals, FMCG, and Other End Users). The Market Forecasts are Provided in Terms of Value (USD).
List of Companies Covered in this Report:
- United Parcel Service (UPS)
- FedEx Corp.
- XPO Logistics
- DSV
- DHL Supply Chain
- C.H. Robinson Worldwide
- Geodis
- Yusen Logistics
- CEVA Logistics
- Kuehne+Nagel
- ShipBob
- United States Postal Service (USPS)
- Excelsior Integrated LLC
- Ryder
- Kenco Logistics
- Yellow Corporation
- RXO Inc.
- ArcBest
- AP Express
- Bluebird Express
Additional Benefits:
- The market estimate (ME) sheet in Excel format
- 3 months of analyst support
TABLE OF CONTENTS
1 Introduction
- 1.1 Study Assumptions & Market Definition
- 1.2 Scope of the Study
2 Research Methodology
3 Executive Summary
4 Market Landscape
- 4.1 Market Overview
- 4.2 Market Drivers
- 4.2.1 E-commerce boom lifting return volumes
- 4.2.2 Liberal returns policies as a competitive differentiator
- 4.2.3 Sustainability & e-waste regulations
- 4.2.4 Automation & robotics in returns centers
- 4.2.5 AI-driven predictive return-prevention analytics
- 4.2.6 Monetization of recommerce marketplaces
- 4.3 Market Restraints
- 4.3.1 High transportation & handling costs
- 4.3.2 Omnichannel returns complexity
- 4.3.3 Rising returns fraud
- 4.3.4 Refurbish/recycle capacity bottlenecks for bulky goods
- 4.4 Value / Supply-Chain Analysis
- 4.5 Technological Outlook
- 4.6 Regulatory Landscape
- 4.7 Porter's Five Forces
- 4.7.1 Threat of New Entrants
- 4.7.2 Bargaining Power of Suppliers
- 4.7.3 Bargaining Power of Buyers
- 4.7.4 Threat of Substitutes
- 4.7.5 Competitive Rivalry
- 4.8 Spotlight - US E-commerce Industry
- 4.9 Study on Changing Consumer Behavior & Preferences
- 4.10 Impact of Cost of Returns on Retailers - Analyst View
5 Market Size & Growth Forecasts
- 5.1 By Function
- 5.1.1 Transportation
- 5.1.1.1 Road
- 5.1.1.2 Air
- 5.1.1.3 Other Modes
- 5.1.2 Warehousing (Storage, Distribution, Consolidation)
- 5.1.3 Other Value-added Services (Return Processing, Restocking, Refurbishment, Disposition)
- 5.1.1 Transportation
- 5.2 By End User
- 5.2.1 Consumer & Retail
- 5.2.2 Home & Decor
- 5.2.3 Healthcare & Pharmaceuticals
- 5.2.4 FMCG
- 5.2.5 Other End Users
6 Competitive Landscape
- 6.1 Market Concentration
- 6.2 Strategic Moves
- 6.3 Market Share Analysis
- 6.4 Company Profiles {(includes Global level Overview, Market level overview, Core Segments, Financials as available, Strategic Information, Market Rank/Share, Products & Services, Recent Developments)}
- 6.4.1 United Parcel Service (UPS)
- 6.4.2 FedEx Corp.
- 6.4.3 XPO Logistics
- 6.4.4 DSV
- 6.4.5 DHL Supply Chain
- 6.4.6 C.H. Robinson Worldwide
- 6.4.7 Geodis
- 6.4.8 Yusen Logistics
- 6.4.9 CEVA Logistics
- 6.4.10 Kuehne+Nagel
- 6.4.11 ShipBob
- 6.4.12 United States Postal Service (USPS)
- 6.4.13 Excelsior Integrated LLC
- 6.4.14 Ryder
- 6.4.15 Kenco Logistics
- 6.4.16 Yellow Corporation
- 6.4.17 RXO Inc.
- 6.4.18 ArcBest
- 6.4.19 AP Express
- 6.4.20 Bluebird Express
7 Market Opportunities & Future Outlook
- 7.1 White-space & Unmet-need Assessment
 逆向物流市場規模、佔有率、成長及全球產業分析:按類型、應用和地區分類,並提供 2026-2034 年的洞察和預測
 逆向物流市場報告:按退貨類型、服務、最終用戶和地區分類(2026-2034 年)
 2026-2030年全球逆向物流自動化軟體市場
 逆向供應鏈解決方案市場按服務類型、技術、流程步驟、通路類型、材料類型、最終用戶和應用分類-2026-2032年全球預測日本逆向物流市場報告(依退貨類型、服務、最終用戶和地區分類,2026-2034年)
 逆向物流市場機會、成長要素、產業趨勢分析及預測(2026年至2035年)
 逆向物流市場規模、佔有率和成長分析(按退貨類型、服務、最終用戶產業和地區分類)-2026-2033年產業預測
 2032年農業價值鏈逆向物流市場預測:按產品類型、逆向物流類型、最終用戶和地區分類的全球分析可回收包裝市場預測至2032年:逆向物流-按材料、包裝類型、應用、最終用戶和地區分類的全球分析
 全球逆向物流市場