

 |
市場調查報告書
商品編碼
2097229
美國二手車市場:市場佔有率分析、產業趨勢與統計及成長預測(2026-2031)United States Used Car - Market Share Analysis, Industry Trends & Statistics, Growth Forecasts (2026 - 2031) |
||||||

※ 本網頁內容可能與最新版本有所差異。詳細情況請與我們聯繫。
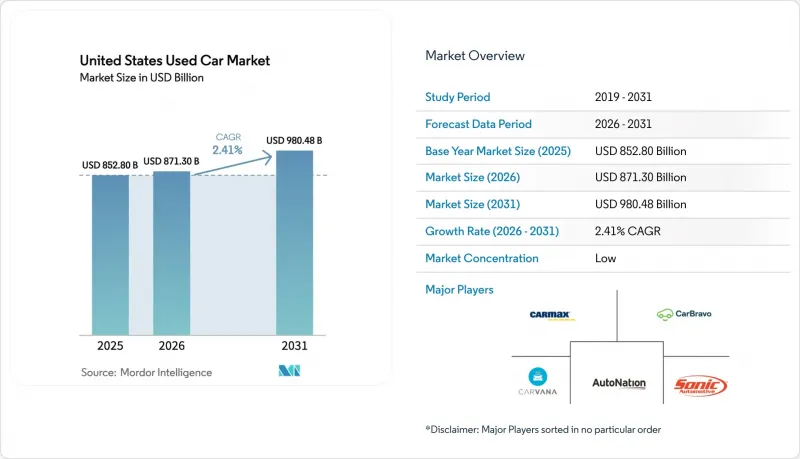
據 Mordor Intelligence 稱,2025 年美國二手車市場價值 8,528 億美元,預計到 2031 年將達到 9,804.8 億美元,而 2026 年為 8,713 億美元,預測期(2026-2031 年)的複合年成長率為 2.41%。
本報告按供應商類型(正規/非正規)、燃料類型(汽油、柴油、混合動力、電池式電動車)、車身類型(掀背車、轎車等)、銷售管道(線上/線下)和所在州/省份進行細分。市場預測以價值(美元)和銷售(輛)表示。
美國二手車市場趨勢與洞察
新車價格上漲促使那些優先考慮成本績效的買家購買汽車。
儘管2025年7月新車平均成交價達到48,841美元,但目前的月供超過700美元,這促使許多首次購車者轉向美國二手車市場。預計到2025年中期,二手車貸款的平均未償餘額為26,795美元,使其成為成本績效的購車者,甚至是信用記錄不佳者的可行選擇。這種價格差距在加州、紐約州和伊利諾伊州最為顯著,這些地區的高昂住宅進一步加重了新車的每月負擔。經銷商報告顯示,購車者的選擇正在從入門級新轎車轉向三年車齡的跨界車,這推高了對庫存新車型的需求。由於汽車製造商繼續優先生產盈利更高的卡車和SUV,價格平衡不太可能在2027年之前實現。根據 AutoNation 2024 年第四季度的披露信息,二手車的毛利率成長了 14%,這表明即使在交易放緩的情況下,透過嚴格的採購和維護,利潤率也得以維持。
擴大認證二手車(CPO)項目
豐田的經銷商參與率高達 80%,並且發現 40% 的認證二手(CPO) 買家會在四年內將車輛轉換為新款豐田,這使得原廠支持的 CPO 庫存涵蓋了更廣泛的車型。經銷商投資於內部維護,提高了銷售時的毛利率,並提升了未來新車銷售的轉換率,從而形成良性循環的獲利模式。根據 Cox Automotive 的一份報告,認證二手的銷量將在 2024 年超過二手車總銷量,這證實了買家願意為保固帶來的安心保障支付額外費用的強烈趨勢。謳歌的「精準二手車」舉措以及其他主要品牌的類似舉措,正在創造與保固相關的業務收益,從而增強經銷商的收入來源。廠商的行銷支援和低樓層平面圖融資方案為特許經銷商提供了獨立經銷商無法比擬的成本優勢。隨著保固期的延長,買家對舊車的風險感知降低,即使利率上升,銷售仍保持穩定。
利率上升使購屋負擔加重。
根據TransUnion發布的數據,2025年第三季美國二手車貸款的平均每月還款額約為538美元,反映利率上升導致借貸成本增加。汽車貸款拖欠率(逾期60天或以上)約為1.45%,較上年略有上升,顯示信貸狀況正逐漸承壓。次級貸款借款人需支付比優質貸款借款人更高的利率,這導致他們的購買力下降。貸款機構普遍收緊了貸款標準,要求更高的首付比例和更低的貸款價值比(LTV)。由於聯準會維持高利率政策,預計2026年,借貸成本仍將居高不下,消費者難以獲得緩解。
細分市場分析
到2025年,連鎖經銷商將佔據美國二手車市場51.27%的佔有率,預計到2031年將以7.41%的複合年成長率成長,這主要得益於規模經濟帶來的批量採購優勢以及技術的快速普及。 PriceVantage透過幫助早期採用者將存貨周轉提高了五倍,證明了其數據驅動方法的有效性。 Lithia Motors在2024年第三季售出了84,251輛二手車,使其每輛車的毛利提高到2,115美元。特許經營集團受益於跨多個地點攤銷軟體成本以及更低的庫存融資利率。獨立經銷商目前仍佔48.73%的銷售額,但由於線上定價的透明度降低了他們的定價自主權,利潤率正面臨壓力。許多經銷商被迫依賴高風險的「先買後付」(BHPH)融資模式,這限制了他們在數位化方面的投資。
產業整合仍在持續,AutoNation、Penske 和 Sonic 等公司計劃在 2024 年新增多家銷售據點,私募股權投資活動也日益活躍。大型集團在其 75% 至 80% 的交易中加入了金融和保險 (F&I) 產品,使每輛車的利潤增加了 1500 至 2000 美元。同時,獨立經銷商的 F&I 合約比例僅 50% 左右,利潤差距進一步擴大。由於利潤率下降和翻新成本上升,小規模經銷商擴大選擇與能夠擴展其技術和物流基礎設施的大型網路進行銷售或建立合作關係。
即使到了2025年,汽油動力車仍將佔據美國二手車市場84.28%的佔有率,但預計到2031年,電池式電動車(BEV)的年複合成長率將達到7.78%。根據Recurrent Auto的研究顯示,2024年二手電動車價格下降了25%,許多車型的價格區間降至2.5萬至2.8萬美元。美國財政部記錄顯示,截至2024年5月,在稅收抵免政策終止之前,二手電動車的稅額扣抵交易量已達1.5萬筆。赫茲公司在2024年初處置了2萬輛電動車,增加了電動車的供應量,並使轉售價格趨於正常化。儘管稅額扣抵已經結束,但由於電動車的能源成本和維護費用較低,人們對電動車的興趣依然濃厚,尤其是在充電網路發達的沿海大都會圈。
隨著消費者在追求燃油效率的同時不再擔憂續航里程,混合動力汽車的需求穩步成長,而柴油車的市場佔有率則因日益嚴格的排放氣體法規而不斷萎縮。預計到2024年,特斯拉Model 3的折舊免稅額將低於汽油車,這意味著其殘值更加穩定,從而提振了二手車市場。經銷商正在推廣「終身燃油節省」計算工具,以抵消高額貸款利息,而製造商提供的8年電池保固也緩解了消費者對電池耐用性的擔憂。此外,各州強制推行零排放汽車等外部因素預計將繼續推動電動車市場佔有率的上升趨勢。
其他好處:
- Excel格式的市場預測(ME)表
- 3個月的分析師支持
目錄
第1章:引言
- 研究假設和市場定義
- 調查範圍
第2章:調查方法
第3章執行摘要
第4章 市場狀況
- 市場概覽
- 市場促進因素
- 新車價格上漲促使那些優先考慮成本績效的買家購買汽車。
- 擴大認證二手車(CPO)項目
- 根據《通貨膨脹控制法案》(IRA) 提供的 4,000 美元二手電動車補貼正在刺激二手電動車市場的需求。
- 原始設備製造商 (OEM) 的訂閱-轉售循環正在推動最新車型的供應。
- 人工智慧驅動的動態定價引擎正在提高經銷商的盈利。
- 透過經銷商主導的宅配物流擴大市場覆蓋範圍
- 市場限制因素
- 高利率會抑制購買力。
- 疫情後,租期0-4年的房產供應短缺。
- 批發競標價格正常化,利潤率降低
- 各州關於「維修權」的數據法規推高了維修成本。
- 價值/供應鏈分析
- 監理情勢
- 技術展望
- 波特五力模型
第5章 市場規模與成長預測
- 供應商
- 組織
- 雜亂無章
- 按燃料類型
- 汽油
- 柴油引擎
- 混合
- 電池式電動車
- 依體型
- 掀背車
- 轎車
- 運動型多用途車(SUV)/多用途車(MPV)
- 皮卡車和廂型車
- 按銷售管道
- 離線
- 線上
- 按州
- 加州
- 德克薩斯州
- 佛羅裡達
- 紐約
- 伊利諾州
- 賓州
- 俄亥俄州
- 喬治亞
- 北卡羅來納州
- 華盛頓州
- 美國及其他地區
第6章 競爭情勢
- 市場集中度
- 策略趨勢
- 市佔率分析
- 公司簡介
- CarMax Inc.
- Carvana Co.
- AutoNation Inc.
- Lithia Motors Inc.
- Sonic Automotive Inc.
- Penske Automotive Group
- Berkshire Hathaway Automotive
- Group 1 Automotive Inc.
- Asbury Automotive Group
- Hendrick Automotive Group
- CarBravo
- DriveTime Automotive Group
- Cox Automotive(Autotrader, KBB)
- TrueCar Inc.
- Cars.com Inc.
- ACV Auctions Inc.
- Manheim
第7章 市場機會與未來展望
According to Mordor Intelligence, the United States used car market size was valued at USD 852.80 billion in 2025 and estimated to grow from USD 871.30 billion in 2026 to reach USD 980.48 billion by 2031, at a CAGR of 2.41% during the forecast period (2026-2031).
This report is Segmented by Vendor Type (Organized and Unorganized), Fuel Type (Gasoline, Diesel, Hybrid, and Battery Electric), Body Type (Hatchback, Sedan, and More), Sales Channel (Online and Offline), and State. The Market Forecasts are Provided in Terms of Value (USD) and Volume (Units).
United States Used Car Market Trends and Insights
Rising New-Vehicle Prices Driving Value-Seeking Buyers
Average new-car transaction prices reached USD 48,841 in July 2025, yet the typical monthly payment now runs above USD 700, steering many first-time purchasers into the United States used car market. Loan balances on used cars averaged USD 26,795 in mid-2025, giving value-oriented shoppers a viable substitute when credit is tight. The affordability gap is widest in California, New York, and Illinois, where housing costs magnify the burden of a new-car payment. Dealers report that buyers who once considered entry-level new sedans are shifting toward three-year-old crossovers, lifting demand for late-model inventory. Pricing parity is unlikely before 2027 because automakers continue prioritizing profitable trucks and sport utility vehicles (SUVs). AutoNation's Q4 2024 disclosure showed used-vehicle gross profit up 14%, proving that disciplined sourcing and reconditioning sustain margin even when transactions slow.
Expansion of Certified Pre-Owned Programs
OEM-backed CPO inventory now covers a broader range of models after Toyota achieved 80% dealer participation and observed that 40% of CPO customers transition into a new Toyota within four years. Dealers that invest in on-site reconditioning reap higher front-end gross and future new-car conversions, creating a virtuous margin loop. Cox Automotive noted that certified pre-owned sales outpaced overall used volume in 2024, confirming strong buyer willingness to pay for warranty peace of mind. Acura's Precision Used initiative and similar offerings from mainstream brands generate warranty-linked service revenue and strengthen dealer profit streams. Manufacturer marketing support and lower floor-plan rates provide franchise stores with cost advantages that independents cannot match. As warranty coverage stretches, buyers see less risk in older vehicles, sustaining volume despite higher interest charges.
Higher Interest-Rate Environment Suppressing Affordability
In Q3 2025, the average used-vehicle monthly loan payment in the United States was approximately USD 538, according to the data released by TransUnion, reflecting higher borrowing costs amid rising interest rates. Delinquency rates for auto loans (60+ days past due) were around 1.45%, slightly higher than the previous year, showing moderate credit performance pressure. Subprime borrowers faced higher interest rates than prime borrowers, contributing to affordability challenges. Lenders generally maintained tighter credit standards, requiring larger down payments and lower loan-to-value ratios. With the Federal Reserve keeping policy rates elevated, borrowing costs are expected to remain high into 2026, limiting relief for consumers.
Other drivers and restraints analyzed in the detailed report include:
- IRA USD 4,000 Used-EV Credit Energizing Secondary EV Demand
- OEM Subscription-to-Resale Loops Boosting Late-Model Supply
- Post-Pandemic Shortage of 0-4-Year Lease Returns
For complete list of drivers and restraints, kindly check the Table Of Contents.
Segment Analysis
Organized dealers controlled 51.27% of the United States used car market share in 2025 and are set to grow at a 7.41% CAGR through 2031 as scale allows bulk buying and rapid tech deployment. PriceVantage improved inventory turns fivefold for early adopters, illustrating data-driven gains. Lithia Motors retailed 84,251 used units in Q3 2024 and lifted gross per unit to USD 2,115. Franchise groups amortize software costs across many rooftops and benefit from lower floor-plan interest rates. Independents, still handling 48.73% of volume, face margin compression as online transparency narrows pricing latitude. Many must rely on buy-here-pay-here financing that carries higher default risk, limiting capital for digital upgrades.
Consolidation continues: AutoNation, Penske, and Sonic each added multiple rooftops in 2024, and private equity remains active. Large groups attach Finance and Insurance (F&I) products to 75-80% of transactions, boosting per-unit profit by USD 1,500-2,000. Independents manage closer to 50%, widening the earnings gap. With thin margins and rising recon costs, small lots increasingly sell or partner with larger networks that can extend technology and logistics infrastructure.
Gasoline vehicles still represented 84.28% of the United States used car market size in 2025, yet battery-electric units are growing at a 7.78% CAGR to 2031. Recurrent Auto recorded a 25% decline in used-EV prices during 2024, placing many models in the USD 25,000-28,000 range. The Treasury logged 15,000 used-EV credit transactions by May 2024 before the incentive's repeal. Hertz's early-2024 liquidation of 20,000 EVs widened supply and normalized resale talk tracks. Although the credit ended, lower energy and maintenance costs sustain interest, particularly in coastal metros with mature charging networks.
Hybrid demand grows modestly as buyers seek efficiency without range anxiety, while diesel share erodes under tighter emissions rules. Tesla Model 3 depreciation narrowed against gasoline peers in 2024, signaling stabilizing residuals that encourage secondary buyers. Dealers market lifetime fuel-savings calculators to offset higher financing rates, and manufacturers' eight-year battery warranties assuage durability concerns. Externalities such as state zero-emission vehicle mandates will keep the electric share trending upward.
Complete Report Scope:
- By Vendor Type
- Organized
- Unorganized
- By Fuel Type
- Gasoline
- Diesel
- Hybrid
- Battery-Electric
- By Body Type
- Hatchback
- Sedan
- Sport Utility Vehicle (SUV)/Multi-Purpose Vehicle (MPV)
- Pickup and Van
- By Sales Channel
- Offline
- Online
- By State
- California
- Texas
- Florida
- New York
- Illinois
- Pennsylvania
- Ohio
- Georgia
- North Carolina
- Washington
- Rest of United States
List of Companies Covered in this Report:
- CarMax Inc.
- Carvana Co.
- AutoNation Inc.
- Lithia Motors Inc.
- Sonic Automotive Inc.
- Penske Automotive Group
- Berkshire Hathaway Automotive
- Group 1 Automotive Inc.
- Asbury Automotive Group
- Hendrick Automotive Group
- CarBravo
- DriveTime Automotive Group
- Cox Automotive (Autotrader, KBB)
- TrueCar Inc.
- Cars.com Inc.
- ACV Auctions Inc.
- Manheim
Additional Benefits:
- The market estimate (ME) sheet in Excel format
- 3 months of analyst support
TABLE OF CONTENTS
1 Introduction
- 1.1 Study Assumptions and Market Definition
- 1.2 Scope of the Study
2 Research Methodology
3 Executive Summary
4 Market Landscape
- 4.1 Market Overview
- 4.2 Market Drivers
- 4.2.1 Rising New-Vehicle Prices Driving Value-Seeking Buyers
- 4.2.2 Expansion of Certified Pre-Owned (CPO) Programs
- 4.2.3 Inflation Reduction Act (IRA) USD 4k Used-EV Credit Energizing Secondary EV Demand
- 4.2.4 Original Equipment Manufacturer Subscription-to-Resale Loops Boosting Late-Model Supply
- 4.2.5 AI-Driven Dynamic-Pricing Engines Lifting Dealer Profitability
- 4.2.6 Dealer-Built Home-Delivery Logistics Widening Catchment Areas
- 4.3 Market Restraints
- 4.3.1 Higher Interest-Rate Environment Suppressing Affordability
- 4.3.2 Post-Pandemic Shortage of 0-4-Yr Lease Returns
- 4.3.3 Normalizing Wholesale Auction Prices, Compressing Margins
- 4.3.4 State "Right-to-Repair" Data Rules Raising Reconditioning Costs
- 4.4 Value/Supply-Chain Analysis
- 4.5 Regulatory Landscape
- 4.6 Technological Outlook
- 4.7 Porter's Five Forces
- 4.7.1 Threat of New Entrants
- 4.7.2 Bargaining Power of Buyers
- 4.7.3 Bargaining Power of Suppliers
- 4.7.4 Threat of Substitutes
- 4.7.5 Intensity of Competitive Rivalry
5 Market Size and Growth Forecasts (Value (USD) and Volume (Units))
- 5.1 By Vendor Type
- 5.1.1 Organized
- 5.1.2 Unorganized
- 5.2 By Fuel Type
- 5.2.1 Gasoline
- 5.2.2 Diesel
- 5.2.3 Hybrid
- 5.2.4 Battery-Electric
- 5.3 By Body Type
- 5.3.1 Hatchback
- 5.3.2 Sedan
- 5.3.3 Sport Utility Vehicle (SUV)/Multi-Purpose Vehicle (MPV)
- 5.3.4 Pickup and Van
- 5.4 By Sales Channel
- 5.4.1 Offline
- 5.4.2 Online
- 5.5 By State
- 5.5.1 California
- 5.5.2 Texas
- 5.5.3 Florida
- 5.5.4 New York
- 5.5.5 Illinois
- 5.5.6 Pennsylvania
- 5.5.7 Ohio
- 5.5.8 Georgia
- 5.5.9 North Carolina
- 5.5.10 Washington
- 5.5.11 Rest of United States
6 Competitive Landscape
- 6.1 Market Concentration
- 6.2 Strategic Moves
- 6.3 Market Share Analysis
- 6.4 Company Profiles (Includes Global Level Overview, Market Level Overview, Core Segments, Financials as Available, Strategic Information, Market Rank/Share for Key Companies, Products and Services, SWOT Analysis, and Recent Developments)
- 6.4.1 CarMax Inc.
- 6.4.2 Carvana Co.
- 6.4.3 AutoNation Inc.
- 6.4.4 Lithia Motors Inc.
- 6.4.5 Sonic Automotive Inc.
- 6.4.6 Penske Automotive Group
- 6.4.7 Berkshire Hathaway Automotive
- 6.4.8 Group 1 Automotive Inc.
- 6.4.9 Asbury Automotive Group
- 6.4.10 Hendrick Automotive Group
- 6.4.11 CarBravo
- 6.4.12 DriveTime Automotive Group
- 6.4.13 Cox Automotive (Autotrader, KBB)
- 6.4.14 TrueCar Inc.
- 6.4.15 Cars.com Inc.
- 6.4.16 ACV Auctions Inc.
- 6.4.17 Manheim
7 Market Opportunities and Future Outlook
- 7.1 White-Space and Unmet-Need Assessment

 二手車市場-2026-2032年全球市場預測
 日本二手車市場:市佔率分析、產業趨勢與統計及成長預測(2026-2031)泰國二手車市場:市場佔有率分析、產業趨勢與統計及成長預測(2026-2031)
 二手車交易服務市場:依車輛類型、燃料類型、銷售管道、銷售形式及地區分類。
 二手電動車市場規模、佔有率和成長分析:按車輛類型、驅動方式、年份、續航里程、電池狀況、電池容量和地區分類-2026-2033年產業預測
 2026-2030年全球二手車市場二手車市場:依供應商、車款、銷售管道、地區分類
 全球二手車市場規模、佔有率、趨勢和成長分析報告(2026-2034)
 二手半拖車市場分析及預測(至2035年):按類型、產品類型、服務、技術、組件、應用、流程及最終用戶二手東南亞二手車市場:市場佔有率分析、產業趨勢與統計、成長預測(2026-2031)