


 |
市場調查報告書
商品編碼
2097209
亞太地區潤滑油市場:市場佔有率分析、產業趨勢與統計及成長預測(2026-2031年)Asia-Pacific Lubricants - Market Share Analysis, Industry Trends & Statistics, Growth Forecasts (2026 - 2031) |
||||||

※ 本網頁內容可能與最新版本有所差異。詳細情況請與我們聯繫。
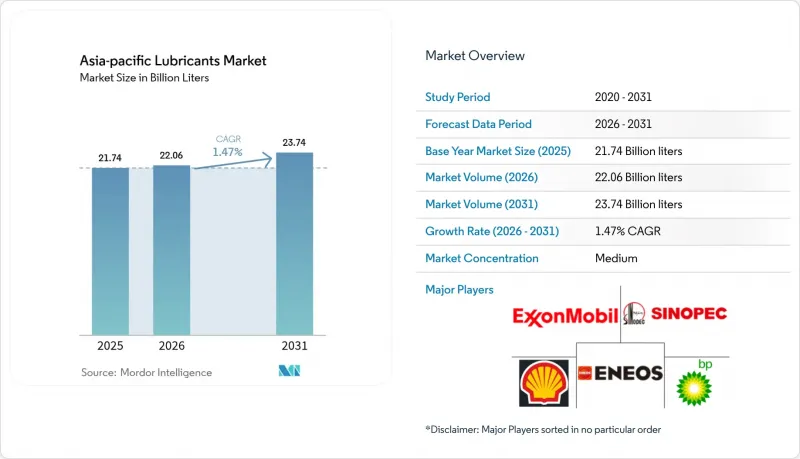
據 Mordor Intelligence 稱,2025 年亞太地區潤滑油市值為 217.4 億公升,預計到 2031 年將達到 237.4 億公升,而 2026 年為 220.6 億公升,預測期(2026-2031 年)複合年成長率為 1.47%。
本報告按產品類型(汽車引擎油、工業引擎油等)、終端用戶產業(汽車、船舶、航太、重型機械、工業)、基礎油類型(礦物油、合成油、半合成油、生物基油)和地區(中國、印度、日本、韓國、印尼等)進行細分。市場預測以銷售量(公升)為單位。
亞太地區潤滑油市場趨勢及洞察。
非公路應用領域的需求阻礙了電氣化進程。
在施工機械、採礦和農業機械領域,高性能液壓油和齒輪油仍然至關重要,因為電力驅動系統目前仍無法滿足所需的功率密度。印尼偏遠礦區和印度大規模道路建設計畫所使用的設備,其單位潤滑油消耗量甚至高於乘用車。惡劣的運作環境意味著重型機械的換油週期較短,從而促進了潤滑油的重複購買。 SK Enmove 正利用其在電動車冷卻液領域的專業知識,為非公路應用配製高品質合成潤滑油,從而鞏固其在亞太地區的地位。設備使用壽命的延長以及電氣化帶來的風險有限,正在創造可預測的需求,從而保護亞太地區潤滑油市場免受乘用車行業不利因素的影響。
東協地區OEM工廠訂單激增
汽車製造商擴大選擇簽訂多年期工廠灌裝契約,以確保符合保固要求並降低庫存成本。泰國和馬來西亞的組裝廠更傾向於使用單一供應商的潤滑油,這樣可以簡化品質審核流程並方便服務培訓。馬來西亞國家石油公司潤滑油國際公司(Petronas Lubricants International)推出了針對此類合約的中檔潤滑油,幫助汽車製造商在控制成本的同時達到更高的性能標準。此類合約可確保供應商獲得穩定的銷售量,為汽車製造商提供一致的售後服務訊息,並強化東協各國政府優先考慮的在地採購規則。隨著越南和菲律賓新建汽車工廠的運作,這一趨勢正在擴展,從而推動亞太潤滑油市場的銷售量成長。
縮短換油週期可以降低油耗。
渦輪增壓汽油缸內直噴引擎如今運作更清潔,工作溫度更高,因此保養週期可延長至1萬英里,換油頻率也比傳統設計降低了一半。日本汽車製造商正在推廣使用具有高基礎油黏度保持能力的0W-20機油,進一步延長都市區的保養週期。 SAE GLV-2標準是延長換油週期的基礎,目前正被東南亞國協的組裝迅速採用。儘管合成機油生產商的市佔率不斷擴大,但每輛車的機油總用量卻在下降,導致亞太地區乘用車潤滑油市場銷售量下滑。
細分市場分析
預計到2025年,機油將佔亞太地區潤滑油市場佔有率的41.92%,凸顯其在該地區大規模的內燃機汽車保有量中的關鍵作用。即使在電氣化程度不斷提高的背景下,摩托車和二手車仍然是引擎油銷售量的強勁驅動力,尤其是在印度、印尼和越南。該地區的高階市場主要以合成油為主,因為汽車製造商需要0W-20及以下黏度等級的機油才能滿足其車輛保有量目標。大型柴油車換油週期的縮短在一定程度上抵消了乘用車銷售的下滑,使機油供應商的銷售量保持基準。相較之下,受自動變速箱和無段變速箱(CVT)普及的推動,變速箱油預計到2031年將以1.98%的複合年成長率成長,成為所有產品類型中成長最快的。隨著道路擁塞日益嚴重,東協地區許多消費者正從手排車轉向自排車,而每輛車使用的自排變速箱油(ATF)量超過了手排變速箱齒輪油,從而推高了每輛車對潤滑油的需求。然而,由於變速箱的保固期延長,供應商繼續專注於研發耐高溫、可延長保養週期的潤滑油。
二線產品線的發展動能各不相同。齒輪油受益於澳洲和印尼採礦業的擴張,這些地區極端的負荷要求使用添加了鉬粉的高黏度配方。液壓油受益於施工機械和工廠自動化的普及,尤其是在機器人取代人工組裝的領域。加工油的成長則更為穩健,這得益於印度和中國輪胎及紡織業的蓬勃發展。金屬加工液受益於製造業的強勁成長,但由於切削技術的效率提高,其面臨降低單件耗油量的挑戰。渦輪機油和變壓器油的發展與發電能力的提升同步,越南和菲律賓正在建造的新型燃氣渦輪機電廠採用了能夠承受更高進氣溫度的高品質合成酯。
其他好處:
- Excel格式的市場預測(ME)表
- 3個月的分析師支持
目錄
第1章:引言
- 研究假設和市場定義
- 調查範圍
第2章:調查方法
第3章執行摘要
第4章 市場狀況
- 市場概覽
- 市場促進因素
- 非公路用車輛對耐電氣化潤滑油的需求
- 東協地區OEM工廠合約數量激增。
- 亞太地區更嚴格的燃油效率標準(中國 VI-b、印度 CAFE III)
- 印度和印尼內陸物流走廊的快速發展
- 進程內流體分析能夠根據當前狀態自訂補液週期。
- 在脆弱生態系統中推廣可生物分解基礎油的區域性舉措
- 市場限制因素
- 縮短配備內燃機(ICE)的乘用車潤滑油更換週期
- 從中東進口的第二類/第三類基礎油價格波動很大。
- 政府補貼主要針對電動車動力傳動系統總成零件製造商。
- 適用於高階車輛的 OEM 認證終身免維護變速箱
- 價值鏈分析
- 法律規範
- 終端用戶趨勢
- 汽車產業
- 製造業
- 發電業
- 波特五力模型
第5章 市場規模與成長預測
- 依產品類型
- 汽車引擎油
- 工業機油
- 變速箱油
- 齒輪油
- 煞車油
- 油壓
- 潤滑脂
- 加工油(包括橡膠加工油和白油)
- 切削用潤滑液
- 渦輪機油
- 變壓器油
- 其他產品類型
- 按最終用戶行業分類
- 車
- 搭乘用車
- 商用車輛
- 摩托車
- 海上
- 航太
- 重型機械
- 建造
- 礦業
- 農業
- 產業
- 發電
- 冶金與金屬加工
- 紡織品
- 石油和天然氣
- 其他終端用戶產業
- 車
- 依基材類型
- 礦物油性潤滑劑
- 合成潤滑油
- 半合成潤滑油
- 生物性潤滑劑
- 按地區
- 中國
- 印度
- 日本
- 韓國
- 印尼
- 泰國
- 馬來西亞
- 越南
- 菲律賓
- 其他亞太國家
第6章 競爭情勢
- 市場集中度
- 策略趨勢
- 市佔率和排名分析
- 公司簡介
- Bharat Petroleum Corporation Ltd.
- BP plc(Castrol)
- Chevron Corporation
- ENEOS Holdings
- ExxonMobil Corporation
- FUCHS SE
- GS Caltex
- Hindustan Petroleum Corporation Ltd.
- Idemitsu Kosan Co. Ltd
- Indian Oil Corporation Limited
- Motul SA
- PetroChina Company Limited
- Repsol SA
- Shell plc
- Sinopec(China Petrochemical Corporation)
- SK Lubricants Co. Ltd.
- TotalEnergies SE
- Valvoline Global
- ZHONGTIAN PETROCHEMICAL
第7章 市場機會與未來展望
第8章:執行長面臨的關鍵策略挑戰
According to Mordor Intelligence, the Asia-Pacific lubricants market size was valued at 21.74 billion liters in 2025 and estimated to grow from 22.06 billion liters in 2026 to reach 23.74 billion liters by 2031, at a CAGR of 1.47% during the forecast period (2026-2031).
This report is Segmented by Product Type (Automotive Engine Oil, Industrial Engine Oil, and More), End-User Industry (Automotive, Marine, Aerospace, Heavy Equipment, and Industrial), Base Stock Type (Mineral Oil-Based, Synthetic, Semi-Synthetic, and Bio-Based), and Geography (China, India, Japan, South Korea, Indonesia, and More). The Market Forecasts are Provided in Terms of Volume (Liters).
Asia-Pacific Lubricants Market Trends and Insights
Electrification-Resistant Demand in Off-Highway Applications
Construction, mining, and agricultural machines continue relying on high-performance hydraulic fluids and gear oils because electric drivetrains cannot yet match the required power density. Remote Indonesian mining sites and India's large road-building projects depend on equipment that consumes greater lubricant volumes per unit than passenger cars. Heavy-duty drain intervals remain short due to abrasive environments, sustaining repeat purchases. SK Enmove leverages its expertise in electric-vehicle (EV) cooling fluids to formulate premium off-highway synthetics, thereby strengthening its regional position. Extended equipment life cycles and limited electrification risk yield predictable demand that cushions the Asia-Pacific Lubricants Market against passenger-car headwinds.
Surge in OEM Factory-Fill Contracts Across ASEAN
Automakers are increasingly signing multi-year factory-fill agreements to ensure warranty compliance and reduce inventory costs. Thai and Malaysian assembly plants prefer single-sourced blends that streamline quality audits and simplify service training. PETRONAS Lubricants International launched mid-tier formulations targeting these contracts, helping OEMs maintain cost discipline while meeting higher performance thresholds. Such agreements lock in steady volumes for suppliers, give OEMs consistent after-sales messaging, and reinforce local-content rules that ASEAN governments prioritize. The pattern expands to Vietnam and the Philippines as new auto plants come online, reinforcing regional volumes for the Asia-Pacific Lubricants Market.
Shrinking Drain Intervals Compress Volume Consumption
Turbocharged gasoline direct-injection engines now run cleaner and hotter, allowing for 10,000-mile service schedules that halve the frequency of lubricant changes compared to legacy designs. Japanese OEMs standardize 0W-20 oils with higher base-number retention, further extending urban service intervals. The SAE GLV-2 specification underpins these extended drains and has been rapidly adopted across ASEAN assembly lines. While synthetic producers gain market share, total liters per vehicle decline, resulting in a reduction in passenger-car volumes within the Asia-Pacific Lubricants Market.
Other drivers and restraints analyzed in the detailed report include:
- Stricter APAC Fuel-Efficiency Norms Drive Low-Viscosity Adoption
- Rapid Infrastructure Development Fuels Commercial Vehicle Demand
- Base Oil Price Volatility Pressures Margin Stability
For complete list of drivers and restraints, kindly check the Table Of Contents.
Segment Analysis
Engine oil held 41.92% of the Asia-Pacific Lubricants Market share in 2025, underscoring its pivotal role in the region's large internal-combustion fleet. Despite electrification, two-wheelers and used cars continue to drive robust engine oil volumes, particularly in India, Indonesia, and Vietnam. The segment's premium tier skews toward synthetics as OEMs demand 0W-20 and lower grades to hit fleet targets. Lower drain intervals in heavy-duty diesel units partly offset the reductions in passenger-car units, maintaining baseline volumes for engine oil suppliers. In contrast, transmission fluids are projected to grow at a 1.98% CAGR to 2031, the fastest among product categories, driven by the uptake of automatic and continuously variable transmissions (CVTs). Many ASEAN consumers are shifting from manual gearboxes as road congestion rises, which is boosting per-vehicle lubricant demand because ATF fill volumes exceed those of manual gear oils. Longer transmission warranties, however, keep suppliers focused on high-thermal-stability fluids that lengthen service intervals.
Second-tier product lines show varied momentum. Gear oils benefit from tailwinds generated by mining expansions in Australia and Indonesia, where extreme loads necessitate high-viscosity formulations with micronized molybdenum. Hydraulic fluids benefit from the proliferation of construction equipment and factory automation, especially where robotics replace manual assembly. Process oils advance at a steadier pace thanks to the growth of the tire and textile industries in India and China. Metalworking fluids ride the manufacturing upswing but face efficiency gains in cutting technology that lower per-part consumption. Turbine and transformer oils track power-generation capacity additions, with new gas-turbine plants in Vietnam and the Philippines adopting premium synthetic esters that withstand higher inlet temperatures.
Complete Report Scope:
- By Product Type
- Automotive Engine Oil
- Industrial Engine Oil
- Transmission Fluids
- Gear Oil
- Brake Fluids
- Hydraulic Fluids
- Greases
- Process Oil (Including Rubber Process Oil and White Oil)
- Metalworking Fluids
- Turbine Oil
- Transformer Oil
- Other Product Types
- By End-user Industry
- Automotive
- Passenger Vehicles
- Commercial Vehicles
- Two-Wheelers
- Marine
- Aerospace
- Heavy Equipment
- Construction
- Mining
- Agriculture
- Industrial
- Power Generation
- Metallurgy and Metalworking
- Textiles
- Oil and Gas
- Other End-Use Industries
- Automotive
- By Base Stock Type
- Mineral Oil-Based Lubricants
- Synthetic Lubricants
- Semi-Synthetic Lubricants
- Bio-Based Lubricants
- By Geography
- China
- India
- Japan
- South Korea
- Indonesia
- Thailand
- Malaysia
- Vietnam
- Philippines
- Rest of Asia-Pacific
List of Companies Covered in this Report:
- Bharat Petroleum Corporation Ltd.
- BP plc (Castrol)
- Chevron Corporation
- ENEOS Holdings
- ExxonMobil Corporation
- FUCHS SE
- GS Caltex
- Hindustan Petroleum Corporation Ltd.
- Idemitsu Kosan Co. Ltd
- Indian Oil Corporation Limited
- Motul SA
- PetroChina Company Limited
- Repsol S.A.
- Shell plc
- Sinopec (China Petrochemical Corporation)
- SK Lubricants Co. Ltd.
- TotalEnergies SE
- Valvoline Global
- ZHONGTIAN PETROCHEMICAL
Additional Benefits:
- The market estimate (ME) sheet in Excel format
- 3 months of analyst support
TABLE OF CONTENTS
1 Introduction
- 1.1 Study Assumptions and Market Definition
- 1.2 Scope of the Study
2 Research Methodology
3 Executive Summary
4 Market Landscape
- 4.1 Market Overview
- 4.2 Market Drivers
- 4.2.1 Electrification-resistant lubricant demand in off-highway fleets
- 4.2.2 Surge in OEM factory-fill contracts across ASEAN
- 4.2.3 Stricter APAC fuel-efficiency norms (China VI-b, India CAFE III)
- 4.2.4 Rapid build-out of inland logistics corridors in India and Indonesia
- 4.2.5 In-process fluid analytics enabling condition-based refill cycles
- 4.2.6 Regional push for biodegradable base stocks in sensitive ecosystems
- 4.3 Market Restraints
- 4.3.1 Shrinking lubricant drain intervals in ICE passenger cars
- 4.3.2 Volatile Group II/III base-oil import prices from Middle East
- 4.3.3 Government subsidies tilting toward EV power-train component makers
- 4.3.4 OEM-endorsed lifetime-fill transmissions in premium vehicles
- 4.4 Value Chain Analysis
- 4.5 Regulatory Framework
- 4.6 End-User Trends
- 4.6.1 Automotive Industry
- 4.6.2 Manufacturing Industry
- 4.6.3 Power Generation Industry
- 4.7 Porter's Five Forces
- 4.7.1 Bargaining Power of Suppliers
- 4.7.2 Bargaining Power of Buyers
- 4.7.3 Threat of New Entrants
- 4.7.4 Threat of Substitutes
- 4.7.5 Degree of Competition
5 Market Size and Growth Forecasts (Volume)
- 5.1 By Product Type
- 5.1.1 Automotive Engine Oil
- 5.1.2 Industrial Engine Oil
- 5.1.3 Transmission Fluids
- 5.1.4 Gear Oil
- 5.1.5 Brake Fluids
- 5.1.6 Hydraulic Fluids
- 5.1.7 Greases
- 5.1.8 Process Oil (Including Rubber Process Oil and White Oil)
- 5.1.9 Metalworking Fluids
- 5.1.10 Turbine Oil
- 5.1.11 Transformer Oil
- 5.1.12 Other Product Types
- 5.2 By End-user Industry
- 5.2.1 Automotive
- 5.2.1.1 Passenger Vehicles
- 5.2.1.2 Commercial Vehicles
- 5.2.1.3 Two-Wheelers
- 5.2.2 Marine
- 5.2.3 Aerospace
- 5.2.4 Heavy Equipment
- 5.2.4.1 Construction
- 5.2.4.2 Mining
- 5.2.4.3 Agriculture
- 5.2.5 Industrial
- 5.2.5.1 Power Generation
- 5.2.5.2 Metallurgy and Metalworking
- 5.2.5.3 Textiles
- 5.2.5.4 Oil and Gas
- 5.2.5.5 Other End-Use Industries
- 5.2.1 Automotive
- 5.3 By Base Stock Type
- 5.3.1 Mineral Oil-Based Lubricants
- 5.3.2 Synthetic Lubricants
- 5.3.3 Semi-Synthetic Lubricants
- 5.3.4 Bio-Based Lubricants
- 5.4 By Geography
- 5.4.1 China
- 5.4.2 India
- 5.4.3 Japan
- 5.4.4 South Korea
- 5.4.5 Indonesia
- 5.4.6 Thailand
- 5.4.7 Malaysia
- 5.4.8 Vietnam
- 5.4.9 Philippines
- 5.4.10 Rest of Asia-Pacific
6 Competitive Landscape
- 6.1 Market Concentration
- 6.2 Strategic Moves
- 6.3 Market Share (%)/Ranking Analysis
- 6.4 Company Profiles (includes Global level Overview, Market level overview, Core Segments, Financials as available, Strategic Information, Market Rank/Share, Products and Services, Recent Developments)
- 6.4.1 Bharat Petroleum Corporation Ltd.
- 6.4.2 BP plc (Castrol)
- 6.4.3 Chevron Corporation
- 6.4.4 ENEOS Holdings
- 6.4.5 ExxonMobil Corporation
- 6.4.6 FUCHS SE
- 6.4.7 GS Caltex
- 6.4.8 Hindustan Petroleum Corporation Ltd.
- 6.4.9 Idemitsu Kosan Co. Ltd
- 6.4.10 Indian Oil Corporation Limited
- 6.4.11 Motul SA
- 6.4.12 PetroChina Company Limited
- 6.4.13 Repsol S.A.
- 6.4.14 Shell plc
- 6.4.15 Sinopec (China Petrochemical Corporation)
- 6.4.16 SK Lubricants Co. Ltd.
- 6.4.17 TotalEnergies SE
- 6.4.18 Valvoline Global
- 6.4.19 ZHONGTIAN PETROCHEMICAL
7 Market Opportunities and Future Outlook
- 7.1 White-space and Unmet-need Assessment
8 Key Strategic Questions for CEOs

 外科潤滑劑市場-全球市場預測(2026-2032年)潤滑油市場-2026-2032年全球市場預測大豆油基潤滑劑市場-2026-2032年全球市場預測
 印度潤滑油物流:市場佔有率分析、產業趨勢與統計及成長預測(2026-2031)拉絲潤滑劑市場:2026-2032年全球市場預測(依產品類型、添加劑類型、線材、基礎油、應用、終端用戶產業及銷售管道分類)開式齒輪潤滑劑:市場佔有率分析、產業趨勢與統計、成長預測(2026-2031)
 潤滑油和潤滑脂市場預測至2034年-按產品類型、基礎油、增稠劑類型、應用、最終用戶、分銷管道和地區分類的全球分析菲律賓潤滑油市場:市場佔有率分析、產業趨勢與統計及成長預測(2026-2031)
 特種潤滑油市場-全球產業規模、佔有率、趨勢、機會、預測:按類型、最終用戶、地區和競爭格局分類,2021-2031年
 鑽井潤滑劑市場規模、佔有率和成長分析:按產品類型、應用、功能和地區分類-2026-2033年產業預測