


 |
市場調查報告書
商品編碼
2073560
南美洲船用燃料:市場佔有率分析、行業趨勢和統計數據以及成長預測(2026-2031 年)South America Bunker Fuel - Market Share Analysis, Industry Trends & Statistics, Growth Forecasts (2026 - 2031) |
||||||

※ 本網頁內容可能與最新版本有所差異。詳細情況請與我們聯繫。
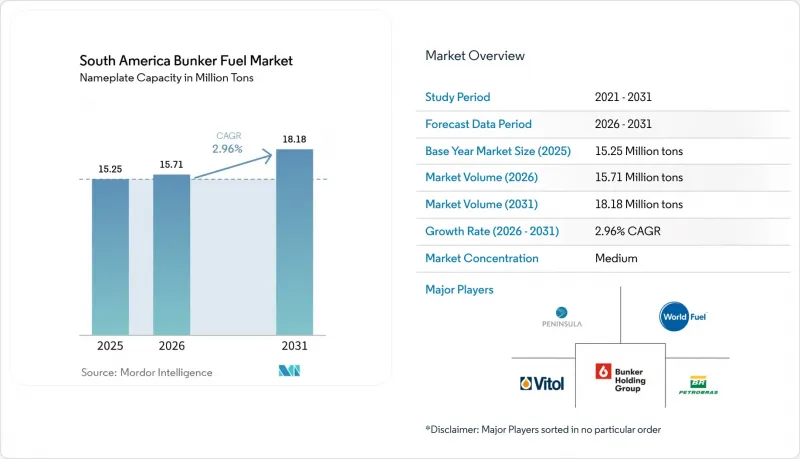
根據 Mordor Intelligence 預測,南美洲船用燃料市場(按額定產能計算)預計將從 2025 年的 1525 萬噸和 2026 年的 1571 萬噸成長到 2031 年的 1818 萬噸,2026 年至 2031 年的年複合成長率(CAGR)為 2.96%。
本報告按燃料類型(高硫燃料油、超低硫燃料油、超低硫燃料油、船用輕柴油、液化天然氣、甲醇、生物/合成燃料、氨等)、加油方式(船對船、港對船、液化天然氣駁船對船、可攜式儲罐/集裝箱)、船舶類型(貨櫃船、油輪、散裝船、普通船、美國船舶/美國地區)。
南美船用燃料市場趨勢與洞察
南美洲主要商品海運量增加
大豆、玉米、鐵礦石、銅和鋰的出口增加了大西洋和太平洋主要港口的航次數量,持續支撐著船用燃料油的需求。 2024年,巴西出口了1.02億噸大豆和5,500萬噸玉米。同時,淡水河谷運輸了3.8億噸鐵礦石,主要出口到中國。智利出口了550萬噸銅和18萬噸碳酸鋰,為瓦爾帕萊索、聖安東尼奧和金特羅港的船用燃料油裝載提供了強勁支撐。阿根廷的瓦卡穆埃爾塔管線計畫將於2027年投入使用,屆時將可裝載超大型原油運輸船(VLCC),從而進一步刺激蓬塔科羅拉達港的裝載需求。由於運輸時間延長抵消了航速降低帶來的燃料成本節約,大宗商品流通仍強勁。隨著基礎設施擴建計畫持續到2028年,這種對南美洲船用燃料油市場的中期影響將進一步鞏固。
得到符合 IMO 2020 標準的燃料轉換獎勵和當地硫稅減免的支持。
監管機構已推出降低成本的措施,以獎勵使用低硫燃料的船舶。巴西國家水文局規定,使用含硫量低於0.10%燃料的船舶可免繳額外港口費用;阿根廷海軍警衛隊(Prefectura Naval)則為使用符合ISO 8217標準的燃料的船舶提供錨碇減免。智利已加速從含硫量3.5%的重質燃料油(HSFO)到低硫燃料油(VLSFO)和船用柴油(MGO)的過渡,以期在2025年前達到國際海事組織(IMO)2020的要求。這些措施迫使船東在未來兩年內安裝脫硫裝置或改用符合標準的燃料。預計這些措施也將為基於碳排放強度的差異化港口收費樹立先例,從而促進新興的液化天然氣(LNG)和甲醇供應鏈的發展。
原油價格的持續波動會影響船用燃料油價格的穩定性。
2025年,布蘭特原油價格在每桶70至90美元之間波動,桑托斯和布宜諾斯艾利斯的低硫燃料油(VLSFO)和高硫燃料油(HSFO)價格月度波動幅度達15%至20%。簽訂固定價格合約的船東面臨利潤率壓力,噹噹地溢價超過基準樞紐價格每噸30美元時,他們往往會推遲加油。 2025年,南美洲僅有22%的交易量基於季度固定價格契約,遠低於新加坡的45%。這迫使交易商準備更多營運資金。衍生性商品市場的流動性有限(南美洲在全球船用燃料互換交易中佔比不到2%),限制了風險管理的選擇。
細分市場分析
2025年,高硫燃料油(HSFO)在南美船用燃料市場仍佔43.8%的佔有率。這主要得益於大量配備脫硫裝置的油輪和散裝貨船,這些船舶可以合法使用含硫量為3.5%的燃料。儘管液化天然氣(LNG)的處理量目前小規模,但預計將以13.3%的複合年成長率成長。隨著雙燃料船舶數量的增加,預計液化天然氣將逐步蠶食高硫燃料油的市場佔有率。超低硫燃料油(VLSFO)供應給沒有廢氣淨化系統的貨櫃船和雜貨船,而船用輕柴油(MGO)則滿足了對燃料品質要求嚴格的輔助引擎的特定需求。由於引擎和處理基礎設施的限制,甲醇、氨和合成燃料仍在研發中,但一些班輪營運商已訂購了可使用甲醇燃料的船舶,計劃從2027年開始投入使用。 2025年,生質燃料儲槽約佔供應量的1.2%,其發展趨勢將取決於原料的經濟效益。能否實現與船用輕柴油(MGO)的成本持平,將決定這一類別能否在早期採用者需求之外進一步擴大。
在南美船用燃料市場,如果規劃中的12個碼頭陸上基礎設施能夠順利建成,液化天然氣(LNG)的市場佔有率預計將從2025年的95萬噸增至2031年的200萬噸以上。 2025年,交付桑托斯港的LNG平均價格為每百萬英熱單位(MMBtu)14美元。以能量當量計算,這相當於比超低硫燃料油(VLSFO)降低了12%至15%的燃料成本,但由於雙燃料引擎的資本折舊,這一差距將在20年內逐漸縮小。超低硫燃料油(ULSFO)在進入南美洲以外受排放管制水域的船舶中仍佔有一席之地,但由於南美需求有限,混合燃料的供應仍然緊張。在南美船用燃料市場,在分配高硫燃料油(HSFO)、超低硫燃料油(VLSFO)、LNG和新興替代燃料的船用燃料預算時,成本、監管合規性和基礎設施成熟度之間的平衡始終是需要考慮的因素。
其他好處:
- Excel格式的市場預測(ME)表
- 3個月的分析師支持
目錄
第1章:引言
- 研究假設和市場定義
- 調查範圍
第2章:調查方法
第3章執行摘要
第4章 市場狀況
- 市場概覽
- 市場促進因素
- 南美洲主要商品海運量增加
- 獎勵和區域硫稅減免,以鼓勵燃料轉型符合 IMO-2020 標準。
- 鹽鹽層下原油出口的擴張正在推動巴西和烏拉圭等樞紐地區的燃料庫需求。
- 巴拿馬運河擴建後,亞洲和南美洲之間貨櫃航運航線的港口停靠次數激增。
- 巴西石油公司出售煉油廠將鼓勵第三方石油供應商競爭。
- 試點規模的生物庫(B24-B30)認證為低碳混合物提供了開創性的優勢。
- 市場限制因素
- 原油價格的持續波動正在影響船用燃料油價格的穩定性。
- 大西洋和太平洋沿岸液化天然氣燃料庫基礎設施發展落後。
- 品管問題:該地區 VLSFO/HSFO 的不合格率超過 5.9%。
- 原料(大豆油、甲醇)的競爭增加了生物樣本庫部署的成本。
- 供應鏈分析
- 監理情勢
- 技術展望
- 波特五力模型
第5章 市場規模與成長預測
- 按燃料類型
- 高硫燃料油(HSFO)
- 超低硫燃料油(VLSFO)
- 超低硫燃料油(ULSFO)
- 船用柴油燃料(MGO)
- 液化天然氣(LNG)
- 甲醇
- 生物/合成燃料
- 氨
- 其他燃料類型
- 透過加油方法
- 船對船
- 從港口到船舶(卡車/管道)
- 從液化天然氣駁船到船舶
- 可攜式儲罐和容器
- 按船舶類型
- 容器
- 油船
- 散貨船
- 普通貨物
- 客運/滾裝船
- 海上及特種船舶
- 按地區
- 巴西
- 阿根廷
- 智利
- 其他南美國家
第6章 競爭情勢
- 市場集中度
- 策略趨勢(併購、聯盟、購電協議)
- 市場佔有率分析(主要公司的市場排名和佔有率)
- 公司簡介
- Vitol Holding BV
- Monjasa Holding A/S
- Bunker Holding A/S
- World Fuel Services Corp
- Peninsula Petroleum Ltd
- TotalEnergies SE
- Chevron Corp
- Petrobras
- Integr8 Fuels
- Trafigura Group Pte
- Aegean Marine Petroleum
- Repsol SA
- ExxonMobil Corp
- Bomin Bunker Oil Corp
- PetroEcuador
- YPF SA
- AP Moller-Maersk A/S
- Mediterranean Shipping Company SA
- CMA CGM Group
- China COSCO Shipping
- Hapag-Lloyd AG
- Ocean Network Express
第7章 市場機會與未來展望
According to Mordor Intelligence, the south america bunker fuel market size in terms of nameplate capacity is projected to expand from 15.25 million tons in 2025 and 15.71 million tons in 2026 to 18.18 million tons by 2031, registering a CAGR of 2.96% between 2026 to 2031.
This report is Segmented by Fuel Type (HSFO, VLSFO, ULSFO, MGO, LNG, Methanol, Bio-/Synthetic Fuels, Ammonia, and More), Bunkering Method (Ship-To-Ship, Port-To-Ship, LNG Barge-To-Ship, and Portable Tanks and Containers), Vessel Type (Container, Tanker, Bulk Carrier, General Cargo, Passenger/Ro-Pax, and Offshore and Specialized), and Geography (Brazil, Argentina, Chile, and Rest of South America).
South America Bunker Fuel Market Trends and Insights
Rising Marine Transportation Of Essential Commodities In South America
Exports of soybeans, corn, iron ore, copper, and lithium continue to lift voyage counts and sustain bunker demand across major Atlantic and Pacific ports. Brazil shipped 102 million tons of soybeans and 55 million tons of corn in 2024, while Vale moved 380 million tons of iron ore primarily to China. Chile exported 5.5 million tonnes of copper and 180,000 tons of lithium carbonate, feeding steady bunker liftings at Valparaiso, San Antonio, and Quintero. Argentina's Vaca Muerta pipeline project will allow very large crude carriers to load by 2027, creating additional uplift demand at Punta Colorada. Commodity flows remain resilient because longer transit times offset slow-steaming fuel savings. Infrastructure expansions scheduled through 2028 will cement this medium-term influence on the South America bunker fuel market.
Supportive IMO-2020 Compliant Fuel-Switching Incentives And Local Sulfur-Tax Breaks
Regulators introduced cost-relief mechanisms that reward vessels burning lower-sulfur fuels. Brazil's National Waterway Transport Agency waives port-fee surcharges for fuels at or below 0.10% sulfur, and Argentina's Prefectura Naval grants dockage-fee reductions for ISO 8217-compliant deliveries. Chile aligned with IMO 2020 requirements in 2025, accelerating the shift from 3.5% sulfur HSFO to VLSFO and MGO. These measures prompt shipowners to retrofit scrubbers or switch to compliant fuels within the next two years. They also establish a precedent for differentiated port charges tied to carbon intensity, likely supporting emerging LNG and methanol supply chains.
Persistent Crude-Price Volatility Impacting Bunker Price Stability
Brent crude oscillated between USD 70 and USD 90 per barrel during 2025, driving 15-20% monthly swings in VLSFO and HSFO prices at Santos and Buenos Aires. Shipowners on fixed freight contracts experience margin pressure and often defer bunkering when local premiums exceed USD 30 per ton relative to benchmark hubs. Only 22% of South American volumes moved under quarterly fixed-price deals in 2025, far below Singapore's 45% share, which forces traders to hold larger working-capital buffers. Limited derivative liquidity, South America accounts for less than 2% of global marine-fuel swaps, hampers risk-management options.
Other drivers and restraints analyzed in the detailed report include:
- Accelerating Pre-Salt Crude Exports Boosting Demand At Brazilian And Uruguayan Hubs
- Rapid Port-Call Growth On Asia-South America Container Loops
- Delayed LNG Bunkering Infrastructure Build-Out Across Atlantic And Pacific Coasts
For complete list of drivers and restraints, kindly check the Table Of Contents.
Segment Analysis
High-sulfur fuel oil retained 43.8% of the South America bunker fuel market share in 2025, supported by a large fleet of scrubber-equipped tankers and bulk carriers that can legally consume 3.5% sulfur fuel. LNG volumes, though smaller, are projecting a 13.3% CAGR that will steadily erode HSFO share as more dual-fuel vessels enter service. VLSFO serves container and general-cargo vessels that have not installed exhaust-gas-cleaning systems, while MGO fills niche auxiliary-engine demand where fuel-quality thresholds are strict. Methanol, ammonia, and synthetic fuels remain embryonic because engines and handling infrastructure are limited, yet multiple liner operators have placed methanol-capable vessels on order for post-2027 deployment. Bio-bunkers occupied roughly 1.2% of 2025 volumes and hinge on feedstock economics; cost parity with MGO will determine whether the category scales beyond early-adopter volumes.
The South America bunker fuel market size attributable to LNG could rise from 950,000 tons in 2025 to more than 2 million tons by 2031 if shore-side infrastructure reaches the planned twelve terminals. Delivered LNG in Santos averaged USD 14 per MMBtu in 2025, which equates to a 12-15% fuel-cost saving versus VLSFO on an energy-equivalent basis, although capital amortization for dual-fuel engines narrows the margin over a 20-year horizon. ULSFO retains a niche role for vessels entering emission-control areas outside the region, but limited South American demand keeps blended supply tight. The South America bunker fuel market continues to balance cost, compliance, and infrastructure maturity when allocating bunker-fuel budgets across HSFO, VLSFO, LNG, and emerging alternatives.
Complete Report Scope:
- By Fuel Type
- High-Sulfur Fuel Oil (HSFO)
- Very-Low-Sulfur Fuel Oil (VLSFO)
- Ultra-Low-Sulfur Fuel Oil (ULSFO)
- Marine Gas Oil (MGO)
- Liquefied Natural Gas (LNG)
- Methanol
- Bio-/Synthetic Fuels
- Ammonia
- Other Fuel Types
- By Bunkering Method
- Ship-to-Ship
- Port-to-Ship (Truck/Pipeline)
- LNG Barge-to-Ship
- Portable Tanks and Containers
- By Vessel Type
- Container
- Tanker
- Bulk Carrier
- General Cargo
- Passenger/Ro-Pax
- Offshore and Specialized
- By Geography
- Brazil
- Argentina
- Chile
- Rest of South America
List of Companies Covered in this Report:
- Vitol Holding BV
- Monjasa Holding A/S
- Bunker Holding A/S
- World Fuel Services Corp
- Peninsula Petroleum Ltd
- TotalEnergies SE
- Chevron Corp
- Petrobras
- Integr8 Fuels
- Trafigura Group Pte
- Aegean Marine Petroleum
- Repsol SA
- ExxonMobil Corp
- Bomin Bunker Oil Corp
- PetroEcuador
- YPF SA
- AP Moller-Maersk A/S
- Mediterranean Shipping Company SA
- CMA CGM Group
- China COSCO Shipping
- Hapag-Lloyd AG
- Ocean Network Express
Additional Benefits:
- The market estimate (ME) sheet in Excel format
- 3 months of analyst support
TABLE OF CONTENTS
1 Introduction
- 1.1 Study Assumptions & Market Definition
- 1.2 Scope of the Study
2 Research Methodology
3 Executive Summary
4 Market Landscape
- 4.1 Market Overview
- 4.2 Market Drivers
- 4.2.1 Rising marine transportation of essential commodities in South America
- 4.2.2 Supportive IMO-2020-compliant fuel-switching incentives & local sulfur-tax breaks
- 4.2.3 Accelerating pre-salt crude exports driving bunkering demand at Brazilian & Uruguayan hubs
- 4.2.4 Rapid port-call growth on Asia-South America container loops post-Panama Canal expansions
- 4.2.5 Petrobras refinery divestments unlocking third-party physical supply and price competition
- 4.2.6 Pilot-scale bio-bunker (B24-B30) certification creating first-mover advantage for low-carbon blends
- 4.3 Market Restraints
- 4.3.1 Persistent crude-price volatility impacting bunker price stability
- 4.3.2 Delayed LNG bunkering infrastructure build-out across Atlantic & Pacific coasts
- 4.3.3 Quality-control issues: VLSFO/HSFO off-spec rates >5.9 % in region
- 4.3.4 Feedstock competition inflating bio-bunker input costs (soy oil, methanol)
- 4.4 Supply-Chain Analysis
- 4.5 Regulatory Landscape
- 4.6 Technological Outlook
- 4.7 Porter's Five Forces
- 4.7.1 Bargaining Power of Suppliers
- 4.7.2 Bargaining Power of Consumers
- 4.7.3 Threat of New Entrants
- 4.7.4 Threat of Substitutes
- 4.7.5 Intensity of Competitive Rivalry
5 Market Size & Growth Forecasts
- 5.1 By Fuel Type
- 5.1.1 High-Sulfur Fuel Oil (HSFO)
- 5.1.2 Very-Low-Sulfur Fuel Oil (VLSFO)
- 5.1.3 Ultra-Low-Sulfur Fuel Oil (ULSFO)
- 5.1.4 Marine Gas Oil (MGO)
- 5.1.5 Liquefied Natural Gas (LNG)
- 5.1.6 Methanol
- 5.1.7 Bio-/Synthetic Fuels
- 5.1.8 Ammonia
- 5.1.9 Other Fuel Types
- 5.2 By Bunkering Method
- 5.2.1 Ship-to-Ship
- 5.2.2 Port-to-Ship (Truck/Pipeline)
- 5.2.3 LNG Barge-to-Ship
- 5.2.4 Portable Tanks and Containers
- 5.3 By Vessel Type
- 5.3.1 Container
- 5.3.2 Tanker
- 5.3.3 Bulk Carrier
- 5.3.4 General Cargo
- 5.3.5 Passenger/Ro-Pax
- 5.3.6 Offshore and Specialized
- 5.4 By Geography
- 5.4.1 Brazil
- 5.4.2 Argentina
- 5.4.3 Chile
- 5.4.4 Rest of South America
6 Competitive Landscape
- 6.1 Market Concentration
- 6.2 Strategic Moves (M&A, Partnerships, PPAs)
- 6.3 Market Share Analysis (Market Rank/Share for key companies)
- 6.4 Company Profiles (includes Global level Overview, Market level overview, Core Segments, Financials as available, Strategic Information, Products & Services, and Recent Developments)
- 6.4.1 Vitol Holding BV
- 6.4.2 Monjasa Holding A/S
- 6.4.3 Bunker Holding A/S
- 6.4.4 World Fuel Services Corp
- 6.4.5 Peninsula Petroleum Ltd
- 6.4.6 TotalEnergies SE
- 6.4.7 Chevron Corp
- 6.4.8 Petrobras
- 6.4.9 Integr8 Fuels
- 6.4.10 Trafigura Group Pte
- 6.4.11 Aegean Marine Petroleum
- 6.4.12 Repsol SA
- 6.4.13 ExxonMobil Corp
- 6.4.14 Bomin Bunker Oil Corp
- 6.4.15 PetroEcuador
- 6.4.16 YPF SA
- 6.4.17 AP Moller-Maersk A/S
- 6.4.18 Mediterranean Shipping Company SA
- 6.4.19 CMA CGM Group
- 6.4.20 China COSCO Shipping
- 6.4.21 Hapag-Lloyd AG
- 6.4.22 Ocean Network Express
7 Market Opportunities & Future Outlook
- 7.1 White-space & Unmet-Need Assessment

 船用燃料市場:依燃料類型、船舶類型、運作模式、船用引擎類型、最終用戶和通路分類-2026-2032年全球市場預測
 新加坡船用燃料:市場佔有率分析、產業趨勢與統計、成長預測(2026-2031)美國船用燃料:市場佔有率分析、行業趨勢和統計數據、成長預測(2026-2031 年)船用燃料:市場佔有率分析、行業趨勢和統計數據、成長預測(2026-2031 年)
 液化天然氣作為船用燃料的市場:按船舶類型和地區分類船用燃料市場:依燃料等級、船舶類型和地區分類
 船用燃料市場規模、佔有率和趨勢分析報告:按燃料類型、應用、地區和細分市場預測(2026-2033 年)
 全球船用燃料油市場規模、佔有率、趨勢和成長分析報告(2026-2034年)
 船用燃料市場規模、佔有率、趨勢及預測(按燃料類型、船舶類型、銷售商及地區分類),2026-2034年
 2026年全球船用燃料市場報告