

 |
市場調查報告書
商品編碼
2073521
教育機器人:市場佔有率分析、產業趨勢與統計、成長預測(2026-2031)Educational Robot - Market Share Analysis, Industry Trends & Statistics, Growth Forecasts (2026 - 2031) |
||||||
※ 本網頁內容可能與最新版本有所差異。詳細情況請與我們聯繫。
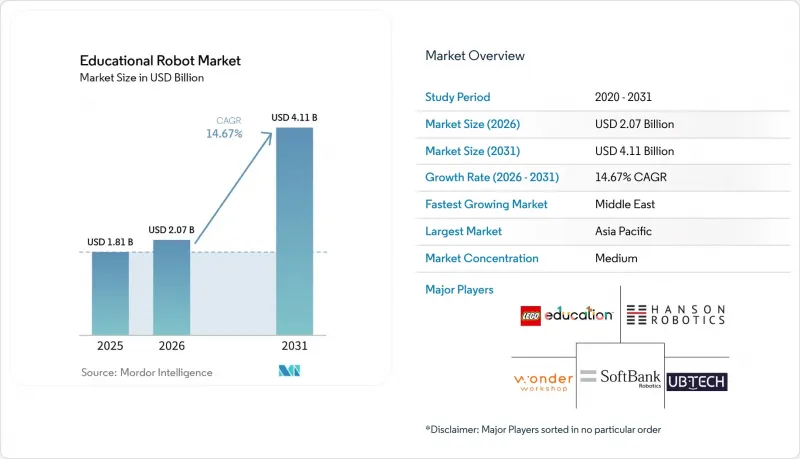
根據 Mordor Intelligence 預測,教育機器人市場規模將從 2025 年的 18.1 億美元成長到 2026 年的 20.7 億美元,到 2031 年將達到 41.1 億美元,2026 年至 2031 年的複合年成長率為 14.67%。
本報告按類型(人形和非人形)、組件(硬體、軟體、服務)、教育階段(學前教育、小學教育及其他)、學習模式(程式設計和STEM、語言及其他)、最終用戶(學校、大學及其他)以及地區(北美、南美、歐洲、亞太、中東和非洲)進行細分。市場預測以美元計價。
全球教育機器人市場趨勢與洞察
在歐洲各地的中小學強制推行機器人課程
歐盟委員會的《2025年STEM教育戰略計畫》要求所有成員國在2027-2028學年之前將運算思維和機器人技術納入K-12關鍵標準。目前,各國教育部門優先選擇能夠保證符合CE標準的硬體和課程相容性的ISO認證供應商,並正在就多年框架協議進行談判。芬蘭累計1.2億歐元(約1.356億美元),計畫在2025年前為2,400所小學安裝相關設備;德國則根據其「數位契約2.0」指令,計畫在2028年前獲得5億歐元(約5.65億美元)的資金。該指令規定,STEM課程中至少10%的時間必須用於機器人技術教學,這將使受影響的教室數量加倍,並將設備更換週期從損耗劣化調整為與課程修訂週期同步。透過將購買力轉移到國家機構,這項法規穩定了需求預測,並鼓勵供應商投資於在地化內容和長期專業發展服務。
政府資助的STEM舉措旨在促進北美大學的採購
美國國家科學基金會(NSF) 於 2025 年擴大了其 RITEL 項目,承諾在三年內投入 8,500 萬美元,並規定其中 40% 的津貼必須用於為資金不足的教育機構購置硬體。這使得先前因缺乏資金而難以實施的人形機器人研究平台得以惠及那些歷來支持黑人和西班牙裔學生的大學。同時,加拿大的同類機構 NSERC 也投入了 6,000 萬加元(約 4,440 萬美元)建立 15 個區域機器人中心。受津貼機構需發布開放原始碼課程模組,這不僅降低了後續使用者開發內容的成本,也加速了機器人技術在最初津貼機構以外的推廣應用。這些大學提供的經同儕審查的證據正被納入各學區的採購流程,從而降低了人們的感知風險,並進一步推動了教育機器人市場成本的下降。
歐洲雲端連接機器人根據 GDPR 的資料隱私合規成本
根據《一般資料保護規範》(GDPR),供應商將面臨高達2000萬歐元(2322萬美元)或其全球收入4%的罰款,這迫使他們實施用戶同意流程、進行影響評估並接受第三方審計,而這些費用在歐洲每個學區將高達5萬至15萬歐元(5.65萬至16.95萬美元)。 IT預算低於每位學生120歐元(135美元)的學區難以負擔這些費用,減緩了歐盟在南歐和東歐的推廣應用。 「隱私設計」條款將處理環節轉移到了設備端,導致邊緣人工智慧晶片組件的成本增加了30%至40%。不符合合規要求的競標將被淘汰,例如法國在2024年取消了一項價值1200萬美元的競標。域外適用意味著即使是歐盟以外的供應商也必須任命一名歐盟資料保護官,這每年會增加 4 萬至 8 萬美元的額外開支,給成本低於 500 美元的機器人的利潤率帶來壓力。
細分市場分析
預計到2025年,人形機器人將佔據教育機器人市場49.13%的佔有率,並在2031年之前以15.03%的複合年成長率持續成長。它們類人的設計,支援眼神交流、手勢姿態辨識和空間距離識別,符合特殊教育和語言習得框架,因此政府機構在以合規性為導向的競標中優先考慮這些型號。一項2024年的研究表明,與使用平板電腦相比,兒童在使用人形機器人輔導時,注意力持續時間延長了42%。 NAO和Yanshee透過課程合作,減少了教師的備課時間,從而在市場中佔據主導地位。
非人形平台,例如輪式探測車和模組化套件,正在編程和創客空間主導,因為學校可以用購買兩套人形機器人的價格購買一套教室規模的套件。耐用性的提升將更換週期延長至七年,促使供應商捆綁雲端內容以維持獲利。隨著治療機器人獲得FDA批准,保險報銷也開始將人形機器人的採購納入臨床預算,這進一步加劇了高階社交學習設備和注重性價比的STEM套件之間的市場分化。
預計2025年,教育機器人市場中硬體將佔58.36%,軟體成長速度最快,複合年成長率將達到16.17%。學區每年為每位學生支付5至15美元,用於購買與Google Classroom和Canvas整合的課程庫,從而減輕教師的實施負擔。目前,美國62%的學區強制實施單一登入(SSO),這不僅帶來了技術障礙,也帶來了整合完成後轉換的成本。
隨著伺服馬達壽命達到5萬次循環,學校也延長了更換週期,硬體成長速度正在放緩。雖然業務收益滲透率仍然較低,但提供多年教師培訓的供應商報告稱,接受超過20小時培訓的教師會將機器人融入日常教學,使解約率降低25%。長期趨勢預計將是朝著「軟體定義課堂」的方向發展,其中硬體作為持久耐用的終端,而分析和人工智慧驅動的個人化引擎則將學習數據貨幣化。
區域分析
預計到2025年,亞太地區將佔全球銷售額的34.40%,主要得益於中國面向全國20多萬所小學的AI素養教育政策。日本已投入120億日圓(約8,040萬美元)用於補貼,首爾的一個試點計畫使學生的英語程度提高了18%。印度的「國家教育政策」提倡從小學六年級開始學習編程,但由於每位學生的IT預算僅為15-30美元,實施進度緩慢。在澳大利亞,私立學校的情況尤其突出,68%的機器人套件部署在收費學校,而這些學校的學生僅佔全國學生總數的35%。
預計到2025年,北美將佔據28%的市場佔有率,但由於部署飽和度以及學生人數下降帶來的財政壓力,成長速度正在放緩。美國國家科學基金會資助的中心和第一類計畫正在推進機器人向服務不足的學區部署,但由於海關糾紛,在墨西哥國家科學基金會的試點計畫被推遲。
到2025年,歐洲將佔據24%的市場佔有率,即將實施的強制性課程將發揮主導作用,但同時也受到遵守《一般資料保護規則》(GDPR)的限制。芬蘭和德國已加速了初期投資,但南歐國家卻面臨人均IT預算不到120歐元(135美元)的困境。
中東地區,以沙烏地阿拉伯和阿拉伯聯合大公國主導,憑藉「2030願景」計畫中用於支援都市區機器人實驗室的企業社會責任資金,實現了該地區最高的複合年成長率(CAGR),達到17.92%。南美洲正努力應對巴西高達60%的關稅和外匯波動,但阿根廷已計劃在2025年前部署800套機器人套件。非洲則受到農村青年數位技能普及率低(僅9%)的限制,預計到2025年這一比例仍將低於5%。
其他好處:
- Excel格式的市場預測(ME)表
- 3個月的分析師支持
目錄
第1章:引言
- 研究假設和市場定義
- 調查範圍
第2章:調查方法
第3章執行摘要
第4章 市場狀況
- 市場概覽
- 市場促進因素
- 在東亞地區引進人工智慧社交機器人進行幼兒語言教學
- 歐洲各地K-12學校的機器人學必修課程
- 政府資助的STEM舉措旨在促進北美大學的採購
- 中國教育伺服馬達和感測器的平均售價正在下降。
- 北美遠距和混合式學習的激增正在推動遠距臨場系統教育機器人的應用。
- 企業社會責任(CSR)預算用於支援中東公立學校的機器人實驗室
- 市場限制因素
- 熱帶地區教室連續使用電池組時故障率高。
- 非拉丁字母地區缺乏人形機器人多語言內容庫。
- 由於 GDPR 的規定,歐洲雲端連接機器人的資料隱私合規成本增加。
- 非洲農村地區缺乏合格的機器人技術指導員
- 產業價值鏈分析
- 監理展望
- 技術展望
- 宏觀經濟因素對市場的影響
- 波特五力分析
- 投資分析(資金籌措、併購、創業投資趨勢)
第5章 市場規模與成長預測
- 按類型
- 人形
- 非人形
- 按組件
- 硬體
- 軟體
- 服務
- 依教育程度
- 學前班(幼兒園)
- 小學教育
- 中等教育
- 高等教育
- 特殊教育
- 學習模式/透過應用程式
- 程式設計和STEM
- 語言學習
- 人工智慧與機器人研究
- 特殊需求治療
- 遠距臨場系統與遠距教學
- 最終用戶
- 學校
- 大學和學院
- 職業培訓機構
- 教育科技公司
- 特殊需求教育中心
- 創客空間與機器人俱樂部
- 按地區
- 北美洲
- 美國
- 加拿大
- 墨西哥
- 歐洲
- 德國
- 英國
- 法國
- 義大利
- 西班牙
- 俄羅斯
- 其他歐洲國家
- 亞太地區
- 中國
- 日本
- 印度
- 韓國
- ASEAN
- 澳洲和紐西蘭
- 其他亞太國家
- 南美洲
- 巴西
- 阿根廷
- 其他南美國家
- 中東
- 沙烏地阿拉伯
- UAE
- 土耳其
- 其他中東國家
- 非洲
- 南非
- 奈及利亞
- 其他非洲國家
- 北美洲
第6章 競爭情勢
- 市場集中度
- 策略趨勢
- 市佔率分析
- 公司簡介
- SoftBank Robotics Corp.
- UBTECH Robotics Inc.
- Hanson Robotics Ltd.
- Lego Education(The Lego Group)
- Wonder Workshop Inc.
- Robotis Co., Ltd.
- VEX Robotics Inc.
- Makeblock Co., Ltd.
- Sphero Inc.
- Modular Robotics(Cubelets)
- Blue Frog Robotics
- Aisoy Robotics
- Sanbot Innovation(Qihan)
- PAL Robotics
- Probotics America
- Robobuilder Co., Ltd.
- Dash Robotics(Kamigami)
- RobotLAB Inc.
- DJI RoboMaster
- Ozobot and Evollve Inc.
- Fischertechnik GmbH
- RoboTerra Inc.
- Roborisen(e-Bo)
- RoboSense(Edu)
第7章 市場機會與未來展望
According to Mordor Intelligence, the educational robot market size is expected to grow from USD 1.81 billion in 2025 to USD 2.07 billion in 2026 and is forecast to reach USD 4.11 billion by 2031 at 14.67% CAGR over 2026-2031.
This report is Segmented by Type (Humanoid, and Non-Humanoid), Component (Hardware, Software, and Services), Education Level (Pre-Primary, Primary, and More), Learning Mode (Coding and STEM, Language, and More), End User (Schools, Universities, and More), and Geography (North America, South America, Europe, Asia-Pacific, Middle East, Africa). The Market Forecasts are Provided in Terms of Value (USD).
Global Educational Robot Market Trends and Insights
Mandatory Robotics Curriculum in K-12 Schools Across Europe
The European Commission's 2025 STEM Education Strategic Plan obliges every member state to weave computational thinking and robotics into core K-12 standards by the 2027-28 academic year. Ministries of education now negotiate multi-year framework contracts, favoring ISO-certified vendors able to guarantee CE-compliant hardware and curriculum alignment. Finland earmarked EUR 120 million (USD 135.6 million) in 2025 to outfit 2,400 primary schools, while Germany reserved EUR 500 million (USD 565 million) through 2028 under Digital Pact 2.0. Because the directive insists robotics account for at least 10% of STEM contact time, the addressable classroom pool effectively doubles, and replacement demand will mirror curriculum-revision cycles rather than wear-and-tear schedules. By shifting purchasing power to national agencies, the rule stabilizes volume forecasts and encourages vendors to invest in local language content and long-term professional-development services.
Government-Funded STEM Initiatives Fueling University Procurement in North America
The U.S. National Science Foundation expanded its RITEL program in 2025, pledging USD 85 million over three years and stipulating that 40% of awards finance hardware for underserved institutions. Historically Black and Hispanic-serving colleges now access humanoid research platforms they previously could not afford, while Canadian counterpart NSERC committed CAD 60 million (USD 44.4 million) to create 15 regional robotics hubs. Grant recipients must publish open-source curriculum modules, trimming content-development costs for later adopters and accelerating usage beyond the initial grantees. Peer-reviewed evidence from these universities feeds district procurement cycles, reducing risk perceptions and moving educational robot market adoption further down the cost curve.
GDPR-Driven Data-Privacy Compliance Costs for Cloud-Connected Robots in Europe
GDPR threatens fines of EUR 20 million (USD 23.22 million) or 4% of global turnover, forcing vendors to implement consent workflows, conduct impact assessments, and conduct third-party audits that cost EUR 50,000-150,000 (USD 56,500-169,500) per European school district. Districts with per-pupil IT budgets below EUR 120 (USD 135) struggle to absorb the outlay, slowing deployments in Southern and Eastern Europe. Privacy-by-design clauses also shift processing to the device, elevating the bill of materials by 30-40% for edge AI chips. Non-compliant bidders are barred, as seen in France's 2024 cancellation of a USD 12 million tender. Extraterritorial reach means even non-EU vendors must appoint EU data officers, adding USD 40,000-80,000 in annual overhead that compresses margins on sub-USD 500 robots.
Other drivers and restraints analyzed in the detailed report include:
- Adoption of AI-Enabled Social Robots for Early-Childhood Language Tutoring in East Asia
- Falling Prices of Education-Grade Servo Motors and Sensors
- High Failure Rates of Battery Packs in Tropical Classrooms
For complete list of drivers and restraints, kindly check the Table Of Contents.
Segment Analysis
Humanoid robots captured 49.13% educational robot market share in 2025 and are projected to expand at a 15.03% CAGR through 2031. Their anthropomorphic design supports eye contact, gesture recognition, and proxemics that align with special-education and language-acquisition frameworks, prompting ministries to favor these units in compliance-driven tenders. A 2024 study showed children sustained attention 42% longer with humanoid tutors than with tablets. NAO and Yanshee dominate through curriculum partnerships that reduce teacher preparation time.
Non-humanoid platforms, including wheeled rovers and modular kits, lead in coding and maker spaces because schools can buy a full classroom set for the price of two humanoids. Improved durability extends replacement cycles to seven years, so vendors now bundle cloud content to maintain revenue. As therapeutic robots earn FDA clearances, insurance reimbursement moves humanoid purchases into clinical budgets, intensifying the bifurcation between premium social-learning devices and cost-focused STEM kits.
Hardware accounted for 58.36% of the educational robot market in 2025, yet software is growing fastest at a 16.17% CAGR. Districts pay USD 5-15 per student annually for curriculum libraries that integrate with Google Classroom and Canvas, reducing onboarding friction for teachers. Single Sign-On mandates, now at 62% of U.S. districts, create technical barriers while imposing switching costs once integrations are complete.
Hardware growth moderates as servos reach 50,000-cycle durability and schools stretch refresh intervals. Services revenue remains under-penetrated, but vendors offering multi-year professional development report 25% lower churn because teachers who log 20+ training hours weave robots into daily instruction. The longer-term trajectory points to software-defined classrooms where hardware functions as a durable endpoint while analytics and AI personalization engines monetize learning data.
Complete Report Scope:
- By Type
- Humanoid
- Non-Humanoid
- By Component
- Hardware
- Software
- Services
- By Education Level
- Pre-Primary (Kindergarten)
- Primary Education
- Secondary Education
- Higher Education
- Special Education
- By Learning Mode / Application
- Coding and STEM
- Language Learning
- AI and Robotics Research
- Special-Needs Therapy
- Telepresence and Remote Instruction
- By End User
- Schools
- Universities and Colleges
- Vocational Institutes
- Ed-Tech Companies
- Special-Education Centers
- Maker Spaces and Robotics Clubs
- By Geography
- North America
- United States
- Canada
- Mexico
- Europe
- Germany
- United Kingdom
- France
- Italy
- Spain
- Russia
- Rest of Europe
- Asia Pacific
- China
- Japan
- India
- South Korea
- ASEAN
- Australia and New Zealand
- Rest of Asia Pacific
- South America
- Brazil
- Argentina
- Rest of South America
- Middle East
- Saudi Arabia
- UAE
- Turkey
- Rest of Middle East
- Africa
- South Africa
- Nigeria
- Rest of Africa
- North America
Geography Analysis
Asia-Pacific generated 34.40% revenue in 2025, buoyed by China's nationwide AI literacy rule that touches 200,000+ primary schools. Japan provided JPY 12 billion (USD 80.4 million) in subsidies, and Seoul's pilots achieved 18% gains in English fluency. India's National Education Policy pushes coding from grade 6, but roll-out lags due to USD 15-30 per-pupil IT budgets. Australia shows private-school skew, with 68% of robotics kits in fee-paying campuses that house only 35% of students.
North America held a 28% share in 2025, yet growth slows as deployment saturation meets fiscal headwinds from shrinking student cohorts. NSF-funded hubs and Title I programs are pushing robots into underserved districts, but customs disputes have delayed Mexico's rural pilots.
Europe accounted for a 24% share in 2025, dominated by the forthcoming curriculum mandate and constrained by GDPR compliance levies. Finland and Germany front-load capital, yet Southern Europe struggles with per-pupil IT budgets under EUR 120 (USD 135).
The Middle East, led by Saudi Arabia and the UAE, logs the highest regional CAGR at 17.92% as Vision 2030 CSR funds sponsor urban robotics labs. South America wrestles with 60% Brazilian tariffs and currency swings, though Argentina deployed 800 kits in 2025. Africa remains below 5% share in 2025, hampered by the 9% baseline of digital-skill readiness among rural youth.
- SoftBank Robotics Corp.
- UBTECH Robotics Inc.
- Hanson Robotics Ltd.
- Lego Education (The Lego Group)
- Wonder Workshop Inc.
- Robotis Co., Ltd.
- VEX Robotics Inc.
- Makeblock Co., Ltd.
- Sphero Inc.
- Modular Robotics (Cubelets)
- Blue Frog Robotics
- Aisoy Robotics
- Sanbot Innovation (Qihan)
- PAL Robotics
- Probotics America
- Robobuilder Co., Ltd.
- Dash Robotics (Kamigami)
- RobotLAB Inc.
- DJI RoboMaster
- Ozobot and Evollve Inc.
- Fischertechnik GmbH
- RoboTerra Inc.
- Roborisen (e-Bo)
- RoboSense (Edu)
Additional Benefits:
- The market estimate (ME) sheet in Excel format
- 3 months of analyst support
TABLE OF CONTENTS
1 INTRODUCTION
- 1.1 Study Assumptions and Market Definition
- 1.2 Scope of the Study
2 RESEARCH METHODOLOGY
3 EXECUTIVE SUMMARY
4 MARKET LANDSCAPE
- 4.1 Market Overview
- 4.2 Market Drivers
- 4.2.1 Adoption of AI-Enabled Social Robots for Early-Childhood Language Tutoring in East Asia
- 4.2.2 Mandatory Robotics Curriculum in K-12 Schools across Europe
- 4.2.3 Government-Funded STEM Initiatives Fueling University Procurement in North America
- 4.2.4 Falling Average Selling Price of Education-Grade Servo Motors and Sensors in China
- 4.2.5 Surge of Remote and Hybrid Learning Driving Telepresence Teaching Robots in North America
- 4.2.6 Corporate CSR Budgets Sponsoring Robotics Labs in Middle East Public Schools
- 4.3 Market Restraints
- 4.3.1 High Failure Rates of Battery Packs During Continuous Classroom Use in Tropical Regions
- 4.3.2 Limited Multilingual Content Libraries for Humanoid Robots in Non-Latin Script Nations
- 4.3.3 GDPR-Driven Data-Privacy Compliance Costs for Cloud-Connected Robots in Europe
- 4.3.4 Shortage of Certified Robotics Instructors in Rural Africa
- 4.4 Industry Value Chain Analysis
- 4.5 Regulatory Outlook
- 4.6 Technological Outlook
- 4.7 Impact of Macroeconomic Factors on the Market
- 4.8 Porter's Five Forces Analysis
- 4.8.1 Threat of New Entrants
- 4.8.2 Bargaining Power of Buyers
- 4.8.3 Bargaining Power of Suppliers
- 4.8.4 Threat of Substitutes
- 4.8.5 Intensity of Competitive Rivalry
- 4.9 Investment Analysis (Funding, M&A, VC Trends)
5 MARKET SIZE AND GROWTH FORECASTS (VALUE)
- 5.1 By Type
- 5.1.1 Humanoid
- 5.1.2 Non-Humanoid
- 5.2 By Component
- 5.2.1 Hardware
- 5.2.2 Software
- 5.2.3 Services
- 5.3 By Education Level
- 5.3.1 Pre-Primary (Kindergarten)
- 5.3.2 Primary Education
- 5.3.3 Secondary Education
- 5.3.4 Higher Education
- 5.3.5 Special Education
- 5.4 By Learning Mode / Application
- 5.4.1 Coding and STEM
- 5.4.2 Language Learning
- 5.4.3 AI and Robotics Research
- 5.4.4 Special-Needs Therapy
- 5.4.5 Telepresence and Remote Instruction
- 5.5 By End User
- 5.5.1 Schools
- 5.5.2 Universities and Colleges
- 5.5.3 Vocational Institutes
- 5.5.4 Ed-Tech Companies
- 5.5.5 Special-Education Centers
- 5.5.6 Maker Spaces and Robotics Clubs
- 5.6 By Geography
- 5.6.1 North America
- 5.6.1.1 United States
- 5.6.1.2 Canada
- 5.6.1.3 Mexico
- 5.6.2 Europe
- 5.6.2.1 Germany
- 5.6.2.2 United Kingdom
- 5.6.2.3 France
- 5.6.2.4 Italy
- 5.6.2.5 Spain
- 5.6.2.6 Russia
- 5.6.2.7 Rest of Europe
- 5.6.3 Asia Pacific
- 5.6.3.1 China
- 5.6.3.2 Japan
- 5.6.3.3 India
- 5.6.3.4 South Korea
- 5.6.3.5 ASEAN
- 5.6.3.6 Australia and New Zealand
- 5.6.3.7 Rest of Asia Pacific
- 5.6.4 South America
- 5.6.4.1 Brazil
- 5.6.4.2 Argentina
- 5.6.4.3 Rest of South America
- 5.6.5 Middle East
- 5.6.5.1 Saudi Arabia
- 5.6.5.2 UAE
- 5.6.5.3 Turkey
- 5.6.5.4 Rest of Middle East
- 5.6.6 Africa
- 5.6.6.1 South Africa
- 5.6.6.2 Nigeria
- 5.6.6.3 Rest of Africa
- 5.6.1 North America
6 COMPETITIVE LANDSCAPE
- 6.1 Market Concentration
- 6.2 Strategic Moves
- 6.3 Market Share Analysis
- 6.4 Company Profiles (includes Global Level Overview, Market Level Overview, Core Segments, Financials as Available, Strategic Information, Market Rank/Share, Products and Services, Recent Developments)
- 6.4.1 SoftBank Robotics Corp.
- 6.4.2 UBTECH Robotics Inc.
- 6.4.3 Hanson Robotics Ltd.
- 6.4.4 Lego Education (The Lego Group)
- 6.4.5 Wonder Workshop Inc.
- 6.4.6 Robotis Co., Ltd.
- 6.4.7 VEX Robotics Inc.
- 6.4.8 Makeblock Co., Ltd.
- 6.4.9 Sphero Inc.
- 6.4.10 Modular Robotics (Cubelets)
- 6.4.11 Blue Frog Robotics
- 6.4.12 Aisoy Robotics
- 6.4.13 Sanbot Innovation (Qihan)
- 6.4.14 PAL Robotics
- 6.4.15 Probotics America
- 6.4.16 Robobuilder Co., Ltd.
- 6.4.17 Dash Robotics (Kamigami)
- 6.4.18 RobotLAB Inc.
- 6.4.19 DJI RoboMaster
- 6.4.20 Ozobot and Evollve Inc.
- 6.4.21 Fischertechnik GmbH
- 6.4.22 RoboTerra Inc.
- 6.4.23 Roborisen (e-Bo)
- 6.4.24 RoboSense (Edu)
7 MARKET OPPORTUNITIES AND FUTURE OUTLOOK
- 7.1 White-Space and Unmet Need Analysis
 教育機器人市場:全球市場按產品類型、年齡層、應用和銷售管道分類的預測 - 2026-2032 年
 教育機器人市場規模、佔有率、趨勢和預測:按組件、產品類型、最終用戶和地區分類,2026-2034 年K-12機器人套件市場:依產品類型、最終用戶、銷售管道、年級和應用程式分類-2026-2032年全球市場預測
 2026年全球機器人培訓服務市場報告
 全球教育機器人市場規模、佔有率、趨勢和成長分析報告(2026-2034)2026年全球教育機器人市場報告
 教育機器人市場-全球產業規模、佔有率、趨勢、機會、預測:按類型、組件、最終用戶、地區和競爭格局分類,2021-2031年
 全球教育機器人市場預測(至2032年):按類型、組件、應用、最終用戶和地區分類日本教育機器人市場報告(按類型(服務機器人、工業機器人)、組件(硬體、軟體)、最終用戶(小學教育、中學教育、高等教育及其他)和地區分類,2026-2034)
 教育機器人市場規模、佔有率和成長分析(按組件、應用、類型和地區分類)—2026-2033年產業預測