


 |
市場調查報告書
商品編碼
2073300
員工福利技術:市場佔有率分析、產業趨勢與統計、成長預測(2026-2031)Employee Benefits Technology - Market Share Analysis, Industry Trends & Statistics, Growth Forecasts (2026 - 2031) |
||||||

※ 本網頁內容可能與最新版本有所差異。詳細情況請與我們聯繫。
據 Mordor Intelligence 稱,2025 年員工福利技術市場價值為 34.6 億美元,預計 2026 年將達到 37.6 億美元,到 2031 年將達到 59.8 億美元,2026 年至 2031 年的複合年成長率為 9.72%。
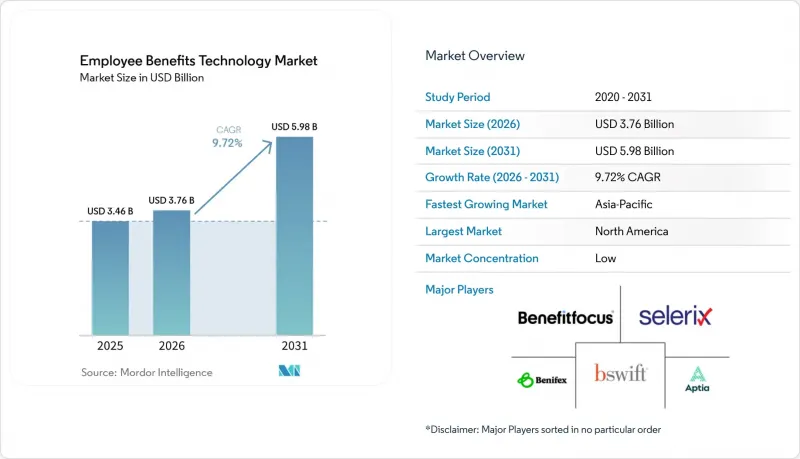
本報告按元件(軟體和服務)、部署模式(雲端和本地部署)、組織規模(大型企業和中小企業)、功能(註冊和合格管理、核心福利管理等)、最終用戶行業(銀行、金融服務和保險、IT和電信等)以及地區進行細分。市場預測以價值(美元)表示。
全球員工福利技術市場趨勢及洞察
員工福利日益複雜,對合規自動化的需求不斷成長。
隨著國家和地方政府層級福利法規日益複雜,員工福利技術市場正蓬勃發展。在美國,《平價醫療法案》(ACA)規定的「雇主共同責任罰款B」違規。此外,雇主還需要管理更廣泛的合規任務,包括ACA報告、休假管理、COBRA管理、ERISA流程以及HIPAA相關資料處理,這些都提升了整合自動化工具的價值。人工智慧驅動的合規引擎正被擴大用於自動生成ACA 1095-C表格、追蹤FMLA(家庭醫療休假法案)資格以及即時監控罰款風險。實務證明,這些引擎可減少70-80%的人工監控時間。這些變化正在將員工福利技術市場從後勤部門軟體類別轉變為負責雇主風險管理的控制層。
將整個人力資源和員工福利系統遷移到雲端。
此外,隨著雇主以整合平台取代分散的工具,整個人力資源和福利系統遷移到雲端的趨勢也在推動員工福利技術市場的成長。 Alight Solutions 於 2025 年 2 月完成了向 AWS 的遷移,每年節省成本 7,500 萬美元,伺服器佔用空間減少 40%,註冊回應時間縮短 43%。這些成果意義重大,因為雲端遷移不再只是為了降低基礎設施成本;它促使雇主簡化與保險公司的協作、資格規則以及先前需要手動核對的資料定義。這個精簡階段通常會帶來部署、整合和持續規劃配置的服務需求增加,為員工福利科技市場帶來更多服務機會。混合部署模式在監管嚴格的環境中也變得越來越重要,雇主既希望享受雲端的經濟效益,又需要本地資料處理和更嚴格的人力資源資訊流法律規制。
將傳統人力資源資訊系統與薪資核算系統整合的複雜性
員工福利技術市場仍面臨最大的營運難題:人力資源資訊系統 (HRIS) 和薪資核算系統整合的複雜性。 Align HCM 在 2026 年 4 月發布的報告顯示,未整合福利和薪資核算系統的企業每月可能需要花費多達 40 小時手動重新輸入數據,導致平均每年因數據品質不佳而造成的生產力損失和錯誤糾正成本高達 1290 萬美元。許多舊有系統是在現代 API 標準普及之前構建的,這意味著福利平台仍然依賴批量檔案傳輸,從而導致資格更新延遲和賬單差異。 Align HCM 在 2025 年 12 月發布的報告也指出,37% 的專案失敗源於需求不明確,29% 的公司在遷移後遇到了嚴重的薪資核算差異。這減緩了員工福利技術市場的成長,因為雇主通常不僅根據平台的功能來評估其價值,還會根據其實施效果來判斷。
細分市場分析
到2025年,軟體將佔員工福利技術市場規模的74.14%,這一主導地位反映了註冊引擎、資格管理和人工智慧驅動的決策支援在雇主採用軟體的過程中發揮的核心作用。軟體層將繼續是員工福利技術市場的基礎,因為雇主在深入拓展服務關係之前,仍會先透過購買平台來現代化。然而,預計到2031年,服務業的複合年成長率將達到10.06%,超過整體市場成長率。這顯示軟體的採用並未完成購買週期,而是催生了第二波需求。隨著福利結構日益專業化,企業內部管理實施支援、與保險公司聯絡、計畫設置和持續合規等工作變得越來越具有挑戰性。
這項轉變意義重大,因為在整個員工福利科技產業,產品和服務之間的界線正變得日益模糊。 Businessolver 於 2025 年 7 月收購 ProView Global 的資產,增強了其後端管理能力,也反映了客戶除了人工智慧驅動的工具外,對人工支援的直接需求。隨著越來越多的雇主將部署管理和日常異常處理外包給供應商,服務不再只是輔助收入來源,而是成為提高客戶留存率的關鍵因素。因此,能夠將強大的核心軟體與可靠的營運交付相結合的供應商,在員工福利技術市場中很可能會繼續備受青睞。
到2025年,基於雲端的部署將佔員工福利技術市場71.62%的佔有率,預計到2031年將以9.88%的複合年成長率成長。向雲端系統的轉變是由雇主對更快升級、更輕的基礎設施負擔以及更便捷的薪資核算、人力資源資訊系統(HRIS)和保險公司系統整合的需求所驅動的。員工福利技術市場不再局限於簡單地更換託管服務;目前的專案擴大涉及基於API優先設計重建註冊、合格和報告層,而不僅僅是將舊邏輯遷移到新伺服器。在政府和高度監管的環境中,由於外部託管仍然困難,本地部署仍然很重要,但這一細分市場正面臨持續的結構性萎縮。
對雲端的強勁需求也源自於可衡量的效能提升。 Alight 遷移到 AWS 後,註冊回應時間縮短了 43%,每年節省成本 7,500 萬美元。如果沒有大規模的再投資,傳統的本地部署環境很難達到這樣的效果。在歐洲,對員工資料儲存位置的法律監管也影響部署選擇,這意味著私有雲端和區域託管模式在大規模公司中仍然佔據重要地位。成本、效能和法律控制這三個因素共同確保了雲端在員工福利技術市場中仍然佔據核心地位,即使最終架構並非完全基於公共雲端。
區域分析
到2025年,北美將佔據員工福利技術市場40.36%的佔有率,成為最大的區域市場。該地區受惠於嚴格的合規環境,包括《平價醫療法案》(ACA)、《綜合預算協調法案》(COBRA)、《僱員退休收入保障法案》(ERISA)、《健康保險流通與責任法案》(HIPAA)以及日益嚴格的州級福利法規。美國仍然是需求的核心,因為採用自保模式的雇主需要更強大的資格管理、成本追蹤以及保險公司和停損機制之間的協調。隨著雇主規範行政流程並將當地福利法規與更廣泛的人力資源系統整合,加拿大和墨西哥也在擴大其市場佔有率。北美仍然是員工福利技術市場的中心,因為在該地區,平台的深度(而不僅僅是數位化)至關重要。
預計到2031年,亞太地區將以11.92%的複合年成長率成長,成為員工福利技術市場所有區域中成長最快的地區。該地區的發展路徑各不相同:印度傾向於成本效益高的本土人力資源技術,東南亞優先考慮行動優先訪問,而中國則越來越支持與企業通訊生態系統整合的本地平台。由於許多雇主仍然認為福利管理數位化還有提升空間,因此該地區的數位化應用正在穩步推進。這使得供應商不僅可以透過系統替換實現成長,還可以透過提高可訪問性、易用性和本地化最佳化的合規工作流程來實現成長。同時,日本和韓國的數位化應用相對緩慢,因為這兩個國家的雇主和員工在福利決策方面仍然高度依賴人工干預。因此,儘管全部區域正在經歷強勁成長,但目前尚無統一的區域運作模式。
在歐洲,員工福利科技市場正經歷一場由合規主導的升級週期,儘管各國的促進因素有所不同。歐盟的工資透明度指令和更廣泛的監管迫使雇主在缺陷演變為營運問題之前審查其薪酬、報告和福利數據系統。 2026年4月,SD Worx推出了「法律觀察」(Legal Watch)項目,旨在追蹤德國、盧森堡、西班牙、瑞典和荷蘭的法律變化,這表明供應商正在將監管訊息整合到核心產品功能中。在歐洲以外,南美洲和中東及非洲市場仍處於早期階段,大規模透過要求各業務部門實現管理標準化,主導此一趨勢。
其他好處:
- Excel格式的市場預測(ME)表
- 3個月的分析師支持
目錄
第1章:引言
- 研究假設和市場定義
- 調查範圍
第2章:調查方法
第3章執行摘要
第4章 市場狀況
- 市場概覽
- 市場促進因素
- 員工福利日益複雜,對合規自動化的需求不斷成長。
- 人力資源與員工福利系統的雲端遷移
- 員工自助服務和個人化指導的需求日益成長。
- 中小企業透過定價策略採用 SaaS。
- 薪資核算福利 API 已整合到 HCM 生態系統中
- 擴大皮夾式和生活方式式員工福利計劃
- 市場限制因素
- 將傳統人力資源資訊系統與薪資核算系統整合的複雜性
- 資料隱私與網路安全風險
- 多國通訊業者的數據碎片化
- 負責設計和實施員工福利計劃的人員短缺。
- 宏觀經濟因素對市場的影響
- 產業價值鏈分析
- 監理情勢
- 技術展望
- 波特五力分析
第5章 市場規模與成長預測
- 按組件
- 軟體
- 服務
- 按部署模式
- 基於雲端的
- 現場
- 按組織規模
- 大公司
- 小型企業
- 功能性別
- 註冊和資格管理
- 核心效益管理
- 員工自助服務與決策支持
- 合規與審計管理
- 分析與報告
- 其他功能
- 按最終用戶行業分類
- BFSI
- IT/通訊
- 醫療保健和生命科學
- 零售與電子商務
- 工業製造
- 政府/公共部門
- 其他終端用戶產業
- 按地區
- 北美洲
- 美國
- 加拿大
- 墨西哥
- 南美洲
- 巴西
- 阿根廷
- 其他南美國家
- 歐洲
- 德國
- 英國
- 法國
- 義大利
- 西班牙
- 俄羅斯
- 其他歐洲國家
- 亞太地區
- 中國
- 日本
- 印度
- 韓國
- 澳洲和紐西蘭
- 其他亞太國家
- 中東
- 沙烏地阿拉伯
- 阿拉伯聯合大公國
- 土耳其
- 其他中東國家
- 非洲
- 南非
- 埃及
- 奈及利亞
- 其他非洲國家
- 北美洲
第6章 競爭情勢
- 市場集中度
- 策略趨勢
- 市佔率分析
- 公司簡介
- Aptia Group Limited
- Benefex Limited
- bswift LLC
- Benefitfocus.com, Inc.
- Businessolver.com Inc.
- PlanSource Benefits Administration, Inc.
- Employee Navigator LLC
- Selerix Systems, Inc.
- HealthJoy, LLC
- The Jellyvision Lab, Inc.
- Nayya Health, Inc.
- ThrivePass, Inc.
- Forma Inc.
- Benepass, Inc.
- PeopleKeep, Inc.
- Benefitfirst
- Alegeus Technologies, LLC
- Reward Gateway(UK)Limited
- Universal Cover, SA
- Thanks Ben LTD
- Compt Inc.
- Level Benefits, Inc.
第7章 市場機會與未來展望
According to Mordor Intelligence, the employee benefits technology market size was valued at USD 3.46 billion in 2025 and is expected to reach USD 3.76 billion in 2026 and USD 5.98 billion by 2031, growing at a CAGR of 9.72% from 2026 to 2031.
This report is Segmented by Component (Software, and Services), Deployment Model (Cloud-Based, and On-Premises), Organization Size (Large Enterprises, and SMEs), Functionality (Enrollment and Eligibility Management, Core Benefits Administration, and More), End-User Industry (BFSI, IT and Telecommunications, and More), and Geography. The Market Forecasts are Provided in Terms of Value (USD).
Global Employee Benefits Technology Market Trends and Insights
Rising Benefits Complexity And Compliance Automation Demand
The employee benefits technology market is gaining support from the rising complexity of benefit rules across national and sub-national jurisdictions. In the United States, the ACA Employer Shared Responsibility Penalty B stood at USD 4,350 per employee for non-compliant coverage offerings in 2026, which keeps compliance exposure high for employers that still rely on manual tracking. Employers also have to manage a wider compliance stack that includes ACA reporting, leave tracking, COBRA administration, ERISA processes, and HIPAA-linked data handling, which increases the value of unified automation tools. AI-enabled compliance engines are increasingly being used to automate ACA 1095-C generation, FMLA eligibility tracking, and live penalty-risk monitoring, and documented deployments have reduced manual monitoring time by 70-80%. That shift is helping the employee benefits technology market move from a back-office software category toward a control layer for employer risk management.
Cloud Migration Across HR And Benefits Stacks
The employee benefits technology market is also being lifted by cloud migration across HR and benefits systems as employers replace fragmented tools with unified platforms. Alight Solutions completed its AWS migration in February 2025, and the move resulted in USD 75 million in annual savings, a 40% reduction in server footprint, and 43% faster enrollment response times. These results matter because cloud migration is no longer limited to infrastructure cost savings, and it now pushes employers to clean up carrier links, eligibility rules, and data definitions that had been sustained through manual reconciliation. That cleanup phase often increases service demand for implementation, integration, and ongoing plan configuration, which supports a larger services opportunity inside the employee benefits technology market. Hybrid deployment models are also becoming more relevant in regulated settings where employers want cloud economics but still need local data handling and tighter legal oversight of HR information flows.
Legacy HRIS And Payroll Integration Complexity
The employee benefits technology market still faces its largest operational barrier in HRIS and payroll integration complexity. Align HCM stated in April 2026 that organizations with disconnected benefits and payroll systems can spend 40 hours per month on manual data re-entry, and poor data quality has been shown to cost organizations an average of USD 12.9 million annually in productivity loss and error remediation. Many legacy systems were built before modern API standards became common, so benefits platforms still depend on batch file transfers that create eligibility lags and billing mismatches. Align HCM also reported in December 2025 that 37% of project failures were tied to unclear requirements, and 29% of firms experienced critical payroll discrepancies after migration. This is slowing the employee benefits technology market because employers often judge the value of a platform through implementation outcomes rather than through product features alone.
Other drivers and restraints analyzed in the detailed report include:
- Growing Demand For Employee Self-service And Personalized Guidance
- Small And Medium Enterprise Adoption Through SaaS Pricing
- Data Privacy And Cybersecurity Exposure
For complete list of drivers and restraints, kindly check the Table Of Contents.
Segment Analysis
Software accounted for 74.14% of the employee benefits technology market size in 2025, and this lead reflected the central role of enrollment engines, eligibility management, and AI-guided decision support in employer deployments. The software layer remains the foundation of the employee benefits technology market because employers still begin modernization through a platform purchase before they expand into deeper service relationships. That said, services is projected to grow at a 10.06% CAGR through 2031, which is faster than the overall market and shows that software adoption is creating a second demand wave rather than closing the buying cycle. Implementation support, carrier connectivity, plan configuration, and ongoing compliance maintenance are becoming harder to manage internally as benefit structures become more specialized.
This shift matters because the boundary between product and service is starting to blur across the employee benefits technology industry. Businessolver's July 2025 acquisition of ProView Global assets added back-end administration capacity and reflected direct client demand for human support alongside AI-driven tools. As more employers ask vendors to manage implementation and daily exceptions, services is becoming a source of stickiness rather than a peripheral revenue stream. This is why the employee benefits technology market is likely to keep rewarding vendors that can combine strong core software with reliable operational delivery.
Cloud-based deployment held 71.62% of the employee benefits technology market share in 2025, and it is forecast to grow at a 9.88% CAGR through 2031. Cloud systems are leading because employers want faster upgrades, lower infrastructure burden, and easier connectivity across payroll, HRIS, and carrier systems. The employee benefits technology market has moved beyond simple hosting changes, and current projects increasingly rebuild enrollment, eligibility, and reporting layers around API-first designs instead of moving old logic into new servers. On-premises deployments still hold relevance in government and heavily regulated settings where external hosting remains difficult, but this segment faces ongoing structural compression.
The stronger pull toward the cloud also comes from measurable performance gains. Alight's AWS migration delivered 43% faster enrollment response times and USD 75 million in annual savings, which set a benchmark that traditional on-premises environments struggle to match without major reinvestment. In Europe, deployment choice is also shaped by legal scrutiny of where employee data resides, which is helping private-cloud and regional-hosting models stay relevant for larger employers. That mix of cost, performance, and legal control keeps the cloud at the center of the employee benefits technology market even when the final architecture is not fully public cloud.
Complete Report Scope:
- By Component
- Software
- Services
- By Deployment Model
- Cloud-based
- On-premises
- By Organization Size
- Large Enterprises
- SMEs
- By Functionality
- Enrollment and Eligibility Management
- Core Benefits Administration
- Employee Self-service and Decision Support
- Compliance and Audit Management
- Analytics and Reporting
- Other Functionalities
- By End-user Industry
- BFSI
- IT and Telecommunications
- Healthcare and Lifesciences
- Retail and E-commerce
- Industrial Manufacturing
- Government and Public Sector
- Other End-user Industries
- By Geography
- North America
- United States
- Canada
- Mexico
- South America
- Brazil
- Argentina
- Rest of South America
- Europe
- Germany
- United Kingdom
- France
- Italy
- Spain
- Russia
- Rest of Europe
- Asia-Pacific
- China
- Japan
- India
- South Korea
- Australia and New Zealand
- Rest of Asia-Pacific
- Middle East
- Saudi Arabia
- United Arab Emirates
- Turkey
- Rest of Middle East
- Africa
- South Africa
- Egypt
- Nigeria
- Rest of Africa
- North America
Geography Analysis
North America held 40.36% of the employee benefits technology market size in 2025, which made it the largest regional market. The region benefits from a dense compliance environment that includes ACA, COBRA, ERISA, HIPAA, and a growing list of state benefit mandates. The United States remains the core demand center because self-insured employers need stronger eligibility management, cost tracking, and coordination across carriers and stop-loss structures. Canada and Mexico are also expanding their role as employers standardize administration and connecting local benefit obligations to broader HR systems. This keeps North America central to the employee benefits technology market because platform depth matters more here than basic digitization alone.
Asia-Pacific is forecast to grow at an 11.92% CAGR through 2031, which is the fastest regional rate in the employee benefits technology market. The region is expanding through different paths, with India favoring cost-efficient domestic HR technology, Southeast Asia leaning toward mobile-first access, and China showing stronger traction for local platforms tied to enterprise communication ecosystems. Adoption is rising because many employers in the region still have room to digitize benefits administration, enabling vendors to grow through access, usability, and localized compliance workflows rather than through replacement alone. At the same time, Japan and South Korea show a more measured pace because employers and employees still place a higher value on human intermediation in benefits decisions. The result is strong regional growth, but not a single regional operating model.
Europe is seeing a compliance-led upgrade cycle across the employee benefits technology market, even though the drivers differ by country. The EU Pay Transparency Directive and wider regulatory scrutiny are pushing employers to revisit compensation, reporting, and benefit data systems before gaps become operational problems. SD Worx launched Legal Watch in April 2026 to track legal changes across Germany, Luxembourg, Spain, Sweden, and the Netherlands, which shows how vendors are turning regulatory intelligence into a core product feature. Outside Europe, South America, the Middle East, and Africa remain earlier-stage opportunities where adoption is led mainly by large multinational employers that want standardized administration across operating units.
- Aptia Group Limited
- Benefex Limited
- bswift LLC
- Benefitfocus.com, Inc.
- Businessolver.com Inc.
- PlanSource Benefits Administration, Inc.
- Employee Navigator LLC
- Selerix Systems, Inc.
- HealthJoy, LLC
- The Jellyvision Lab, Inc.
- Nayya Health, Inc.
- ThrivePass, Inc.
- Forma Inc.
- Benepass, Inc.
- PeopleKeep, Inc.
- Benefitfirst
- Alegeus Technologies, LLC
- Reward Gateway (UK) Limited
- Universal Cover, SA
- Thanks Ben LTD
- Compt Inc.
- Level Benefits, Inc.
Additional Benefits:
- The market estimate (ME) sheet in Excel format
- 3 months of analyst support
TABLE OF CONTENTS
1 INTRODUCTION
- 1.1 Study Assumptions and Market Definition
- 1.2 Scope of the Study
2 RESEARCH METHODOLOGY
3 EXECUTIVE SUMMARY
4 MARKET LANDSCAPE
- 4.1 Market Overview
- 4.2 Market Drivers
- 4.2.1 Rising Benefits Complexity and Compliance Automation Demand
- 4.2.2 Cloud Migration Across HR and Benefits Stacks
- 4.2.3 Growing Demand for Employee Self-service and Personalized Guidance
- 4.2.4 Small and Medium Enterprise Adoption Through SaaS Pricing
- 4.2.5 Embedded Benefits APIs Inside Payroll and HCM Ecosystems
- 4.2.6 Expansion of Wallet-based and Lifestyle Benefit Programs
- 4.3 Market Restraints
- 4.3.1 Legacy HRIS and Payroll Integration Complexity
- 4.3.2 Data Privacy and Cybersecurity Exposure
- 4.3.3 Multi-country Carrier Data Fragmentation
- 4.3.4 Shortage of Benefits Configuration and Implementation Talent
- 4.4 Impact of Macroeconomic Factors on the Market
- 4.5 Industry Value Chain Analysis
- 4.6 Regulatory Landscape
- 4.7 Technological Outlook
- 4.8 Porter's Five Forces Analysis
- 4.8.1 Threat of New Entrants
- 4.8.2 Bargaining Power of Buyers
- 4.8.3 Bargaining Power of Suppliers
- 4.8.4 Threat of Substitutes
- 4.8.5 Intensity of Competitive Rivalry
5 MARKET SIZE AND GROWTH FORECASTS (VALUE)
- 5.1 By Component
- 5.1.1 Software
- 5.1.2 Services
- 5.2 By Deployment Model
- 5.2.1 Cloud-based
- 5.2.2 On-premises
- 5.3 By Organization Size
- 5.3.1 Large Enterprises
- 5.3.2 SMEs
- 5.4 By Functionality
- 5.4.1 Enrollment and Eligibility Management
- 5.4.2 Core Benefits Administration
- 5.4.3 Employee Self-service and Decision Support
- 5.4.4 Compliance and Audit Management
- 5.4.5 Analytics and Reporting
- 5.4.6 Other Functionalities
- 5.5 By End-user Industry
- 5.5.1 BFSI
- 5.5.2 IT and Telecommunications
- 5.5.3 Healthcare and Lifesciences
- 5.5.4 Retail and E-commerce
- 5.5.5 Industrial Manufacturing
- 5.5.6 Government and Public Sector
- 5.5.7 Other End-user Industries
- 5.6 By Geography
- 5.6.1 North America
- 5.6.1.1 United States
- 5.6.1.2 Canada
- 5.6.1.3 Mexico
- 5.6.2 South America
- 5.6.2.1 Brazil
- 5.6.2.2 Argentina
- 5.6.2.3 Rest of South America
- 5.6.3 Europe
- 5.6.3.1 Germany
- 5.6.3.2 United Kingdom
- 5.6.3.3 France
- 5.6.3.4 Italy
- 5.6.3.5 Spain
- 5.6.3.6 Russia
- 5.6.3.7 Rest of Europe
- 5.6.4 Asia-Pacific
- 5.6.4.1 China
- 5.6.4.2 Japan
- 5.6.4.3 India
- 5.6.4.4 South Korea
- 5.6.4.5 Australia and New Zealand
- 5.6.4.6 Rest of Asia-Pacific
- 5.6.5 Middle East
- 5.6.5.1 Saudi Arabia
- 5.6.5.2 United Arab Emirates
- 5.6.5.3 Turkey
- 5.6.5.4 Rest of Middle East
- 5.6.6 Africa
- 5.6.6.1 South Africa
- 5.6.6.2 Egypt
- 5.6.6.3 Nigeria
- 5.6.6.4 Rest of Africa
- 5.6.1 North America
6 COMPETITIVE LANDSCAPE
- 6.1 Market Concentration
- 6.2 Strategic Moves
- 6.3 Market Share Analysis
- 6.4 Company Profiles (includes Global Level Overview, Market Level Overview, Core Segments, Financials as available, Strategic Information, Market Rank/Share, Products and Services, Recent Developments)
- 6.4.1 Aptia Group Limited
- 6.4.2 Benefex Limited
- 6.4.3 bswift LLC
- 6.4.4 Benefitfocus.com, Inc.
- 6.4.5 Businessolver.com Inc.
- 6.4.6 PlanSource Benefits Administration, Inc.
- 6.4.7 Employee Navigator LLC
- 6.4.8 Selerix Systems, Inc.
- 6.4.9 HealthJoy, LLC
- 6.4.10 The Jellyvision Lab, Inc.
- 6.4.11 Nayya Health, Inc.
- 6.4.12 ThrivePass, Inc.
- 6.4.13 Forma Inc.
- 6.4.14 Benepass, Inc.
- 6.4.15 PeopleKeep, Inc.
- 6.4.16 Benefitfirst
- 6.4.17 Alegeus Technologies, LLC
- 6.4.18 Reward Gateway (UK) Limited
- 6.4.19 Universal Cover, SA
- 6.4.20 Thanks Ben LTD
- 6.4.21 Compt Inc.
- 6.4.22 Level Benefits, Inc.
7 MARKET OPPORTUNITIES AND FUTURE OUTLOOK
- 7.1 White-space and Unmet-need Assessment

 2026年全球員工福利管理軟體市場報告
 歐洲員工福利管理:市場佔有率分析、產業趨勢與統計及成長預測(2026-2031 年)
 2026-2030年全球員工福利管理服務市場2026年全球福利與獎勵管理市場報告亞太地區員工福利技術:市場佔有率分析、產業趨勢與統計及成長預測(2026-2031 年)員工福祉平台:市場佔有率分析、產業趨勢與統計、成長預測(2026-2031)2026年全球福利管理軟體市場報告
 福利管理軟體市場規模、佔有率和成長分析(按部署類型、最終用戶、功能提供、定價模式和地區分類)-2026-2033年產業預測
 員工福利技術平台市場:按解決方案類型、部署模式、組織規模和行業垂直領域分類 - 2026-2032 年全球預測2025年全球社會福利管理服務市場報告