


 |
市場調查報告書
商品編碼
2073098
產品碳足跡(PCF)軟體:市場佔有率分析、產業趨勢與統計、成長預測(2026-2031)Product Carbon Footprint (PCF) Software - Market Share Analysis, Industry Trends & Statistics, Growth Forecasts (2026 - 2031) |
||||||

※ 本網頁內容可能與最新版本有所差異。詳細情況請與我們聯繫。
根據 Mordor Intelligence 預測,產品碳足跡 (PCF) 軟體市場將從 2025 年的 21.7 億美元和 2026 年的 25.1 億美元成長到 2031 年的 52 億美元,2026 年至 2031 年的年複合成長率(CAGR)為 15.66%。
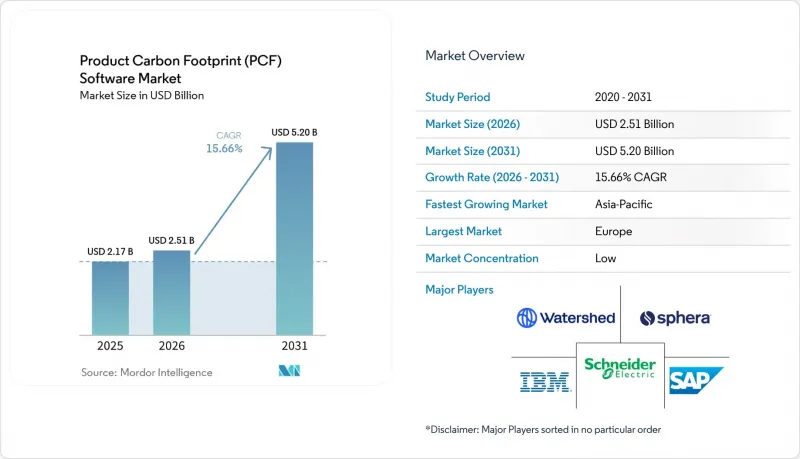
本報告按功能(產品碳足跡運算、資料收集和供應商合作等)、部署類型(雲端和本地部署)、組織規模(大型企業和中小企業)、產業(能源和公共產業、食品和飲料等)以及地區進行細分。市場預測以貨幣價值(美元)表示。
全球產品碳足跡(PCF)軟體市場趨勢與洞察
提高監管資訊揭露要求將鼓勵產品層面的碳足跡報告。
在產品碳足跡 (PCF) 軟體市場,最強勁的需求促進因素是法規強制要求將嵌入式排放資料納入日常合規流程。歐盟的碳邊境調節機制 (CBAM) 於 2026 年 1 月進入最後階段,如果產品層面的排放報告不準確,目標產業的進口商將面臨更高的成本。 2026 年 2 月發布的修訂版《碳排放交易指令綜合法案》(CSRD Omnibus Act) 將報告範圍限制在大規模營業單位,但同時,也集中了對規模足夠大、能夠為多層供應商制定正式碳數據要求的公司進行監管。這種轉變對產品碳足跡軟體市場意義重大,因為大規模受監管買家通常會為小規模的供應商設定數據標準,而這些供應商仍需要遵守這些標準。因此,形成了一個互惠循環:供應鏈一端的合規要求變成了另一端的商業性要求。監管壓力不僅影響部署規模,也影響買家現在認為必不可少的平台功能類型,特別是審計追蹤、可追溯的計算和結構化的揭露工作流程。
範圍 3 供應商資料要求擴展了 PCF 軟體的使用案例。
在範圍 3 數據需求的推動下,產品碳足跡 (PCF) 軟體市場的作用正從內部碳足跡計算擴展到與供應商的合作。當揭露、採購和客戶報告需要產品層面的詳細資訊時,基於支出的平均值不足以滿足需求,因此,供應商原始數據的重要性更加凸顯。 Sphera 於 2025 年 4 月發布的「供應商 PCF 計算器」透過利用包含超過 50 萬個檢驗排放因子的管理資料庫,並遵循 Catena-X、PACT 和 ISO 方法論,解決了這個難題。此外,隨著大型企業客戶越來越要求供應商(即使是沒有專門永續發展團隊的供應商)提供可審計的數據,中小型供應商也擴大採用產品碳足跡 (PCF) 軟體。英國商業銀行 2025 年的報告指出,雖然中型企業的碳足跡測量活動微企業更為活躍,但整個供應鏈的資料收集仍有限。這一差距迫使供應商轉向更簡單的入駐流程、多語言供應商入口網站以及准入門檻更低的定價模式,使他們能夠在不降低資料品質預期的情況下擴大參與範圍。
排放因子和調查方法的細分降低了數據的可比性。
資料庫和方法論上的割裂仍然是產品碳足跡 (PCF) 軟體市場的一大障礙。各公司仍在使用 ecoinvent、GaBi、託管專有庫以及供應商特定的資料集,這使得買家難以像預期那樣輕鬆地並排比較產品。 2025 年發表在《應用科學》(Applied Sciences) 上的研究指出,資料整合和技術相容性的複雜性是碳管理系統普及應用的主要障礙。 2026 年,《規範》(Normative) 也指出,來自 CSRD 和 SBTi 相關範圍 3 報告的壓力迫使企業提高數據質量,即便供應商資訊在不同報告層級之間仍然存在差異。在產品碳足跡 (PCF) 軟體市場,這給供應商帶來了兩大挑戰:既要確保調查方法的嚴謹性,又要幫助客戶有效利用不完整或不一致的上游資料。因此,標準化進程緩慢,買家的謹慎情緒日益高漲,平台決策前的價值論證週期也不斷延長。
細分市場分析
到2025年,產品碳足跡運算將佔據35.31%的市場佔有率,成為產品碳足跡(PCF)軟體市場中最重要的功能。由於法規和客戶對證據的要求日益嚴格,企業無法將提供可追溯且具說服力的產品級計算這一核心需求委託給他人。因此,即使其他功能發展迅速,計算工具仍然至關重要。此功能的重要性絲毫未減,因為所有後續報告階段都依賴原始碳足跡資料的品質。
「自動化報告與揭露」預計到2031年將以16.81%的複合年成長率成長,成為PCF軟體市場中成長最快的功能。 Workiva在2026年5月的更新中,將CDP 2026標準(適用於企業和中小企業)添加到Sustainability Explorer中,表明買家正轉向更加結構化和可重複的揭露工作流程。如今,這種壓力已不僅限於資料收集,還包括企業需要在董事會報告、鑑證請求和正式提交文件中反映這些資料。基於同樣的原因,儘管資料收集和供應商協作變得越來越重要,但隨著財務團隊越來越需要碳排放資料來支援預算和投資決策,情境分析、脫碳規劃、審計追蹤和檢驗管理也日益受到重視。
預計到2025年,基於雲端的部署將佔銷售額的62.12%,使其成為領先的產品碳足跡(PCF)軟體市場。這一地位反映了諸如持續更新排放因子、跨地域訪問供應商以及人工智慧驅動的處理等實際需求,這些需求在純粹的本地環境中難以實現。雲端架構也非常適合基於標準化API的資料交換,而大規模買家對供應商的要求也日益提高。該細分市場的強勁表現表明,部署模式的選擇不僅與託管偏好密切相關,而且與操作便利性也密切相關。
此外,預計到2031年,基於雲端的採用率將以17.84%的最高複合年成長率成長,這表明這一關鍵細分市場在產品碳足跡(PCF)軟體市場中的作用正在進一步擴大。 2026年初,SAP將「SAP永續發展足跡管理」擴展到位於法蘭克福和聖保羅的AWS基礎設施,這表明雲端供應商正在透過本地化基礎設施來滿足合規性和資料居住要求。對於擁有嚴格資料管理規則和根深蒂固的傳統ERP環境的組織而言,本地部署仍然是一個至關重要的選擇。即使在這樣的環境中,隨著企業越來越希望在利用基於雲端的報告和協作工具的同時,對敏感資料進行本地管理,混合營運模式也變得越來越普遍。從長遠來看,這些趨勢預計將推動產品碳足跡(PCF)軟體產業向雲端優先架構轉型。
區域分析
2025年,歐洲將佔全球銷售額的38.19%,引領產品碳足跡(PCF)軟體市場。與其他大多數地區相比,歐洲擁有更強大的軟體應用基礎,這得益於其嚴格的監管體系和成熟的供應鏈網路。隨著歐盟碳邊境調節機制(CBAM)的實施以及產品碳排放法規的廣泛擴展,嵌入式排放數據正日益成為產品貿易和採購決策的重要因素。儘管2026年2月對《企業永續性報告指令》(CSRD)的全面修訂縮小了正式報告的範圍,但需求仍集中在規模最大的公司,這些公司最有能力將這些要求向下傳遞至供應鏈下游。
北美地區繼續保持其作為全球第二大碳排放控制軟體市場的地位,這主要得益於企業對更強大的碳數據管理和資訊揭露能力的需求。該地區受益於多種因素的共同作用,包括投資者壓力、對跨境供應商的需求以及對產品級可追溯性的日益關注。供應商也積極適應當地的營運需求。 SAP計劃於2026年將其基礎設施擴展到巴西(除其歐洲企業發展外),這表明區域服務覆蓋正成為其在美洲地區競爭優勢的重要組成部分。南美洲仍處於碳排放控制軟體應用的早期階段,由於預算和部署能力有限,模組化雲部署較為普遍。
預計到2031年,亞太地區將以17.31%的複合年成長率成長,成為產品碳足跡(PCF)軟體市場成長最快的地區。中國於2025年3月推出的產品碳足跡認證與檢驗條例,建立了正式的產品級認證體系,標準週期為90天,有效期為兩年。日本經濟產業省持續推動生命週期評估和碳足跡相關政策的製定,推動各產業產品級排放計算的一致性。包括NTT在內的日本科技公司也於2026年3月發布了軟體產品的「從搖籃到墳墓」的產品碳足跡計算規則,顯示該地區的相關工作正從製造業擴展到數位產品領域。非洲和中東地區仍處於起步階段,相關應用主要集中在大規模跨國公司的業務活動和早期資訊揭露框架中,尚未廣泛部署。
其他好處
- Excel格式的市場預測(ME)表
- 3個月的分析師支持
目錄
第1章:引言
- 研究假設和市場定義
- 調查範圍
第2章:調查方法
第3章執行摘要
第4章 市場狀況
- 市場概覽
- 市場促進因素
- 更嚴格的監管揭露要求活性化產品層面碳排放報告的增加。
- 範圍 3 供應商資料要求擴展了 PCF 軟體的使用案例。
- 碳成本應體現在採購和產品設計決策中。
- 利用人工智慧繪製排放因子圖,可以縮短計算週期時間。
- 數位產品護照的引入,催生了對 SKU 級別可追溯性的需求。
- 與永續發展掛鉤的金融需要可審計的產品碳排放數據。
- 市場限制因素
- 排放因子和調查方法的差異降低了數據的可比性。
- 實施複雜性的增加是由於 ERP 和 PLM 系統的高級整合以及供應商網路的整合。
- 隱私問題減緩了整個多層價值鏈中供應商的資訊揭露速度。
- 技能差距阻礙了對產品碳排放資訊的有效解讀。
- 產業價值鏈分析
- 監理情勢
- 技術展望
- 波特五力分析
- 宏觀經濟因素對市場的影響
第5章 市場規模與成長預測
- 按功能
- 產品碳足跡的計算
- 數據收集和與供應商的合作
- 報告和揭露的自動化
- 情境分析和脫碳計劃
- 審計追蹤和檢驗管理
- 其他
- 按實現類型
- 基於雲端的
- 本地部署
- 按組織規模
- 大公司
- 小型企業
- 按行業
- 能源與公共產業
- 製造業
- 運輸/物流
- 飲食
- 製藥
- 零售和消費品
- 其他行業領域
- 按地區
- 北美洲
- 美國
- 加拿大
- 墨西哥
- 南美洲
- 巴西
- 阿根廷
- 其他南美國家
- 歐洲
- 德國
- 英國
- 法國
- 義大利
- 西班牙
- 俄羅斯
- 其他歐洲國家
- 亞太地區
- 中國
- 印度
- 日本
- 韓國
- 澳洲
- 其他亞太國家
- 中東
- 沙烏地阿拉伯
- 阿拉伯聯合大公國
- 土耳其
- 其他中東國家
- 非洲
- 南非
- 奈及利亞
- 其他非洲地區
- 北美洲
第6章 競爭情勢
- 市場集中度
- 策略趨勢
- 市佔率分析
- 公司簡介
- SAP SE
- Microsoft Corporation
- IBM Corporation
- Salesforce, Inc.
- Sphera Solutions, Inc.
- Watershed Technology, Inc.
- Persefoni AI, Inc.
- Greenly SAS
- Plan A ESG GmbH
- Emitwise Ltd
- Normative AB
- Carbon Trust Holdings Limited
- Diligent Corporation
- Workiva Inc.
- ENGIE Impact
- Enablon North America Corporation
- Cority Software Inc.
- Siemens AG
- Schneider Electric SE
- Wolters Kluwer NV
- EcoAct SAS
第7章 市場機會與未來展望
According to Mordor Intelligence, the product carbon footprint (PCF) software market size is projected to expand from USD 2.17 billion in 2025 and USD 2.51 billion in 2026 to USD 5.20 billion by 2031, registering a CAGR of 15.66% between 2026 and 2031.
This report is Segmented by Function (Product Footprint Calculation, Data Collection and Supplier Collaboration, and More), Deployment (Cloud-Based, and On-Premises), Organization Size (Large Enterprises, and Small and Medium Enterprises), Industry Vertical (Energy and Utilities, Food and Beverages, and More), and Geography. The Market Forecasts are Provided in Terms of Value (USD).
Global Product Carbon Footprint (PCF) Software Market Trends and Insights
Regulatory Disclosure Mandates Intensify Product-Level Carbon Reporting
The product carbon footprint (PCF) software market is seeing its strongest demand push from rules requiring embedded emissions data to be part of day-to-day compliance. The EU Carbon Border Adjustment Mechanism entered its definitive phase in January 2026, raising the cost of inaccurate product-level emissions reporting for importers in covered sectors. The revised CSRD omnibus, published in February 2026, narrowed the reporting scope to larger entities, but it also concentrated spending among companies with the scale to formalize supplier carbon data requests across multiple tiers. In the product carbon footprint software market, that shift matters because large regulated buyers often set data standards for much smaller suppliers that still need to respond. The result is a reinforcing cycle in which a compliance requirement at one end of the chain becomes a commercial requirement at the other. Regulatory pressure is therefore shaping not only adoption volume, but also the type of platform features buyers now treat as essential, especially audit trails, traceable calculations, and structured disclosure workflows.
Scope 3 Supplier Data Requirements Expand PCF Software Use Cases
Scope 3 data demands are widening the role of the product carbon footprint (PCF) software market beyond internal footprinting and into supplier engagement. Primary supplier data is now more important because spend-based averages do not hold up well when companies need product-level detail for disclosure, procurement, and customer reporting. Sphera's Supplier PCF Calculator, launched in April 2025, addressed this issue by leveraging a managed database of more than 500,000 verified emission factors and aligning with Catena-X, PACT, and ISO methods. The product carbon footprint (PCF) software market is also attracting smaller suppliers to adopt, as large enterprise customers are increasingly requesting auditable data even when those suppliers lack dedicated sustainability teams. The British Business Bank reported in 2025 that carbon footprint measurement activity was stronger among medium-sized firms than micro-enterprises, but complete supply chain data collection remained limited. That gap is pushing vendors toward simpler onboarding, multilingual supplier portals, and lower-friction pricing models that can widen participation without reducing data quality expectations.
Fragmented Emission Factors and Methodologies Reduce Data Comparability
Fragmentation across databases and methods remains a clear brake on the software market for product carbon footprint (PCF) software. Companies still work across ecoinvent, GaBi, managed proprietary libraries, and supplier-specific datasets, which makes side-by-side product comparisons harder than buyers often expect. Research published in Applied Sciences in 2025 highlighted data integration complexity and technological compatibility as major barriers to the adoption of carbon management systems. Normative also noted in 2026 that CSRD and SBTi-related Scope 3 reporting pressures are pushing firms toward better data quality, even as supplier information remains uneven across reporting tiers. In the product carbon footprint (PCF) software market, this creates a two-part challenge where vendors must support methodological rigor while also helping customers work around incomplete or mismatched upstream data. The result is slower standardization, more buyer caution, and longer proof-of-value cycles before platform decisions are finalized.
Other drivers and restraints analyzed in the detailed report include:
- AI-Assisted Emission Factor Mapping Reduces Calculation Cycle Time
- Carbon Costs Move into Procurement and Product Design Decisions
- Deep ERP, PLM, and Supplier Network Integration Raises Deployment Complexity
For complete list of drivers and restraints, kindly check the Table Of Contents.
Segment Analysis
Product Footprint Calculation held a 35.31% share in 2025, making it the largest function in the product carbon footprint (PCF) software market. Companies cannot delegate the core requirement to produce traceable, defensible product-level calculations when regulations and customers demand evidence. That is why calculation tools remained central even as other functions gained momentum. The function stayed important because every later reporting layer depends on the quality of the original footprint data.
Reporting and Disclosure Automation is projected to grow at a 16.81% CAGR through 2031, which makes it the fastest-growing function in the PCF software market. Workiva's May 2026 update added CDP 2026 Corporate and SME scoring criteria to Sustainability Explorer, demonstrating how buyers are moving toward more structured, repeatable disclosure workflows. The pressure now extends beyond data collection, as companies also need to map it into board-level reporting, assurance requests, and formal submissions. Data Collection and Supplier Collaboration are rising for the same reason, while Scenario Analysis, Decarbonization Planning, Audit Trail, and Verification Management are gaining ground as finance teams increasingly seek carbon outputs to support budget and investment decisions.
Cloud-Based deployment accounted for 62.12% of revenue in 2025, giving it the lead in the product carbon footprint (PCF) software market. This position reflects the practical needs of constant emission factor updates, supplier access across locations, and AI-supported processing, which are harder to manage in purely local environments. Cloud architecture also fits better with standardized API-based exchanges that large buyers increasingly expect from suppliers. The strength of this segment shows that deployment choice is closely tied to operational usability, not just to hosting preference.
Cloud-Based deployment is also expected to record the highest CAGR of 17.84% through 2031, indicating the leading segment is further expanding its role in the product carbon footprint (PCF) software market. SAP expanded SAP Sustainability Footprint Management to AWS infrastructure in Frankfurt and Sao Paulo in early 2026, demonstrating how cloud vendors are localizing infrastructure to meet compliance and residency requirements. On-Premises deployment remains relevant for organizations with strict data control rules or deeply embedded legacy ERP environments. Even there, hybrid operating models are becoming more common, as companies seek local control over sensitive data while still using cloud-based reporting and collaboration tools. Over time, that still pulls the product carbon footprint (PCF) software industry toward a cloud-first structure.
Complete Report Scope:
- By Function
- Product Footprint Calculation
- Data Collection and Supplier Collaboration
- Reporting and Disclosure Automation
- Scenario Analysis and Decarbonization Planning
- Audit Trail and Verification Management
- Other Functions
- By Deployment
- Cloud-Based
- On-Premises
- By Organization Size
- Large Enterprises
- Small and Medium Enterprises
- By Industry Vertical
- Energy and Utilities
- Manufacturing
- Transportation and Logistics
- Food and Beverages
- Pharmaceuticals
- Retail and Consumer Goods
- Other Industry Verticals
- By Geography
- North America
- United States
- Canada
- Mexico
- South America
- Brazil
- Argentina
- Rest of South America
- Europe
- Germany
- United Kingdom
- France
- Italy
- Spain
- Russia
- Rest of Europe
- Asia-Pacific
- China
- India
- Japan
- South Korea
- Australia
- Rest of Asia-Pacific
- Middle East
- Saudi Arabia
- United Arab Emirates
- Turkey
- Rest of Middle East
- Africa
- South Africa
- Nigeria
- Rest of Africa
- North America
Geography Analysis
Europe held 38.19% revenue share in 2025, giving it the lead in the product carbon footprint (PCF) software market. The region combines dense regulation with mature supply chain networks, which gives software adoption a stronger structural base than in most other regions. The EU Carbon Border Adjustment Mechanism and the broader rise of product carbon regulation have made embedded emissions data more relevant to product trade and sourcing decisions. The CSRD omnibus revision in February 2026 narrowed the formal reporting population, but it still concentrated demand among the largest firms, which are best positioned to push requirements down the chain.
North America remained the second-largest regional PCF software market, driven by enterprise demand for stronger carbon data management and disclosure readiness. The region benefits from a mix of investor pressure, cross-border supplier requirements, and growing attention to product-level traceability. Vendors are also building for local operating needs, and SAP's 2026 infrastructure expansion into Brazil alongside its European footprint showed how regional service coverage is becoming part of competitive positioning across the Americas. South America remained earlier stage, and adoption there leaned more toward modular cloud deployment, where budgets and implementation capacity were tighter.
Asia-Pacific is projected to expand at a 17.31% CAGR through 2031, making it the fastest-growing geography in the product carbon footprint software market. China's trial PCF certification rules, launched in March 2025, created a formal product-level certification structure with a standard 90-day cycle and a 2-year validity period. Japan's Ministry of Economy, Trade, and Industry continues to shape lifecycle assessment and carbon footprint policy, which supports more consistent product-level emissions work across industrial sectors. NTT and other Japanese technology companies also published cradle-to-grave PCF calculation rules for software products in March 2026, which showed that regional development is broadening from manufacturing into digital product categories. Middle East and Africa remained early-stage markets, with adoption centered mainly in large multinational operations and early disclosure frameworks rather than broad-based deployment.
- SAP SE
- Microsoft Corporation
- IBM Corporation
- Salesforce, Inc.
- Sphera Solutions, Inc.
- Watershed Technology, Inc.
- Persefoni AI, Inc.
- Greenly SAS
- Plan A ESG GmbH
- Emitwise Ltd
- Normative AB
- Carbon Trust Holdings Limited
- Diligent Corporation
- Workiva Inc.
- ENGIE Impact
- Enablon North America Corporation
- Cority Software Inc.
- Siemens AG
- Schneider Electric SE
- Wolters Kluwer N.V.
- EcoAct SAS
Additional Benefits:
- The market estimate (ME) sheet in Excel format
- 3 months of analyst support
TABLE OF CONTENTS
1 INTRODUCTION
- 1.1 Study Assumptions and Market Definition
- 1.2 Scope of the Study
2 RESEARCH METHODOLOGY
3 EXECUTIVE SUMMARY
4 MARKET LANDSCAPE
- 4.1 Market Overview
- 4.2 Market Drivers
- 4.2.1 Regulatory Disclosure Mandates Intensify Product-Level Carbon Reporting
- 4.2.2 Scope 3 Supplier Data Requirements Expand PCF Software Use Cases
- 4.2.3 Carbon Costs Move Into Procurement and Product Design Decisions
- 4.2.4 AI-Assisted Emission Factor Mapping Reduces Calculation Cycle Time
- 4.2.5 Digital Product Passport Readiness Creates SKU-Level Traceability Demand
- 4.2.6 Sustainability Linked Financing Requires Auditable Product Carbon Data
- 4.3 Market Restraints
- 4.3.1 Fragmented Emission Factors and Methodologies Reduce Data Comparability
- 4.3.2 Deep ERP PLM and Supplier Network Integration Raises Deployment Complexity
- 4.3.3 Privacy Concerns Slow Supplier Disclosure Across Multi-Tier Value Chains
- 4.3.4 Skills Gaps Limit Effective Interpretation of Product Carbon Insights
- 4.4 Industry Value Chain Analysis
- 4.5 Regulatory Landscape
- 4.6 Technological Outlook
- 4.7 Porter's Five Forces Analysis
- 4.7.1 Threat of New Entrants
- 4.7.2 Bargaining Power of Suppliers
- 4.7.3 Bargaining Power of Buyers
- 4.7.4 Threat of Substitutes
- 4.7.5 Competitive Rivalry
- 4.8 Impact of Macroeconomic Factors on the Market
5 MARKET SIZE AND GROWTH FORECASTS (VALUE)
- 5.1 By Function
- 5.1.1 Product Footprint Calculation
- 5.1.2 Data Collection and Supplier Collaboration
- 5.1.3 Reporting and Disclosure Automation
- 5.1.4 Scenario Analysis and Decarbonization Planning
- 5.1.5 Audit Trail and Verification Management
- 5.1.6 Other Functions
- 5.2 By Deployment
- 5.2.1 Cloud-Based
- 5.2.2 On-Premises
- 5.3 By Organization Size
- 5.3.1 Large Enterprises
- 5.3.2 Small and Medium Enterprises
- 5.4 By Industry Vertical
- 5.4.1 Energy and Utilities
- 5.4.2 Manufacturing
- 5.4.3 Transportation and Logistics
- 5.4.4 Food and Beverages
- 5.4.5 Pharmaceuticals
- 5.4.6 Retail and Consumer Goods
- 5.4.7 Other Industry Verticals
- 5.5 By Geography
- 5.5.1 North America
- 5.5.1.1 United States
- 5.5.1.2 Canada
- 5.5.1.3 Mexico
- 5.5.2 South America
- 5.5.2.1 Brazil
- 5.5.2.2 Argentina
- 5.5.2.3 Rest of South America
- 5.5.3 Europe
- 5.5.3.1 Germany
- 5.5.3.2 United Kingdom
- 5.5.3.3 France
- 5.5.3.4 Italy
- 5.5.3.5 Spain
- 5.5.3.6 Russia
- 5.5.3.7 Rest of Europe
- 5.5.4 Asia-Pacific
- 5.5.4.1 China
- 5.5.4.2 India
- 5.5.4.3 Japan
- 5.5.4.4 South Korea
- 5.5.4.5 Australia
- 5.5.4.6 Rest of Asia-Pacific
- 5.5.5 Middle East
- 5.5.5.1 Saudi Arabia
- 5.5.5.2 United Arab Emirates
- 5.5.5.3 Turkey
- 5.5.5.4 Rest of Middle East
- 5.5.6 Africa
- 5.5.6.1 South Africa
- 5.5.6.2 Nigeria
- 5.5.6.3 Rest of Africa
- 5.5.1 North America
6 COMPETITIVE LANDSCAPE
- 6.1 Market Concentration
- 6.2 Strategic Moves
- 6.3 Market Share Analysis
- 6.4 Company Profiles (includes Global Level Overview, Market Level Overview, Core Segments, Financials as available, Strategic Information, Market Rank/Share, Products and Services, Recent Developments)
- 6.4.1 SAP SE
- 6.4.2 Microsoft Corporation
- 6.4.3 IBM Corporation
- 6.4.4 Salesforce, Inc.
- 6.4.5 Sphera Solutions, Inc.
- 6.4.6 Watershed Technology, Inc.
- 6.4.7 Persefoni AI, Inc.
- 6.4.8 Greenly SAS
- 6.4.9 Plan A ESG GmbH
- 6.4.10 Emitwise Ltd
- 6.4.11 Normative AB
- 6.4.12 Carbon Trust Holdings Limited
- 6.4.13 Diligent Corporation
- 6.4.14 Workiva Inc.
- 6.4.15 ENGIE Impact
- 6.4.16 Enablon North America Corporation
- 6.4.17 Cority Software Inc.
- 6.4.18 Siemens AG
- 6.4.19 Schneider Electric SE
- 6.4.20 Wolters Kluwer N.V.
- 6.4.21 EcoAct SAS
7 MARKET OPPORTUNITIES AND FUTURE OUTLOOK
- 7.1 White Space and Unmet Need Assessment

 環境足跡管理市場預測至2034年-按足跡類型、評估範圍、功能模組、合規架構、最終使用者和地區分類的全球分析
 碳足跡管理市場-2026-2032年全球市場預測
 供應鏈碳管理軟體:市場佔有率分析、產業趨勢與統計及成長預測(2026-2031)人工智慧碳足跡管理軟體:市場佔有率分析、產業趨勢與統計、成長預測(2026-2031)範圍 3排放管理軟體:市場佔有率分析、行業趨勢和統計數據以及成長預測(2026-2031 年)
 碳足跡減少市場:全球產業規模、佔有率、趨勢、機會和預測(按解決方案類型、最終用戶和地區分類),競爭格局(2021-2031 年)
 碳足跡管理市場規模、佔有率和趨勢分析報告:按部署類型、類別、最終用途、地區和細分市場預測(2026-2033 年)
 2026-2030年全球人工智慧碳足跡管理市場
 碳足跡管理市場報告:按產品、部署、最終用戶產業和地區分類(2026-2034 年)全球碳管理人工智慧市場預測(至2034年):按組件、部署模式、組織規模、技術、應用、最終用戶和地區分類