


 |
市場調查報告書
商品編碼
2072727
範圍 3排放管理軟體:市場佔有率分析、行業趨勢和統計數據以及成長預測(2026-2031 年)Scope 3 Emissions Management Software - Market Share Analysis, Industry Trends & Statistics, Growth Forecasts (2026 - 2031) |
||||||

※ 本網頁內容可能與最新版本有所差異。詳細情況請與我們聯繫。
根據 Mordor Intelligence 預測,範圍 3排放管理軟體市場規模預計將在 2025 年達到 14.6 億美元,2026 年達到 17.2 億美元,到 2031 年達到 41.8 億美元,2026 年至 2031 年的年複合成長率(CAGR)為 19.43%。
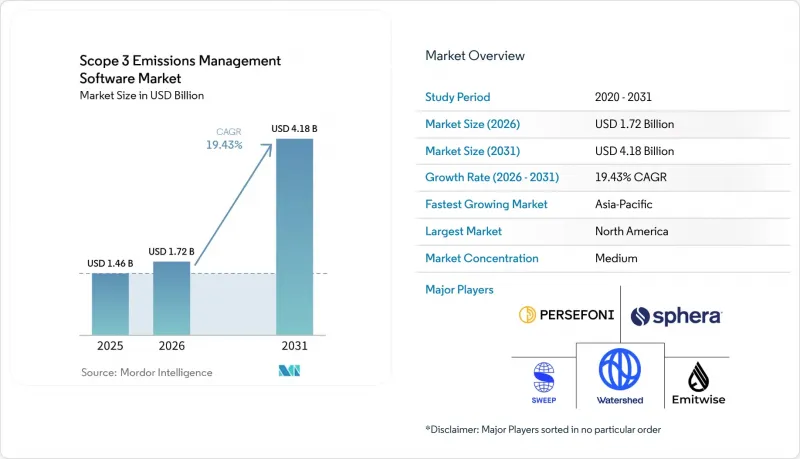
本報告按交付方式(軟體和服務)、部署方式(雲端、本地部署、混合部署)、企業規模(大型企業和中小企業)、應用領域(範圍 3 的計算和披露等)、最終用戶行業(製造業、能源業等)以及地區進行細分。市場預測以美元計價。
全球範圍 3排放管理軟體市場趨勢與洞察
擴大主要經濟區的範圍 3 資訊揭露義務
歐洲和澳洲強制性氣候變遷報告正在推動範圍 3 營運轉向支援可重複控制、審計追蹤和保障工作流程的軟體平台。在歐洲,ESRS E1 繼續將範圍 3 納入受監管公司的報告範圍,這意味著資料收集和計算邏輯直接影響合規性。第一階段報告公司正在準備基於 2026 年數據的披露信息,併計劃於 2027 年發布,這迫使它們從臨時電子表格轉向能夠永續支持年度報告週期的系統。在澳大利亞,第一組營業單位已於 2025 年 1 月開始強制進行氣候變遷揭露,而加州的 SB 253 法案則增加了第二個主要的合規管道,因為更詳細的排放揭露預計將改變公司與同行之間的比較方式以及投資者對公司的評估方式。這種協同效應正在推動範圍 3排放管理軟體市場的發展,因為買家越來越傾向於能夠適應跨行業監管變化的平台。
實現從供應商自動收集數據可以減輕報告的負擔。
由於上游報告品質取決於供應商的持續參與、回應追蹤和檢驗,因此從供應商收集資料已成為範圍 3排放管理軟體市場的核心。根據 CDP 的供應鏈項目,到 2025 年,330 家大型企業買家將要求約 7 萬家供應商披露環境信息,這使得在企業規模上維持人工收集方法變得困難。這種壓力不僅限於發送調查問卷,因為回應的完整性和調查方法的準確性現在會影響資料是否可用於品質保證操作和目標設定。此外,CDP 的研究表明,供應商報告的排放中有 38% 存在重大調查方法錯誤,導致報告值波動 25% 或更多,這凸顯了嵌入式檢驗工具的價值。因此,結合了引導式資料輸入、異常偵測、提醒和排放因子分配等功能的平台,其競爭不僅體現在資料收集量上,也體現在資料的易用性。這一趨勢持續推動著範圍 3排放管理軟體市場的發展,買家願意為減少供應商網路中的報告繁瑣性和減少人工糾正流程而付費。
供應商資料分散,原始資料覆蓋率低
在許多企業專案中,原始資料覆蓋範圍仍然不足,如果供應商沒有更積極參與,軟體在提升報告品質方面所能發揮的作用將十分有限。 Sphera 2025 年的一項調查發現,79% 的組織認為供應商資料的可用性是他們面臨的最大挑戰,62% 的組織認為內部資料的品質是實現準確揭露的主要障礙。這種結構性缺陷一直持續到 2026 年,Sphera 的報告顯示,雖然 89% 的高階主管計劃擴大報告範圍,但 45% 的高階主管對範圍 3 數據的準確性信心不足。隨著更嚴格的法規要求可追溯和可解釋的資訊揭露,這一差距是一個重大問題,但許多資料集仍然依賴供應商不完整的回覆和估計值。買家現在期望平台能夠引導他們從基於支出的估算轉向更易於審計的原始數據,如果供應商準備不足,這種期望可能會延長實施過程。在供應商參與度提高和更加穩定之前,這將繼續減緩範圍 3排放管理軟體市場的成長,導致部署週期延長和保固可靠性降低。
細分市場分析
在範圍 3排放管理軟體市場中,軟體收入在 2025 年佔比高達 71.28%,而服務部分預計到 2031 年將以 21.34% 的複合年成長率成長。這一構成比反映了專用平台的核心作用,這些平台將計算邏輯、揭露範本、工作流程管理和供應商互動工具整合到單一系統中。雲端交付軟體仍然是該領域的核心交付模式,因為買家希望在不延長內部 IT 週期的情況下反映監管更新和方法論變化。然而,授權合約後的實施往往充滿挑戰,因為仍需要手動配置和審查排放範圍、供應商資料品質以及框架一致性。
對服務的需求並非源自於軟體需求的下降,而是源自於營運準備程度的提升。許多公司發現,購買工具比整理有效使用這些工具所需的資料快得多。根據 Sphera 2026 年的一份報告,雖然 89% 的公司計劃擴展範圍 3 報告,但仍有 45% 的公司對其數據的準確性信心不足,這為託管支援和諮詢服務留下了明顯的市場空間。因此,將實施支援、數據諮詢和保障準備支援打包到其平台中的供應商,正在超越初始訂閱協議,為客戶創造更多價值。純粹的 SaaS 供應商如果想在規模更大、監管更嚴格的採購週期中保持市場佔有率,就必須面臨壓力,要么直接擴展其服務範圍,要么與專業機構合作。
在範圍 3排放管理軟體市場,預計到 2025 年,雲端模式將佔據 66.45% 的市場佔有率,而混合模式預計到 2031 年將以 22.12% 的複合年成長率成長。雲端模式之所以仍佔據主導地位,是因為它維護負擔更輕、功能更新速度更快,並且與現代財務和採購系統高度親和性。然而,最詳細的活動資料通常儲存在 ERP 交易記錄、運輸系統和採購資料庫中,而許多公司仍然在本地或私有雲端環境中運行這些系統。正因如此,混合架構正在迅速發展,因為它允許公司在現有系統中保留敏感的營運記錄,同時利用雲端的分析和報告功能。
SAP 2026 年的產品更新展示了供應商如何應對這項需求。具體而言,這些更新包括增強以 ERP 為核心的運輸相關碳足跡計算功能,以及在工作流程中添加特定國家/地區的供應鏈排放資料集。這些功能至關重要,因為混合部署能夠更清晰地展現從原始交易到最終報告的碳足跡的“監管鏈”,這對於管理和審計追蹤日益重要。儘管獨立的本地部署模式正在失去市場佔有率,但其底層基礎設施對於許多大型企業的架構仍然至關重要。無法接取這種環境的供應商可能會失去那些對資料沿襲、資料主權、整合深度以及報告速度要求極高的企業級訂單。
區域分析
到2025年,北美將佔據全球範圍3排放管理軟體市場規模的35.40%。美國是該地區需求的主要驅動力,這主要得益於加州SB 253法案及相關氣候資訊揭露法規促使大型企業採用更正式的範圍3報告系統。這使得採購重點從一次性測量任務轉向能夠支援持續資料收集、文件記錄和外部審查的平台。該地區的採購趨勢也反映出對人工智慧驅動的工作流程的強勁需求,因為企業希望更快地組織數據、建立場景模型並將其與財務和採購數據整合。在這種環境下,那些已經與企業操作系統整合並能降低大型客戶切換阻力的供應商具有優勢。
歐洲仍是範圍 3排放管理軟體市場第二大地區。 《企業永續性報告指令》(CSRD) 將符合資格的報告公司的範圍 3 資訊揭露納入 ESRS E1 的範疇,這持續支撐著全部區域對可審計報告工作流程的需求。第一階段符合資格的公司正準備在 2027 年報告 2026 年的數據,但綜合修正案推遲了後續階段的報告。雖然這改變了時間安排,但並未消除對軟體投資的必要性。此外,歐盟委員會的價值鏈上限限制了大規模報告公司可以從小規模供應商取得的資訊量,從而影響了供應商互動工具能夠收集的上游原始資料的深度。德國憑藉其強大的工業基礎,仍然是強勁的需求中心,而法國則擁有密集的供應商生態系統,支援區域創新。
預計到2031年,亞太地區將以25.67%的複合年成長率成長,成為範圍3排放管理軟體市場成長最快的地區。在澳大利亞,自2025年1月起,第一類營業單位已被要求披露氣候變遷訊息,該框架已擴展至第二類營業單位和範圍3實體,並於2026年7月生效。出口導向供應鏈也在推動全部區域的需求,因為供應商越來越需要碳數據來滿足買家的需求和跨境報告要求。南美、中東和非洲仍處於起步階段,其採用主要受跨國公司、大型國內企業以及參與跨境供應鏈的報告要求所驅動。
其他好處:
- Excel格式的市場預測(ME)表
- 3個月的分析師支持
目錄
第1章:引言
- 研究假設和市場定義
- 調查範圍
第2章:調查方法
第3章執行摘要
第4章 市場狀況
- 市場概覽
- 市場促進因素
- 擴大主要經濟區的範圍 3 資訊揭露義務
- 供應商資料收集自動化可以減輕報告工作的負擔。
- 投資者和客戶要求價值鏈透明度的壓力
- 基於人工智慧和支出計算的排放估算降低了准入門檻。
- 過渡到符合審計要求的永續發展管理系統和資料處理歷程。
- 採購主導的脫碳計畫正在擴大軟體預算。
- 市場限制因素
- 供應商資料分散,原始資料覆蓋率低
- 不同研究框架之間調查方法上的差異限制了它們的可比較性。
- 與 ERP、採購和 ESG 系統整合的複雜性。
- 中端市場買家面臨預算限制和銷售週期過長的問題
- 產業價值鏈分析
- 宏觀經濟因素對市場的影響
- 監理情勢
- 技術展望
- 波特五力分析
第5章 市場規模與成長預測
- 報價
- 軟體
- 服務
- 部署模式
- 基於雲端的
- 現場
- 混合
- 按公司規模
- 大公司
- 小型企業
- 透過使用
- 範圍 3 的計算與揭露
- 與供應商合作及一手資料收集
- 價值鏈脫碳計劃
- 保證、管治、合規
- 按最終用戶行業分類
- 製造業和工業
- 零售和消費品
- 能源、公共產業、自然資源
- 運輸/物流
- BFSI
- 資訊科技/通訊
- 醫療保健和生命科學
- 政府/公共部門
- 其他終端用戶產業
- 按地區
- 北美洲
- 美國
- 加拿大
- 墨西哥
- 南美洲
- 巴西
- 阿根廷
- 其他南美國家
- 歐洲
- 德國
- 英國
- 法國
- 義大利
- 西班牙
- 俄羅斯
- 荷蘭
- 其他歐洲國家
- 亞太地區
- 中國
- 日本
- 印度
- 韓國
- 澳洲和紐西蘭
- 其他亞太國家
- 中東
- 沙烏地阿拉伯
- 阿拉伯聯合大公國
- 其他中東國家
- 非洲
- 南非
- 奈及利亞
- 其他非洲國家
- 北美洲
第6章 競爭情勢
- 市場集中度
- 策略趨勢
- 市佔率分析
- 公司簡介
- Watershed
- Persefoni, LLC
- Sweep SAS
- Green Project Technologies Inc.
- Altruistiq Limited
- Greenly SAS
- Sphera Solutions, Inc.
- Ecovadis SAS
- Salesforce, Inc.
- Microsoft Corporation
- SAP SE
- IBM Corporation
- Wolters Kluwer NV
- ENGIE Impact, LLC
- Schneider Electric SE
- Carbonflow
- Certivo
- Workiva Inc.
- FigBytes Inc.
- Normative AB
- Plan A Technologies GmbH
- Optera, Inc.
- Position Green AB
第7章 市場機會與未來展望
According to Mordor Intelligence, the scope 3 emissions management software market was valued at USD 1.46 billion in 2025 and is estimated to grow from USD 1.72 billion in 2026 to reach USD 4.18 billion by 2031, at a CAGR of 19.43% during 2026-2031.
This report is Segmented by Offering (Software, and Services), Deployment Mode (Cloud-Based, On-Premises, and Hybrid), Enterprise Size (Large Enterprises, and Small and Medium Enterprises), Application (Scope 3 Accounting and Disclosure, and More), End-User Industry (Manufacturing and Industrial, Energy, and More), and Geography. The Market Forecasts are Provided in Terms of Value (USD).
Global Scope 3 Emissions Management Software Market Trends and Insights
Rising Scope 3 Disclosure Mandates Across Major Economies
Mandatory climate reporting rules in Europe and Australia are moving Scope 3 work onto software platforms that can support repeatable controls, audit trails, and assurance-readiness workflows. In Europe, ESRS E1 continues to keep Scope 3 within the reporting perimeter for in-scope companies, meaning data gathering and calculation logic now carry direct compliance consequences. Wave 1 reporters are preparing disclosures on 2026 data for 2027 publication, which pushes companies to replace ad hoc spreadsheets with systems that can sustain year-after-year reporting cycles. Australia already brought Group 1 entities into mandatory climate disclosure in January 2025 andV. California's SB 253 added a second major compliance channel, because fuller emissions disclosure is expected to alter peer comparisons and investor evaluation inputs. This combination is supporting the Scope 3 Emissions Management Software Market, because buyers increasingly prefer platforms that can absorb rule changes across sectors.
Supplier Data Collection Automation Reduces Reporting Friction
Supplier data collection has become the operational core of the Scope 3 Emissions Management Software Market, as upstream reporting quality depends on consistent supplier outreach, response tracking, and validation. CDP's supply chain program showed in 2025 that 330 leading corporate buyers requested environmental disclosures from nearly 70,000 suppliers, making manual collection methods hard to sustain at an enterprise scale. The pressure is not limited to sending questionnaires, because response completeness and methodological accuracy now influence whether the data can be used in assurance and target-setting work. CDP also found that 38% of supplier-reported emissions contained methodological errors large enough to change reported values by more than 25%, which raised the value of built-in validation tools. Platforms that combine guided data entry, anomaly flags, reminders, and emission-factor assignment are therefore competing on data usability rather than on collection volume alone. That dynamic continues to drive the Scope 3 Emissions Management Software Market, as buyers pay for lower reporting friction and fewer manual correction loops across supplier networks.
Fragmented Supplier Data And Low Primary Data Coverage
Primary data coverage remains thin across many enterprise programs, limiting how far software can improve reporting quality without stronger supplier participation. Sphera found in 2025 that 79% of organizations cited supplier data availability as a top challenge, and 62% cited internal data quality as a major barrier to accurate disclosure. The same structural weakness persisted in 2026, when Sphera reported that 45% of business leaders had only limited confidence in the accuracy of Scope 3 data, even though 89% planned to expand reporting coverage. This gap matters because greater regulation requires traceable, explainable disclosures, while many datasets still rely on partial supplier responses and estimates. Buyers now expect platforms to show a path from spend-based estimation toward more auditable primary data, and that expectation lengthens implementation work where supplier readiness is weak. Until supplier participation deepens and becomes more consistent, this will continue to slow the Scope 3 Emissions Management Software Market by stretching deployment timelines and limiting assurance confidence.
Other drivers and restraints analyzed in the detailed report include:
- Investor And Customer Pressure On Value-Chain Transparency
- AI-Assisted Spend-Based Emissions Estimation Lowers Entry Barriers
- Methodology Differences Across Frameworks Limit Comparability
For complete list of drivers and restraints, kindly check the Table Of Contents.
Segment Analysis
Software accounted for 71.28% of revenue in 2025, while services are projected to grow at a 21.34% CAGR through 2031 in the Scope 3 Emissions Management Software Market. This mix reflects the central role of purpose-built platforms that bring together calculation logic, disclosure templates, workflow controls, and supplier engagement tools into a single system. Cloud-delivered software remains the core delivery model in this segment, as buyers want regulatory updates and method changes reflected without long internal IT cycles. At the same time, implementation work often becomes more difficult after the license is signed, because emissions boundaries, supplier data quality, and framework alignment still require manual configuration and review.
That service demand is tied to operational readiness rather than to weak software demand, because many companies can buy the tool faster than they can organize the data needed to use it well. Sphera reported in 2026 that 89% of companies planned to expand Scope 3 reporting, while 45% still had only limited confidence in data accuracy, which leaves clear room for managed support and advisory work. Vendors that package implementation, data consulting, and assurance-readiness support with the platform are therefore extending customer value beyond the initial subscription. Pure SaaS providers face pressure to add service capacity directly or work with specialist partners if they want to stay relevant in larger and more regulated buying cycles.
Cloud held 66.45% share in 2025, while hybrid is projected to expand at a 22.12% CAGR through 2031 in the Scope 3 Emissions Management Software Market. Cloud remains the leading model because it lowers maintenance burdens, speeds feature updates, and fits well with modern finance and procurement systems. Even so, the most detailed activity data often resides in ERP transaction records, transport systems, and procurement databases that many enterprises still run in on-premises or private cloud environments. That is why hybrid architecture is gaining momentum, because it lets companies keep sensitive operational records in established systems while using cloud analytics and reporting layers on top.
SAP's 2026 product updates showed how vendors are adapting to this need, with extended ERP-centric transport footprint calculations and additional country-specific supply chain emissions datasets inside the workflow. These features matter because hybrid deployment supports a clearer chain of custody from the source transaction to the reported footprint, which is increasingly valuable for controls and audit trails. Standalone on-premises models are losing share, yet the underlying infrastructure remains critical in many large-company architectures. Vendors that cannot connect to that environment risk losing enterprise deals where data lineage, sovereignty, and integration depth matter as much as reporting speed.
Complete Report Scope:
- By Offering
- Software
- Services
- By Deployment Mode
- Cloud-Based
- On-Premises
- Hybrid
- By Enterprise Size
- Large Enterprises
- Small and Medium Enterprises
- By Application
- Scope 3 Accounting and Disclosure
- Supplier Engagement and Primary Data Collection
- Value-Chain Decarbonization Planning
- Assurance, Governance and Compliance
- By End-user Industry
- Manufacturing and Industrial
- Retail and Consumer Goods
- Energy, Utilities and Natural Resources
- Transportation and Logistics
- BFSI
- IT and Telecom
- Healthcare and Life Sciences
- Government and Public Sector
- Other End-user Industries
- By Geography
- North America
- United States
- Canada
- Mexico
- South America
- Brazil
- Argentina
- Rest of South America
- Europe
- Germany
- United Kingdom
- France
- Italy
- Spain
- Russia
- Netherlands
- Rest of Europe
- Asia-Pacific
- China
- Japan
- India
- South Korea
- Australia and New Zealand
- Rest of Asia-Pacific
- Middle East
- Saudi Arabia
- United Arab Emirates
- Rest of Middle East
- Africa
- South Africa
- Nigeria
- Rest of Africa
- North America
Geography Analysis
North America accounted for 35.40% of the Scope 3 Emissions Management Software Market size in 2025. The United States drove most regional demand because California's SB 253 and related climate disclosure rules pushed large companies toward more formal Scope 3 reporting systems. This changed procurement priorities from one-off measurement exercises to platforms that can support recurring data collection, documentation, and external review. The regional buying pattern also reflects strong demand for AI-supported workflows, because enterprises want faster cleanup, scenario modeling, and integration with finance and procurement data. That environment favors vendors that already connect to enterprise operating systems and can reduce switching friction inside large accounts.
Europe remained the second-largest geography in the Scope 3 Emissions Management Software Market. CSRD kept Scope 3 disclosure within ESRS E1 for in-scope reporters, which continues to anchor demand for auditable reporting workflows across the region. Wave 1 companies are preparing to report on 2026 data in 2027, while the Omnibus changes delayed later reporting waves, shifting the timing but not removing the need for software investment. The European Commission's value chain cap also limits how much information large reporters can require from smaller suppliers, which affects how deeply supplier-engagement tools can push for primary upstream data. Germany remains a strong demand center because of its industrial base, while France contributes a dense vendor ecosystem that supports regional innovation.
Asia-Pacific is projected to grow at a 25.67% CAGR through 2031, making it the fastest-growing region in the Scope 3 Emissions Management Software Market. Australia required Group 1 entities to begin mandatory climate disclosures in January 2025 and extended the framework to Group 2 entities from July 2026, with Scope 3 included in scope. Export-oriented supply chains are also reinforcing demand across the region, as suppliers increasingly need carbon data to meet buyer requests and cross-border reporting requirements. South America, the Middle East, and Africa remain earlier-stage markets, with adoption led mainly by multinational reporting requirements, large domestic enterprises, and cross-border supply-chain participation.
- Watershed
- Persefoni, LLC
- Sweep SAS
- Green Project Technologies Inc.
- Altruistiq Limited
- Greenly SAS
- Sphera Solutions, Inc.
- Ecovadis SAS
- Salesforce, Inc.
- Microsoft Corporation
- SAP SE
- IBM Corporation
- Wolters Kluwer N.V.
- ENGIE Impact, LLC
- Schneider Electric SE
- Carbonflow
- Certivo
- Workiva Inc.
- FigBytes Inc.
- Normative AB
- Plan A Technologies GmbH
- Optera, Inc.
- Position Green AB
Additional Benefits:
- The market estimate (ME) sheet in Excel format
- 3 months of analyst support
TABLE OF CONTENTS
1 INTRODUCTION
- 1.1 Study Assumptions and Market Definition
- 1.2 Scope of the Study
2 RESEARCH METHODOLOGY
3 EXECUTIVE SUMMARY
4 MARKET LANDSCAPE
- 4.1 Market Overview
- 4.2 Market Drivers
- 4.2.1 Rising Scope 3 Disclosure Mandates Across Major Economies
- 4.2.2 Supplier Data Collection Automation Reduces Reporting Friction
- 4.2.3 Investor And Customer Pressure On Value-Chain Transparency
- 4.2.4 AI-Assisted Spend-Based Emissions Estimation Lowers Entry Barriers
- 4.2.5 Shift Toward Audit-Ready Sustainability Controls And Data Lineage
- 4.2.6 Procurement-Led Decarbonization Programs Expand Software Budgets
- 4.3 Market Restraints
- 4.3.1 Fragmented Supplier Data And Low Primary Data Coverage
- 4.3.2 Methodology Differences Across Frameworks Limit Comparability
- 4.3.3 Integration Complexity With ERP, Procurement, And ESG Stacks
- 4.3.4 Budget Pressure For Mid-Market Buyers And Long Sales Cycles
- 4.4 Industry Value-Chain Analysis
- 4.5 Impact of Macroeconomic Factors on the Market
- 4.6 Regulatory Landscape
- 4.7 Technological Outlook
- 4.8 Porter's Five Forces Analysis
- 4.8.1 Bargaining Power of Buyers
- 4.8.2 Bargaining Power of Suppliers
- 4.8.3 Threat of New Entrants
- 4.8.4 Threat of Substitutes
- 4.8.5 Intensity of Comptetive Rivalry
5 MARKET SIZE AND GROWTH FORECASTS (VALUE)
- 5.1 By Offering
- 5.1.1 Software
- 5.1.2 Services
- 5.2 By Deployment Mode
- 5.2.1 Cloud-Based
- 5.2.2 On-Premises
- 5.2.3 Hybrid
- 5.3 By Enterprise Size
- 5.3.1 Large Enterprises
- 5.3.2 Small and Medium Enterprises
- 5.4 By Application
- 5.4.1 Scope 3 Accounting and Disclosure
- 5.4.2 Supplier Engagement and Primary Data Collection
- 5.4.3 Value-Chain Decarbonization Planning
- 5.4.4 Assurance, Governance and Compliance
- 5.5 By End-user Industry
- 5.5.1 Manufacturing and Industrial
- 5.5.2 Retail and Consumer Goods
- 5.5.3 Energy, Utilities and Natural Resources
- 5.5.4 Transportation and Logistics
- 5.5.5 BFSI
- 5.5.6 IT and Telecom
- 5.5.7 Healthcare and Life Sciences
- 5.5.8 Government and Public Sector
- 5.5.9 Other End-user Industries
- 5.6 By Geography
- 5.6.1 North America
- 5.6.1.1 United States
- 5.6.1.2 Canada
- 5.6.1.3 Mexico
- 5.6.2 South America
- 5.6.2.1 Brazil
- 5.6.2.2 Argentina
- 5.6.2.3 Rest of South America
- 5.6.3 Europe
- 5.6.3.1 Germany
- 5.6.3.2 United Kingdom
- 5.6.3.3 France
- 5.6.3.4 Italy
- 5.6.3.5 Spain
- 5.6.3.6 Russia
- 5.6.3.7 Netherlands
- 5.6.3.8 Rest of Europe
- 5.6.4 Asia-Pacific
- 5.6.4.1 China
- 5.6.4.2 Japan
- 5.6.4.3 India
- 5.6.4.4 South Korea
- 5.6.4.5 Australia and New Zealand
- 5.6.4.6 Rest of Asia-Pacific
- 5.6.5 Middle East
- 5.6.5.1 Saudi Arabia
- 5.6.5.2 United Arab Emirates
- 5.6.5.3 Rest of Middle East
- 5.6.6 Africa
- 5.6.6.1 South Africa
- 5.6.6.2 Nigeria
- 5.6.6.3 Rest of Africa
- 5.6.1 North America
6 COMPETITIVE LANDSCAPE
- 6.1 Market Concentration
- 6.2 Strategic Moves
- 6.3 Market Share Analysis
- 6.4 Company Profiles (includes Global Level Overview, Market Level Overview, Core Segments, Financials as available, Strategic Information, Market Rank/Share, Products and Services, Recent Developments)
- 6.4.1 Watershed
- 6.4.2 Persefoni, LLC
- 6.4.3 Sweep SAS
- 6.4.4 Green Project Technologies Inc.
- 6.4.5 Altruistiq Limited
- 6.4.6 Greenly SAS
- 6.4.7 Sphera Solutions, Inc.
- 6.4.8 Ecovadis SAS
- 6.4.9 Salesforce, Inc.
- 6.4.10 Microsoft Corporation
- 6.4.11 SAP SE
- 6.4.12 IBM Corporation
- 6.4.13 Wolters Kluwer N.V.
- 6.4.14 ENGIE Impact, LLC
- 6.4.15 Schneider Electric SE
- 6.4.16 Carbonflow
- 6.4.17 Certivo
- 6.4.18 Workiva Inc.
- 6.4.19 FigBytes Inc.
- 6.4.20 Normative AB
- 6.4.21 Plan A Technologies GmbH
- 6.4.22 Optera, Inc.
- 6.4.23 Position Green AB
7 MARKET OPPORTUNITIES AND FUTURE OUTLOOK
- 7.1 White-space and Unmet-Need Assessment

 環境足跡管理市場預測至2034年-按足跡類型、評估範圍、功能模組、合規架構、最終使用者和地區分類的全球分析
 碳足跡管理市場-2026-2032年全球市場預測
 產品碳足跡(PCF)軟體:市場佔有率分析、產業趨勢與統計、成長預測(2026-2031)供應鏈碳管理軟體:市場佔有率分析、產業趨勢與統計及成長預測(2026-2031)人工智慧碳足跡管理軟體:市場佔有率分析、產業趨勢與統計、成長預測(2026-2031)
 碳足跡減少市場:全球產業規模、佔有率、趨勢、機會和預測(按解決方案類型、最終用戶和地區分類),競爭格局(2021-2031 年)
 碳足跡管理市場規模、佔有率和趨勢分析報告:按部署類型、類別、最終用途、地區和細分市場預測(2026-2033 年)
 2026-2030年全球人工智慧碳足跡管理市場
 碳足跡管理市場報告:按產品、部署、最終用戶產業和地區分類(2026-2034 年)全球碳管理人工智慧市場預測(至2034年):按組件、部署模式、組織規模、技術、應用、最終用戶和地區分類